October 2018
|
October 2018 // Volume 56 // Number 6 // Tools of the Trade // v56-6tt1


Grazing Demonstration Plots Help Managers Understand Grazing Concepts
Abstract
Grazing management concepts can be hard for learners to grasp in a classroom setting. A grazing demonstration plot is a useful field tool that Extension professionals can implement to visually illustrate how various grazing regimes affect grass health and yields. Specifically, the educator can show how forage harvest timing, frequency, and intensity affect aboveground plant biomass production. A grazing demonstration plot has become a tool of the trade for a small number of Extension professionals in Colorado's Front Range. As a result, land managers in the area have been better able to evaluate how to meet their own needs while considering the importance of addressing environmental impacts and stewarding the land for future generations.
Introduction
Pastures are the foundation of most livestock operations and can be a sustainable agricultural system due to the natural ecological connection of grazing livestock, the soil, and pasture plants (Rinehard, 2006). Along Colorado's Front Range and throughout the western United States, pastures are an important component of numerous operations, but my observations have indicated that grazing management is highly varied. A small demonstration plot simulating grazing is a tool educators can apply to illustrate the advantages of addressing stubble height and grazing timing to improve pastures. Through a review of the literature in the Journal of Extension, I found no articles addressing such a tool. Therefore, my purpose herein is to describe a perhaps unfamiliar resource that Extension professionals can use to promote effective pasture management practices.
Demonstration Plot Setup and Implementation
A busy Extension agent can easily implement a grazing demonstration plot as an educational tool. The plot is simple and inexpensive to set up, takes only 1–2 hr every other week to maintain, and can provide hands-on learning opportunities for multiple years.
Plot Setup
An Extension agent wishing to set up a grazing demonstration plot can use the following steps:
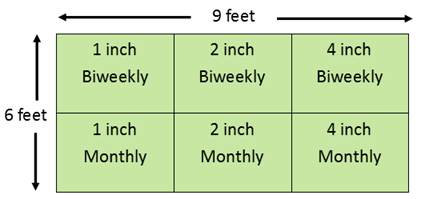
- Identify a grass area with consistent vegetation, soils, and slope in which to locate the plot. If the plot is in an area that will be grazed, use fencing to keep grazing livestock out of the plot. Create a 6-ft-by-9-ft plot. Divide the plot into six 3-ft-by-3-ft squares, each of which will receive a different grazing treatment via hand clipping.
- Throughout the growing season, hand clip each square according to one of the following regimes (see Figure 1): 1-in. height clipped biweekly, 2-in. height clipped biweekly, 4-in. height clipped biweekly, 1-in. height clipped monthly, 2-in. height clipped monthly, 4-in. height clipped monthly.
- For each square, collect and air-dry the clippings and store them in a labeled bag. From the dried clippings, calculate total harvested yield and dry matter per acre for each square. The conversion factor to be applied to clippings from a square is as follows: Total grams (minus weight of bag) x 10.7 = pounds of forage per acre. In addition to forage yields, data related to factors such as total precipitation or irrigation, soil compaction, and soil surface temperature can be collected. Additionally, visual differences will become notable over time.
Figure 1.
Example Plot Layout
Implementation
In 2015, a small team of Extension professionals (including myself), U.S. Department of Agriculture Natural Resources Conservation Service conservationists, and local conservation district representatives was formed. We implemented two grazing demonstration plots in Colorado, one on irrigated pasture and one on dryland pasture. Every year, team members hold pasture walks, workshops, and in-field grazing discussions at the plots to highlight the results of the various regimes and the effects of pasture stubble height and grazing intervals on overall pasture condition, root development, and water infiltration.
A demonstration plot simulates multiple grazing regimes in a small space. It visually demonstrates to land managers how grazing heights and recovery time affect yields and grass stand health. For many pasture managers to be willing to implement changes, transformation in pasture management must be directly related to economic feasibility. A grazing demonstration plot illustrates that chronic overgrazing is detrimental to plants, soils, and wallets. With the yield data our team collects, we can show a decrease in yield over time in the squares that are clipped at low heights. Moreover, overgrazing causes increased costs for applied inputs, such as fertilizer, irrigation, and reseeding. These economic impacts are motivating factors for change.
Results
Over 250 landowners and students have visited our demonstration plots since 2015. According to workshop evaluations and anecdotal evidence, using the demonstration plots as an educational tool has resulted in an overall increase in understanding of grazing impacts and soil health. The grazing demonstration plots provide space for networking and have piqued an interest among local livestock and horse grazers regarding pasture management and soil health.
An important facet of using grazing demonstration plots is that they provide a visual reference for participants. For example, in our dryland squares clipped at 1 in., weeds take over within 3 years. Feedback from past workshops has indicated that the visual impact of the demonstration plots provides an "aha" moment for many participants in their understanding of grazing management as they visually observe the results of concepts we try to explain in fact sheets and classrooms. We have found that the visual impact of the demonstration, especially on the dryland plot, is more influential than the yield data.
At workshops, we use the plots to demonstrate the relationship between soil and plants. By comparing soil temperature across plots, we can discuss how vegetation coverage influences evaporation of soil moisture. We also dig up roots to compare the sizes and depths of root masses under different management conditions.
We also have found that the plots provide an opportunity for peer-to-peer learning. The in-field discussions afford the opportunity to network with collaborating producers and agriculture professionals. Producers often need this type of encouragement to try something different (Jensen et al., 2009).
Conclusion
Management knowledge and ability is pivotal in making any grazing system effective. Extension professionals can use grazing demonstration plots to enhance audience understanding of grazing management concepts such as forage harvest timing, frequency, and intensity. Such plots demonstrate the effects of various grazing regimes on aboveground plant biomass production. As a result, Extension work with land managers can be more influential in teaching the relationship that exists across grazing livestock, soil, and plants.
Acknowledgments
Thank you to Joe Brummer (Colorado State University), Glenn Shewmaker (University of Idaho Extension), and Steven Fransen (Washington State University Extension) for providing technical support and encouragement regarding the implementation of our grazing demonstration plots.
References
Jensen, K. S., Cheyney, C., Hawkins, J., Grey, C. W., Shewmaker G., Williams, S., . . . Gerrish, J. R. (2009). Lost Rivers Grazing Academy: Building sustainability in livestock production. Journal of Extension, 47(1), Article 1IAW4. Available at https://www.joe.org/joe/2009february/iw4.php
Rinehard, L. (2006). Pasture, rangeland, and grazing management. Retrieved from https://attra.ncat.org/attra-pub/viewhtml.php?id=246