April 2020
|
April 2020 // Volume 58 // Number 2 // Research In Brief // v58-2rb3


Implementation of Drone System in Survey for Tomato Chlorotic Spot Virus
Abstract
As a cutting-edge technology, drone systems have shown great potential in agriculture. This article elucidates the implementation of a drone with a multispectral sensing system in a field survey for tomato chlorotic spot virus in south Florida. The findings demonstrate that drone technology can provide growers with precise and timely information about disease incidence and distribution in a labor-saving manner for decision making in crop management to mitigate yield loss. We provide recommendations for Extension professionals regarding educating producers on applying the technology to manage their crops efficiently.
Introduction
With rapid developments in artificial intelligence, the application of drone technology has been emerging in agriculture, especially in field surveys for plant disorders and precision farming (David, 2013). Compared to traditional approaches to remote imaging involving satellites and piloted aircrafts, the use of drone technology is less costly and can provide flexible unmanned platforms in small- or large-scale fields (Candiago, Remondino, Giglio, Dubbini, & Gattelli, 2015). In recent years, the application of drone systems associated with high resolution cameras and specific sensors has allowed for generating remote images with very small pixel sizes—ground sample distance of less than 1 in. This technology has provided important opportunities related to precision farming, timely decision making and adjustment of management practices in agriculture and forestry, and geosciences applications (Bendig, Bolten, & Bareth, 2012; Grenzdörffer, Engel, & Teichert, 2008; Ouédraogo, Degré, Debouche, & Lisein, 2014; Primicerio et al., 2012; Westoby, Brasington, Glasser, Hambrey, & Reynolds, 2012). Speaking more specifically, such systems have been used worldwide for the following activities: surveying for and mapping soil properties, estimating vineyard canopy leaf area index, detecting and mapping sunflower nitrogen status, detecting weeds, detecting missing plants or dead spots in vegetable fields, estimating crop biomass with nutrient levels, surveying for plant diseases, spraying agrichemicals, assessing drip irrigation efficiency with thermal sensors, calculating fluorescence, temperature, and narrow band indexes, establishing relationships between photosynthesis and chlorophyll fluorescence, and managing livestock on pastures (Abbas, Khan, Hussain, Hanjra, & Akbar, 2013; Agüera, Carvaja, & Perez, 2011; Bendig et al., 2014; Calderón, Montes-Borrego, Landa, Navas-Cortes, & Zarco-Tejada, 2014; Daneshkhu, 2016; Huang, Hoffman, Lan, Fritz, & Thomson, 2015; Jimenez-Bello, Royuela, Manzano, Zarco-Tejada, & Intrigliolo, 2013; Mathews & Jensen, 2013; Peña, Torres-Sánchez, Serrano-Pérez, de Castro, & López-Granados, 2015; Vega, Ramíreza, Saiza, & Rosúab, 2015; Wang, 2019; Zarco-Tejada, Catealina, González, & Martín, 2013; Zarco-Tejada, González-Dugo, & Berni, 2012). In addition, drone technology has potential application in Extension agricultural programming for adults and 4-H youths (De Koff, 2017; Villegas, 2016).
The applicability of drone technology in agriculture depends on the drone type and the sensing system. Human eyes are able to see only a narrow band of light, a spectrum ranging from 400 nm to 700 nm. On the other hand, some sensors can detect invisible light, especially the near-infrared (NIR) band, at which the wavelength is beyond 700 nm. With the development of specified sensors associated with corresponding software for collecting and processing data, more applications of drones in agriculture will be available soon. In many cases, however, ground verification is still important with use of this technology. Although it is impossible to completely replace a ground survey, combining a ground survey with drone technology can save time and labor cost due to the need to perform only spot verification versus walking an entire field to conduct a crop assessment or pest scouting.
Tomato is an economically important agricultural commodity in south Florida. With the state's favorable subtropical climate, tomato is grown throughout the winter season. Tomato chlorotic spot virus (TCSV) is a new virus that is causing devastating damage to the tomato industry in Florida and may potentially spread to other regions of the United States. TCSV was initially detected in south Florida (Londoño, Capobianco, Zhang, & Polston, 2012). Severe outbreaks of the disease have occurred since the 2014–2015 growing season, causing significant yield loss (Poudel et al., 2019; Zhang et al., 2019; Zhang et al., 2016). To scout the disease incidence and monitor the spread of the disease, growers conventionally have had to walk through an entire field to check and count every plant with TCSV infection. When an outbreak of plant disease occurs, growers are eager to obtain help from Extension professionals because time means money in such urgent situations. However, because conventional scouting is time-consuming, especially on a large scale, Extension professionals can find it challenging to obtain results quickly enough to help growers with their decision making. The time delays associated with conventional approaches often frustrate growers. In this article, we describe implementation of a drone system in a field survey assessing the incidence and distribution of the disease caused by TCSV to assist south Florida vegetable producers in rapidly and efficiently addressing the disease. Findings from our research suggest that Extension professionals can implement such an approach to educate agricultural producers on the use of drone technology in assessing crop diseases, regardless of commodity.
Materials and Methods
Our case study was a 10-ac field with tomato (Solanum lycopersicum, cultivar: Sanibel) planted in early October, 2018, on raised beds. Prior to planting, we applied granular fertilizer, conducted soil fumigation, placed driplines for irrigation and fertigation, and covered the field with plastic mulch. Farmworkers transplanted healthy tomato seedlings to each bed 3 weeks after soil fumigation. They applied a liquid fertilizer weekly through the driplines as fertigation at a nitrogen rate of 1.0 lb per acre per day starting from 6 weeks after planting. Three times during the season, at different growth stages, they installed metal rebar stakes in each bed to hold plants tied with nylon strings. They applied irrigation and pest control practices regularly, according to the tomato pest management farm plan in the region.
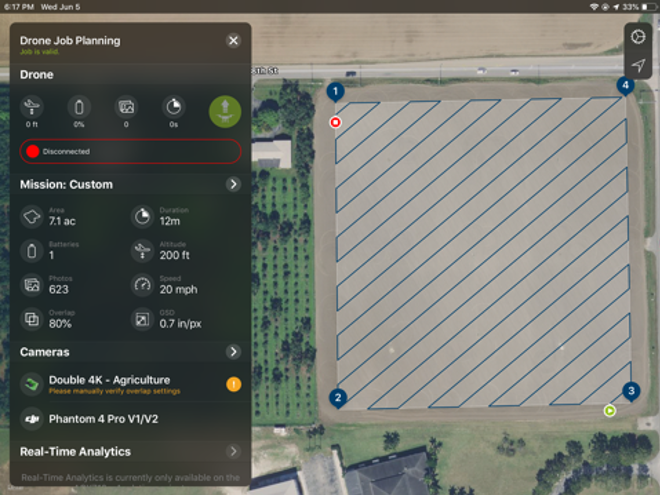
We used a DJI Phantom 4 Professional drone with a preinstalled multispectral sensor (double 4k agriculture). This system is able to simultaneously collect images of red, green and blue (RGB) color, NIR (near-infrared light), normalized difference vegetation index (NDVI), and normalized difference red edge (NDRE). We set up an autonomous flight with a mobile application (FieldAgent) downloaded to an iPhone, marked each corner of the selected field, and chose the following parameters (Figure 1): flight overlap 80%, altitude of 200 ft above the ground, speed of 20 mph, and flight orientation initially adjusted toward the wind direction for smooth image capture. In this case, the flight orientation was adjusted from southwest to northeast because of a light wind (about 5 mph) from northeast. When all the parameters were set properly and satellites were well connected, we launched the drone by tapping the take-off icon. The data were automatically collected and stored in two separate micro secure digital (SD) cards, one for the drone camera and the other for the sensor.
Figure 1.
Setup of an Autonomous Flight with Corresponding Parameters
Upon the drone's completing the flight on December 17, 2018, we transferred the data from both micro SD cards to a computer. We processed the data with data processing software (FieldAgent) by uploading the data to the cloud, via a high-speed Internet connection, for image stitching and data analysis.
To verify the result, the two plant pathologists on our author team conventionally conducted ground surveys three times, on November 15 and November 30, 2018, and January 15, 2019. Each survey was in a different location in the same field to allow for adequate assessment of the disease incidence via counting the numbers of healthy and infected plants. We compared the data with the results obtained from the drone system. We analyzed the data from each ground survey by applying Fisher's protected least significant difference test at p < .05 using SAS software (Version 9.4, Cary, NC).
Results and Discussion
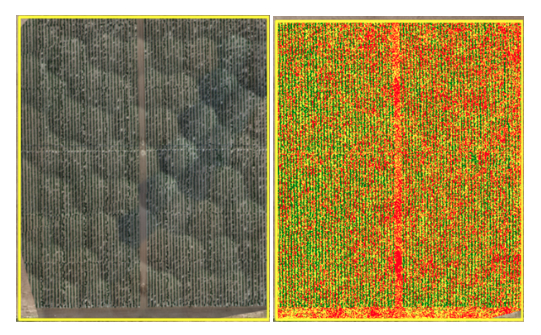
Upon completing the processing of the data transferred from the micro SD cards via the FieldAgent software, all individual pictures were stitched together and different layers of images, such as RGB and NDVI mosaic images (Figure 2), were generated. A set of quick mosaic images was generated immediately, whereas had super high resolution images been needed, we would have had to request those from the company (Sentera) and paid processing fees.
Figure 2.
Full Mosaic Images of Red, Green, and Blue (RGB) (left) and Normalized Difference Vegetation Index (NDVI) (right)
With FieldAgent, we created management zones for the field from the quick mosaic images based on plant health status (red = dead or dying, yellow = infected, and green = healthy) associated with NDVI values (Figure 3). This version of the image was more meaningful for understanding the severity and distribution of the plant disease. The imagery within the management zones indicated a clear pattern of the disease incidence. The severe infection of TCSV started in the northeast corner of the field (top right of image) and spread south and southwest in the field (bottom and bottom left of image), displayed as the distribution of red and yellow colors of NDVI (Figure 3).
Figure 3.
Management Zones of Normalized Difference Vegetation Index (NDVI) with Severity and Distribution of Tomato Chlorotic Spot Virus in the Tomato Field
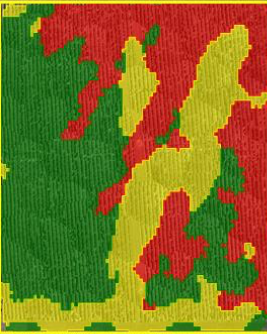
Note: Red = dead or dying plants, yellow = infected plants, and green = healthy plants.
Verification at different observed spots indicated that the same pattern of disease was shown by the RGB, NIR, NDVI, and NDRE images simultaneously generated by the system. These images were overlaid with one another, and all showed the same result (Figure 4).
Figure 4.
Tomato Plants in Severely Infected Area (left) Versus Healthy Area (right)
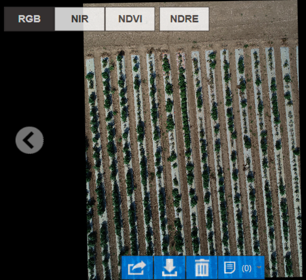
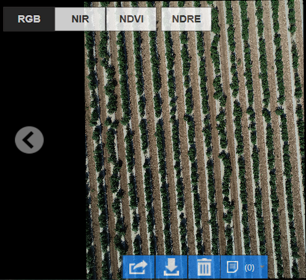
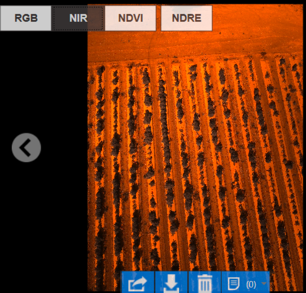
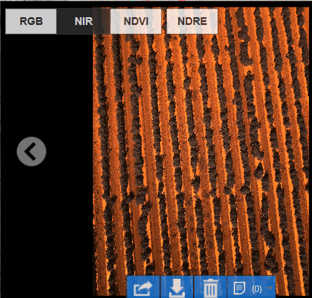
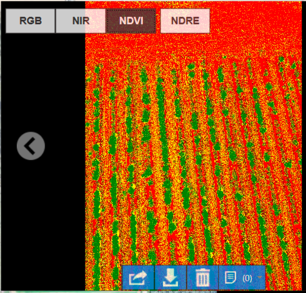
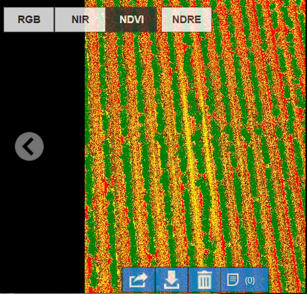
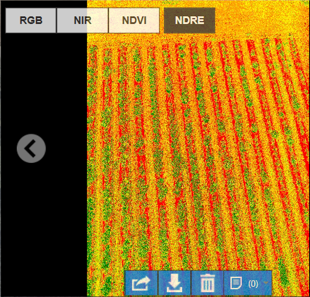
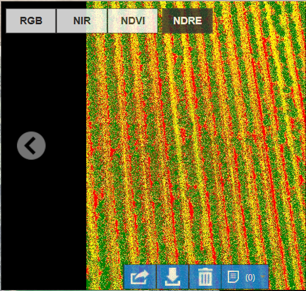
Note: RGB = red, green, and blue. NIR = near-infrared. NDVI = normalized difference vegetation index. NDRE = normalized difference red edge.
The imagery shows that many more plants died or were dying in the infected area as compared to in the healthy area. These results matched well with both the photographs taken from the ground (Figure 5) and the observations from ground surveys (Table 1). For example, the ground photos and survey observations also indicated that the incidence of TCSV infection was greater at the northeast corner of the field and lessened in the south and southwest.
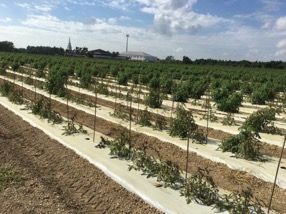
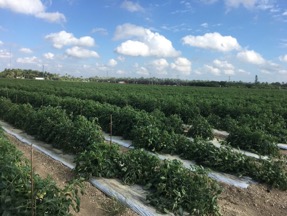
Figure 5.
Field Observations of Infected Plants at Field's Northeast Corner (left) Versus Healthy Plants at Field's Southwest Corner (right)
| Surveyed location | 11/15/2018 | 11/30/2018 | 1/15/2019 |
|---|---|---|---|
| Northeast corner | 8.0 a | 69.5 a | 77.3 a |
| Middle east area | 4.4 bc | 56.3 b | — |
| Southeast corner | 3.6 bcd | 43.5 c | 63.8 ab |
| Middle north area | 4.8 b | 36.3 cd | 51.3 bc |
| Northwest corner | 4.5 bc | 32.8 cd | 41.3 c |
| Middle area | 4.0 bcd | 25.2 def | — |
| Middle south area | 1.5 d | 20.3 f | — |
| Middle west area | 2.1 bcd | 22.1 ef | — |
| Southwest corner | 1.8 cd | 24.5 def | — |
| Note. Values followed by the same letter(s) within the column indicate no significant difference at p < .05. | |||
The cause of the TCSV outbreak in this field is unclear, but the distribution pattern of the incidence might be related to the surrounding environment. In fact, at the northeast corner of the field right across a road intersection, there had been a palm tree grove for about 20 years. It is unknown yet whether these palm trees are the host of TCSV. However, massive weeds under the palm trees could be an important contributor of TCSV carried by insect vectors, especially thrips, via wind.
Implementation of drone technology can provide a rapid and convenient approach to surveying the incidence and determining the distribution of a viral disease in a field. In the case we studied, if applying a conventional approach by walking through the field, one person might cover only about 2 ac in a day. However, it took only about 10–15 min to cover more than 20 ac by drone flight and only about 1 or 2 hr to generate quick mosaic images and identify management zones, indicating great advantages in time savings through implementation of this technology. The cost of mentioned devices ($5,000) might be a concern, but the technology has had a trend of decreasing in price. Application of the technology will soon be one of the important measures Extension professionals can use to help and educate farmers in managing their crops easily and efficiently.
Conclusion
Implementing the drone technology with a multispectral sensing system for plant health was demonstrated. Detecting the incidence and distribution of TCSV infection shows great potential in disease assessment with rapid, precise, and reliable results. The drone survey results matched well with the ground survey findings. By using corresponding software, one can generate management zones on the basis of plant health, demonstrating the important advantage of applying this technology in making decisions about farming practices. In addition, implementation of a drone system can provide quick, labor-cost-saving, and real-time information for Extension professionals in helping growers manage their crops efficiently, regardless of region or crop type.
Acknowledgments
We express sincere thanks to Florida Department of Agricultural and Consumer Services for financial support, Dr. Kelly Morgan and Mr. James Fletcher at University of Florida Institute of Food and Agriculture Sciences for their coordination of the Statewide Best Management Practice Program, and Mr. Kern Carpenter at Carpenter Farms for allowing us to use his field in our study.
References
Abbas, A., Khan, S., Hussain, N., Hanjra, M. A., & Akbar, S. (2013). Characterizing soil salinity in irrigated agriculture using a remote sensing approach. Physics and Chemistry of the Earth, Parts A/B/C, 55–57, 43–52.
Agüera, F., Carvaja, F., & Perez, M. (2011). Measuring sunflower nitrogen status from an unmanned aerial vehicle-based system and an on the ground device. Proceedings of the Conference on Unmanned Aerial Vehicle in Geomatics, 38, 1/C22. September 14–16, 2011, Zurich, Switzerland.
Bendig, J., Bolten, A., & Bareth, G. (2012). Introducing a low-cost mini-UAV for thermal- and multispectral-imaging. International Archives of the Photogrammetry. Remote Sensing and Spatial Information Science, 39, 345–349.
Bendig, J., Bolten, A., Bennertz, S., Broscheit, J., Eichfuss, S., & Bareth, G. (2014). Estimating biomass of barley using crop surface models (CSMs) derived from UAV-based RGB imaging. Remote Sensing, 6, 10395–10412.
Calderón, R., Montes-Borrego, M., Landa, B. B., Navas-Cortes, J. A., & Zarco-Tejada, P. J. (2014). Detection of downy mildew of opium poppy using high-resolution multi-spectral and thermal imagery acquired with an unmanned aerial vehicle. Precision Agriculture, 15(6), 639–661.
Candiago, S., Remondino, F., Giglio, M. D., Dubbini, M., & Gattelli, M. (2015). Evaluation multispectral images and vegetation indices for precision farming application from UAV images. Remote Sensing, 7, 4026–4047.
Daneshkhu, S. (2016). Drones part of leap in agriculture technology. Business Day. Retrieved from http://www.bdlive.co.za/business/innovation/2016/01/19/drones-part-of-leap-in-agriculture-technology
David, J. M. (2013). Twenty-five years of remote sensing in precision agriculture: Key advances and remaining knowledge gaps. Biosystems Engineering, 114, 358–371.
De Koff, J. P. (2017). Drones in Extension programming: Implementation of adult and youth activities. Journal of Extension, 55(6), Article v55-6a6. Available at: https://joe.org/joe/2017december/a6.php
Grenzdörffer, G. J., Engel, A., & Teichert, B. (2008). The photogrammetric potential of low-cost UAVs in forestry and agriculture. International Archives of the Photogrammetry. Remote Sensing and Spatial Information Science, 37(B1), 1207–1214.
Huang, Y. B., Hoffman, W. C., Lan, Y., Fritz, B. K., & Thomson, S. J. (2015). Development of a low-volume sprayer for an unmanned helicopter. Journal of Agricultural Science, 7(1), 148–153.
Jimenez-Bello, M. A., Royuela, A., Manzano, J., Zarco-Tejada, P. J., & Intrigliolo, D. (2013). Assessment of drip irrigation sub-units using airborne thermal imagery acquired with an unmanned aerial vehicle (UAV). In J. V. Stafford (Ed.), Precision Agriculture, 13, 705–711. Wageningen, Netherlands: Wageningen Academic Publishers.
Londoño, A., Capobianco, H., Zhang, S., & Polston, J. E. (2012). First record of tomato chlorotic spot virus in the USA. Tropical Plant Pathology, 37, 333–337.
Mathews, A. J., & Jensen, J. L. R. (2013). Visualizing and quantifying vineyard canopy LAI using an unmanned aerial vehicle (UAV) collected high density structure from motion point cloud. Remote Sensing, 5, 2164–2183.
Ouédraogo, M. M., Degré, A., Debouche, C., & Lisein, J. (2014). The evaluation of unmanned aerial system-based photogrammetry and terrestrial laser scanning to generate DEMs of agricultural watersheds. Geomorphology, 214, 339–355.
Peña, J. M., Torres-Sánchez, J., Serrano-Pérez, A., de Castro, A. I., & López-Granados, F. (2015). Quantifying efficacy and limits of unmanned aerial vehicle (UAV) technology for weed seedling detection as effected by sensor resolution. Sensors, 15, 5609–5626.
Poudel, B., Abdalla, O., Liu, Q., Wang, Q., McAvoy, E., Seal, D., . . . Zhang, S. (2019). Field distribution and disease incidence of tomato chlorotic spot virus, an emerging virus threatening tomato production in south Florida. Tropical Plant Pathology, 44(5), 430–437.
Primicerio, J., Di Gennaro, S. F., Fioriloo, E., Genesio, L., Lugato, E., Meatese, A., & Vaccari, F. P. (2012). A flexible unmanned aerial vehicle for precision agriculture. Precision Agriculture, 13, 517–523.
Vega, F. A., Ramíreza, F. C., Saiza, M. P., & Rosúab, F. O. (2015). Multi-temporal imaging using an unmanned aerial vehicle for monitoring a sunflower crop. Biosystems Engineering, 132, 19–27.
Villegas, V. (2016). Drones in agriculture for STEM/STEAM education. Retrieved from http://blogs.oregonstate.edu/agdrones4steam/2016/06/25/drones-agriculture-steam-workshop/
Wang, Q. (2019). Demonstration of drone technology to improve crop management in vegetable production. Proceedings of Florida Society of Horticultural Science, 132.
Westoby, M. J., Brasington, J., Glasser, N. F., Hambrey, M. J., & Reynolds, J. M. (2012). Structure-from-motion photogrammetry: A low-cost, effective tool for geoscience applications. Geomorphology, 179, 300–314.
Zarco-Tejada, P. J., Catealina, A., González, M. R., & Martín, P. (2013). Relationships between net photosynthesis and steady-state chlorophyll fluorescence retrieved from airborne hyperspectral imagery. Remote Sensing of Environment, 136, 247–258.
Zarco-Tejada, P. J., González-Dugo, V., & Berni, J. A. J. (2012). Fluorescence, temperature and narrow-band indices acquired from a UAV platform for water stress detection using a micro-hyperspectral imager and thermal camera. Remote Sensing of Environment, 117, 322–337.
Zhang, S., Fan, X., Fu, Y., Wang, Q., McAvoy, E., & Seal, D. (2019). Field evaluation of tomato cultivars for tolerance to tomato chlorotic spot tospovirus. Plant Health Progress, 20, 77–82.
Zhang, S., Fu, Y., Fan, X., Seal D., Wang, Q., & McAvoy, E. (2016). Management of tomato chlorotic spot virus, an emerging tospovirus of tomato causing severe losses in south Florida (Abstract). Paper presented at the 2016 Annual Meeting of the American Phytopathological Society, Tampa, FL.