August 2019
|
August 2019 // Volume 57 // Number 4 // Ideas at Work // v57-4iw5


Engage Stakeholders in Program Evaluation: Throw Them a Party!
Abstract
A data party is an engaging way to involve stakeholders in program evaluation. We explain the use of a data party for engaging 4-H program stakeholders (e.g., staff and volunteers) in data interpretation and helping them understand, embrace, and use program evaluation information to make data-driven decisions about their programs. We present two tools that can be used for presenting data in a clear and meaningful way: data place mats and gallery walks. We also provide information on the process we used, our lessons learned, and the utility of data parties in Extension programming.
Background
Engaging stakeholders in program evaluation can be difficult but is critical for rendering better and more useful evaluations. Program evaluation is too often a one-way flow of information. It is not commonly looped back into the program where stakeholders provide an "insider's insight" to evaluators about what the data may mean and where stakeholders can use evaluation feedback to improve programs.
A creative way to loop back and engage stakeholders in program evaluation is to hold a "data party" (Franz, 2013, 2018). This is a form of participatory evaluation (e.g., Bhattacharyya, Templin, Messer, & Chazdon, 2017) but is limited to stakeholder involvement in data analysis, review, and interpretation of study results. While participatory evaluation approaches are common in many areas of Extension, they are not as well employed within 4-H. We used data parties to develop a fuller interpretation of program data and promote more engagement in program evaluation with 4-H stakeholders. We focused specifically on the data interpretation phase of evaluation (for data analysis examples, see Franz, 2013, 2018).
Data Party Structure
We used multiple data parties to engage California 4-H Youth Development Program stakeholders in the practice of interpreting program evaluation results. The data were from studies on two topics: overnight camping programs and program participant retention.
For the research on evaluation of overnight camping programs (Lewis, Bird et al., 2018), we conducted data parties following the 2016, 2017, and 2018 camp seasons. The data parties included members of the California 4-H Camp Advisory Committee, county-based 4-H staff, and youth and adult camp volunteers. The content of each data party focused on previous-year statewide evaluation results. The objectives were for camp and county staff to learn about overnight camping program results from the overall state and to review results from their specific camps. We discussed the evaluation findings with the camp staff and the larger group to generate ideas for improving their camps in the upcoming year.
We conducted the second set of data parties using data from the Youth Retention Study (YRS) (Lewis, Ewers et al., 2018; Miller et al., 2016). The YRS assesses the experience of first-year 4-H club members to help evaluate where 4-H might strengthen its club program. At these data parties, we sought to engage 4-H staff and adult volunteers in exploring the data and gain their perspectives on the results and the study direction. In total, we held five YRS data parties in 2018 at regional conferences or trainings for Cooperative Extension staff and volunteers.
For both topics, at the start of each data party, we gave a brief review of the study details (location, who responded, how data were collected) as well as an introduction to the practice and expectations of a data party. We then led activities using two tools to present the data and facilitate discussions. During small-group and full-group discussions, we acted as guides, moderators, and prompters. Our role was to provide explanations of the data as needed, ensure that all participants' voices were shared, and prompt discussions when needed. Herein, we focus on the tools and associated processes we used during our data parties; Franz (2018) summarized best practices for implementing data parties that should be considered as well.
Tools for Sharing Data and Facilitating Discussion
We used two tools for presenting our data: data place mats (Pankaj & Emery, 2016) and a gallery walk of data posters (Titcomb, 2010). A data place mat includes a focused set of results and discussion prompts to aid in the interpretation of those results. A gallery walk consists of a series of posters that summarize findings (usually one finding per poster) and include discussion questions or prompts to facilitate discussion. Table 1 summarizes these tools and how they were used. Figure 1 shows a sample place mat from a camp data party, and Figure 2 shows a sample gallery walk poster from a YRS data party. At the end of each data party, participants created an action plan for program improvement. For example, the camp data party participants generated ideas for changes they planned to implement in their camps the following year. Figure 3 shows participants at a camp data party.
| Tool | Format | Data presented | Process |
|---|---|---|---|
| Data place mat |
|
|
|
| Gallery walk |
|
|
|
Figure 1.
Sample Data Place Mat (Front, Back)
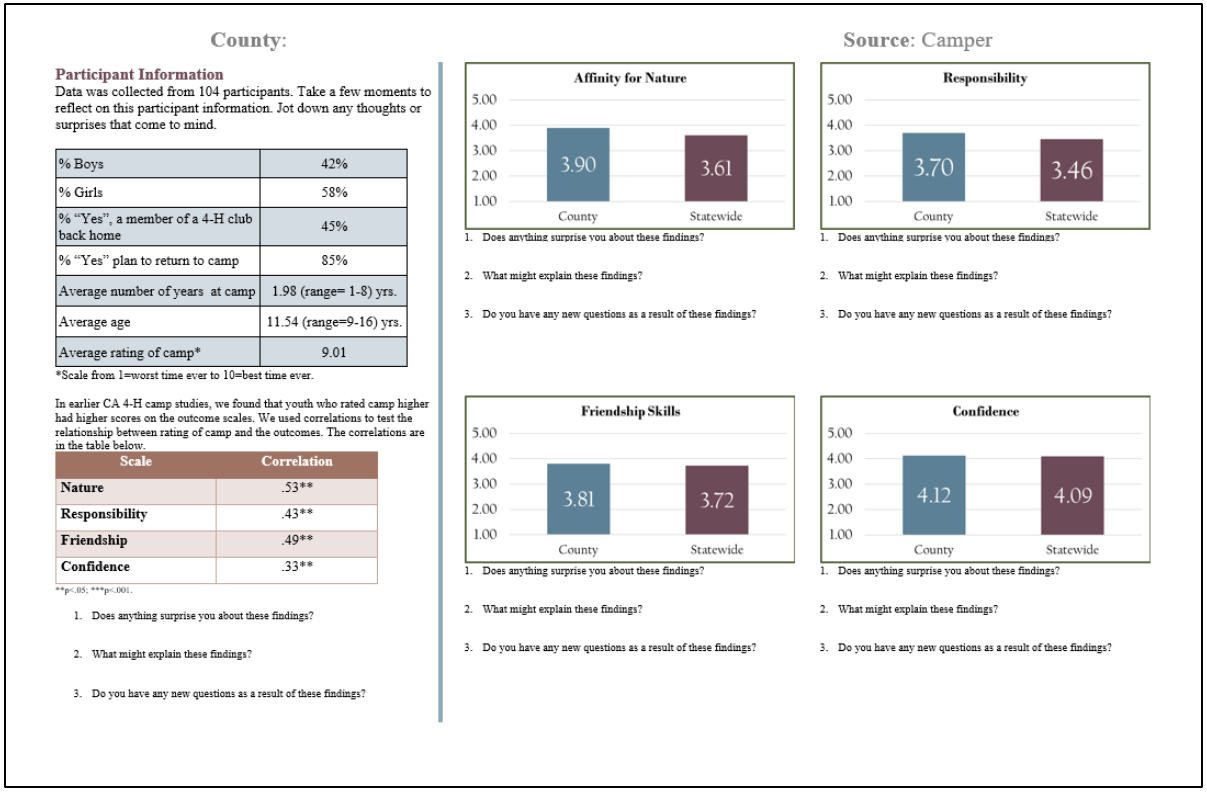
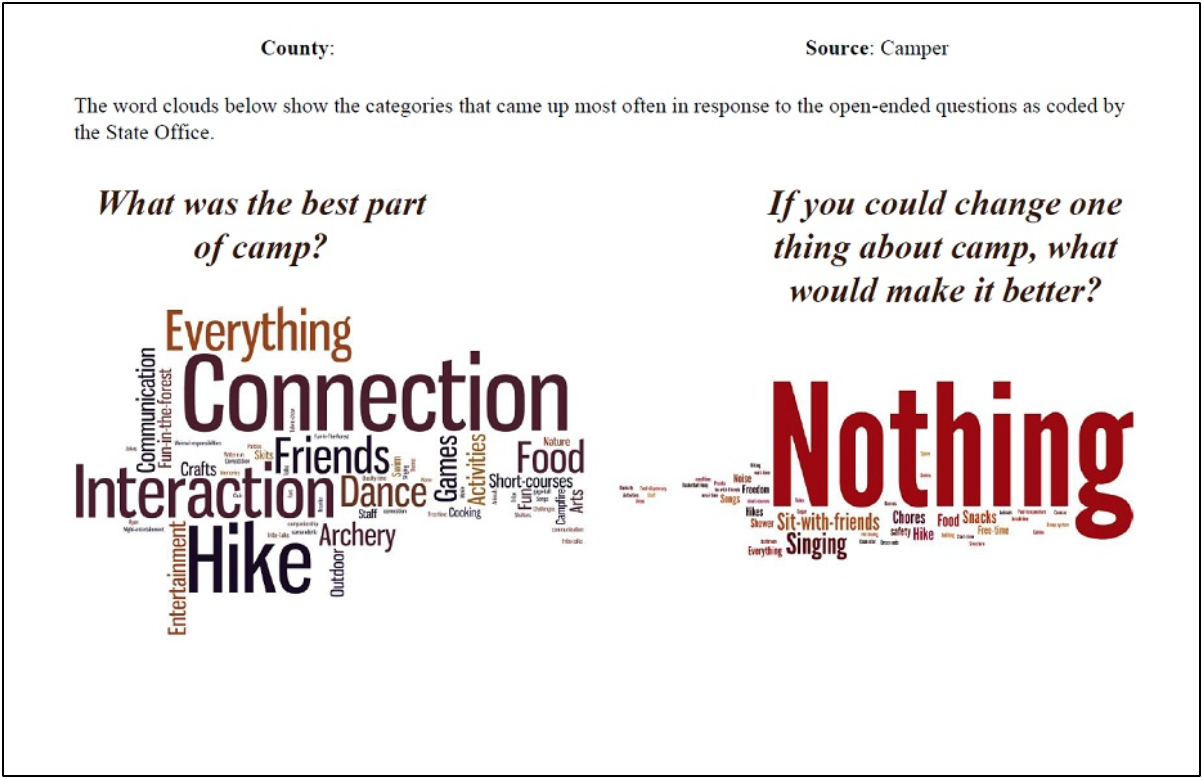
Figure 2.
Sample Gallery Walk Poster
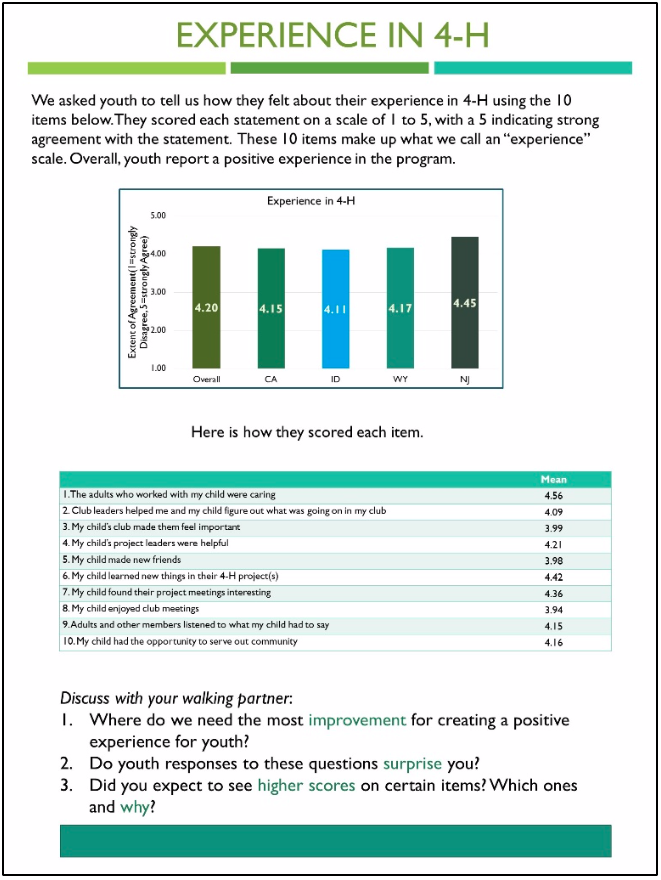
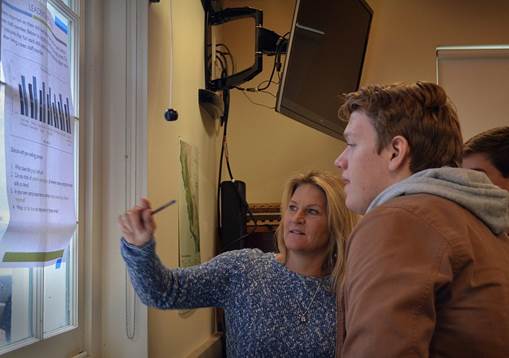
Figure 3.
Participants at a Camp Data Party
Lessons Learned
Table 2 provides several suggestions for improving the data party participant experience. Other tips and suggestions can be found in the "Data Party Toolkit": http://4h.ucanr.edu/files/289885.pdf.
| Portion of data party | Suggestions for an improved experience |
|---|---|
| Data place mat |
|
| Gallery walk |
|
| Overall data party |
|
Conclusions
The 4-H experiential learning model involves three main components: do, reflect, and apply. Reflection is critical to advancing learning, and data parties create an opportunity for reflecting on evaluation data. Applying evaluation is not important only for youths learning through their projects; it is critical in the same iterative way for those developing and sustaining programs. Program evaluation utility is enhanced when evaluation information is integrated back into program development.
Our data parties helped participants understand, embrace, and use data by empowering them to do their own interpretation. Participants in turn became better equipped to make data-driven decisions about their programs. Participants also devised other ways to use data parties, such as with financial stakeholders, volunteers, or planning committees. We as researchers benefited by gaining new insights, from the practitioners' perspective, into the data. The data parties also gave us future directions in terms of analyses and next steps in our studies.
The following comments capture the general feedback from the participants:
"I really enjoyed the gallery walk and listening to the Ah-Ha moments as people processed the information. The discussions were rich as the different people in my group saw where change could help their camps become a rich and safe experience for youth. I think a data party is a useful tool in helping camp professionals design an exemplary camp experience."
"We will be having a [local] meeting to share the data, discussing our current policies and job descriptions and working toward making positive changes based on this information."
Data parties can help stakeholders develop appreciation for program evaluation and see evaluation as an integral part of their work and help researchers refine their instruments and develop more informed interpretations of data. The data party concept can be applied beyond 4-H or the program evaluation context—it is useful to any Extension professional interested in engaging stakeholders in dialogue about data.
References
Bhattacharyya, R., Templin, E., Messer, C., & Chazdon, S. (2017). Participatory evaluation and learning: A case example involving ripple effects mapping of a tourism assessment program. Journal of Extension, 55(2), Article 2FEA3. Available at: https://www.joe.org/joe/2017april/a3.php
Franz, N. K. (2013). The data party: Involving stakeholders in meaningful data analysis. Journal of Extension, 51(1), Article 1IAW2. Available at: https://www.joe.org/joe/2013february/iw2.php
Franz, N. K. (2018). Data parties I have known: Lessons learned and best practices for success. Journal of Extension, 56(4), Article 4TOT2. Available at: https://www.joe.org/joe/2018august/tt2.php
Henderson, S., & Segal, E. H. (2013). Visualizing qualitative data in evaluation research. In T. Azzam & S. Evergreen (Eds.), Data visualization, Part 1. New Directions for Evaluation, 139 (pp. 53–71). https://doi.org/10.1002/ev.20067
Lewis, K. M., Bird, M., Wilkins, T., Borba, J., Nathaniel, K., & Schoenfelder, E. (2018). Developing a common evaluation tool for camps. Journal of Youth Development, 13, 306–315. doi:10.5195/jyd.2018.539
Lewis, K. M., Ewers, T., Miller, J. C., Bird, M., Borba, J., Hill, R., . . . Trzesniewski, K. (2018). Addressing retention in youth programs: A survey for understanding families' experiences. Journal of Extension, 56(3), Article 3TOT3. Available at: https://joe.org/joe/2018june/tt3.php
Miller, J., Lewis, K. M., Bird, M., Borba, J., Ewers, T., Hill, R., . . . Trzesniewski, K. (2016, October). The all important first impression: Parent & guardian perceptions of their first year in 4-H. Paper presented at the National Association of Extension 4-H Agents, New Orleans, LA.
Pankaj, V., & Emery, A. K. (2016). Data placemats: A facilitative technique designed to enhance stakeholder understanding of data. In R. S. Fierro, A. Schwartz, & D. H. Smart (Eds.), Evaluation and Facilitation: New Directions for Evaluation, 149 (pp. 81–93). https://doi.org/10.1002/ev.20181
Titcomb, A. (2010, September 30). Allison Titcomb on gallery walks [Blog post]. Retrieved from http://aea365.org/blog/tag/gallery-walk/