October 2018
|
October 2018 // Volume 56 // Number 6 // Research In Brief // v56-6rb9


Relationship of Adult and Child Dietary Intakes in Michigan and Implications for Programming Region-Wide
Abstract
Healthful dietary intakes are crucial for stemming the current childhood obesity epidemic. We examined the dietary intakes of 392 Michigan children aged 1–12 years. About 70% and 58% of children ate fruits and vegetables, respectively, each day; 26% drank sugar-sweetened beverages; and 31% ate with a television on. Children's vegetable intakes were significantly and moderately correlated with their parents' vegetable intakes (r = .34–.38), but their fruit intakes were more related to their grandparents' fruit intakes (r = .31). Due to the relative representativeness of our sample and similarities in eating patterns across the region, Extension professionals may consider our study findings when designing tailored nutrition education programs for families in the midwestern United States.
Introduction
Childhood obesity has become a worldwide epidemic; the obesity prevalence was 18.5% in the years 2015–2016 among U.S. children aged 2–19 years (Skinner, Ravanbakht, Skelton, Perrin, & Armstrong, 2018). Regional data tell a more specific story. Although the national average childhood obesity rate leveled off from 2003 to 2014 (Skinner et al., 2018), the childhood obesity rate in the midwestern United States increased over a similar time period from 14.5% to 15.8% (National Conference of State Legislatures, 2016). In general, there is a relative similarity in residents' eating patterns in the Midwest that applies, in part, to the important factor of fruit and vegetable (F/V) consumption by children. Data from the Centers for Disease Control and Prevention illustrate this point. The percentages of adults who consume F/V less than one time per day in Illinois, Indiana, Iowa, Michigan, and Ohio range from 35.6% to 40.5% for fruits and 23.2% to 27.3% for vegetables (Centers for Disease Control and Prevention [CDC], 2017b). The percentages of adolescents in grades 9–12 consuming F/V less than one time per day in these states range from 36.1% to 44.7% for fruits and 35.1% to 42.3% for vegetables (CDC, 2017b).
Energy-related factors, including unhealthful dietary intakes, decreased physical activity, and short sleep duration, contribute to the current childhood obesity epidemic (Han, Lawlor, & Kimm, 2010). As an example, young children's consumption of unhealthful foods increased from 1989 to 2008, resulting in an increase of total energy intake of 109 kcal per day (Ford, Slining, & Popkin, 2013). The most important factor affecting children's dietary intakes is the family eating environment, which includes parents' dietary intakes and the foods parents provide to children (Fitzgerald & Spaccarotella, 2009). Parental modeling of eating habits can help shape children's values and beliefs related to foods and eating behaviors (Kim, 2016; Palfreyman, Haycraft, & Meyer, 2015). Specifically, literature has shown an association between parents' and their children's intakes of F/V and sweet foods (Fisk et al., 2011; Hebestreit et al., 2017). Moreover, large food portions served at home are associated with children's daily energy intake, resulting in weight gain over time (Birch, Savage, & Fisher, 2015). Conversely, making F/V available and accessible to children can increase their F/V consumption (Mathias et al., 2012). Another factor negatively affecting children's dietary intakes is television viewing, which leads to an increase in exposure to advertisements for high-energy, low-nutrient foods (Harrison, Liechty, & The Strong Kids Program, 2012). Children who eat with a television on are more likely to eat more fast food and less F/V (Avery, Anderson, & McCullough, 2017).
Many studies have been conducted to examine the association between children's and parents' dietary intakes. However, findings have been mixed (Wang, Beydoun, Li, Liu, & Moreno, 2011). Additionally, we were unable to find statistics on the dietary intakes among children aged 2–12 years in the midwestern United States. Given the lack of data and the similarity in residents' eating habits across the region, we determined that studying dietary intakes among children in Michigan could facilitate the future development of childhood obesity interventions in the Midwest, including Extension programs. Therefore, to inform healthful dietary intake education in the midwestern United States, we undertook a study aimed at (a) describing the dietary intakes in a typical week of Michigan children aged 1–12 years, (b) examining the factors associated with children's dietary intakes, and (c) exploring the relationship between child dietary intakes and adult participant dietary intakes.
Methods
Data Collection
Michigan State University regularly conducts the State of the State Survey (SOSS) of a random sample of 1,000 Michigan adults aged 18 years or older (Pierce, 2015). The survey involves the use of computer-assisted telephone interviewing system technology to reach participants on their mobile or landline phones. From February to December 2014, we collected data from families with at least one child aged 1–12 years as a supplement to the SOSS. If multiple children in one family were eligible for our study, we randomly selected only one child for participation. The SOSS data collectors contacted each adult participant to obtain information on the selected child's demographics and dietary intakes. The university's institutional review board approved our study.
Measures
Demographics
All adult participants answered investigator-developed demographics questions assessing the associated child's age; the adult participant's age, sex, ethnicity/race, marital status, employment status, education level, and relationship to the child (i.e., father, mother, sibling, grandparent, cousin, aunt/uncle, or other relative); and the family's annual income.
Dietary Intakes and Habits
We used one 5-point item from the 2013–2014 National Health and Nutrition Examination Survey's diet behavior and nutrition questionnaire to assess children's overall eating habits as ranging from poor to excellent (CDC, 2017a). Additionally, we adapted eight items from the Youth Risk Behavior Surveillance System (CDC, 2017c): two assessing adult participants' F/V intakes; five assessing children's F/V, sugar-sweetened beverage, fruit juice, and soda intakes; and one assessing children's frequency of eating with a television turned on during a typical week. Each of these survey items had a response set of never, 1–3 times per week, 4–6 times per week, and every day. The Cronbach's alpha assessing the internal consistency reliability was .63 for the four F/V items.
Data Analyses
We performed all data analyses using Stata/SE 14. We used descriptive statistics, including means, standard deviations, frequencies, and percentages with survey-weighted estimations, to describe study variables. We applied independent t-tests to examine the differences in dietary intakes between children and adult participants. We conducted one-way analyses of variance to examine the factors associated with dietary intakes. We used chi-square tests to examine the relationships between categorical variables and Pearson correlations to examine the relationships between child and adult dietary intakes.
Results
Participants
Although the SOSS included a random sample of 1,000 Michigan adults, only those who had a child aged 1–12 years old were eligible to participate in our study. Therefore, 392 Michigan households participated. Adults' mean age was 38.1 years (SE = 0.73, range = 18–92), and children's mean age was 6.2 years (SE = 0.20). As shown in Table 1, 56.9% of adult participants were female, 62.4% were married, 58.9% were employed full-time, 20.6% were Black, and 4.9% were Hispanic. About 19.7% had not received any college education, and 16.8% had an annual family income of less than $20,000. With regard to relationship to the participating child, nearly half of the adult participants (45.2%) were mothers, 36.8% were fathers, and the remaining were adult siblings, grandparents, aunts, or uncles.
| Variable | Sample frequency | Estimated population percentagea |
| Sex (female) | 206 | 56.9% |
| Ethnicity/race | ||
| Non-Hispanic White | 289 | 64.9% |
| Non-Hispanic Black | 57 | 20.6% |
| Non-Hispanic other race | 26 | 8.9% |
| Hispanic | 16 | 4.9% |
| No information/missing information | 4 | 0.7% |
| Marital status | ||
| Married/partnered | 261 | 62.4% |
| Divorced/separated/widowed | 47 | 11.9% |
| Single | 83 | 25.5% |
| No information/missing information | 1 | 0.2% |
| Employment | ||
| Full-time | 234 | 58.9% |
| Part-time | 58 | 15.7% |
| Not employed/retired | 87 | 22.1% |
| No information/missing information | 13 | 3.3% |
| Education | ||
| High school diploma or less | 82 | 19.7% |
| Some college | 136 | 37.1% |
| Bachelor's degree or higher | 173 | 43.0% |
| No information/missing information | 1 | 0.2% |
| Family annual income | ||
| ≤$19,999 | 60 | 16.8% |
| ≥$20,000 | 287 | 72.1% |
| No information/missing information | 45 | 11.1% |
| Relationship to child | ||
| Father | 155 | 36.8% |
| Mother | 162 | 45.2% |
| Other (sibling, grandparent, aunt/uncle) | 74 | 17.8% |
| No information/missing information | 1 | 0.2% |
| aAdjusting for weight on selection probabilities. | ||
Dietary Intakes and Habits
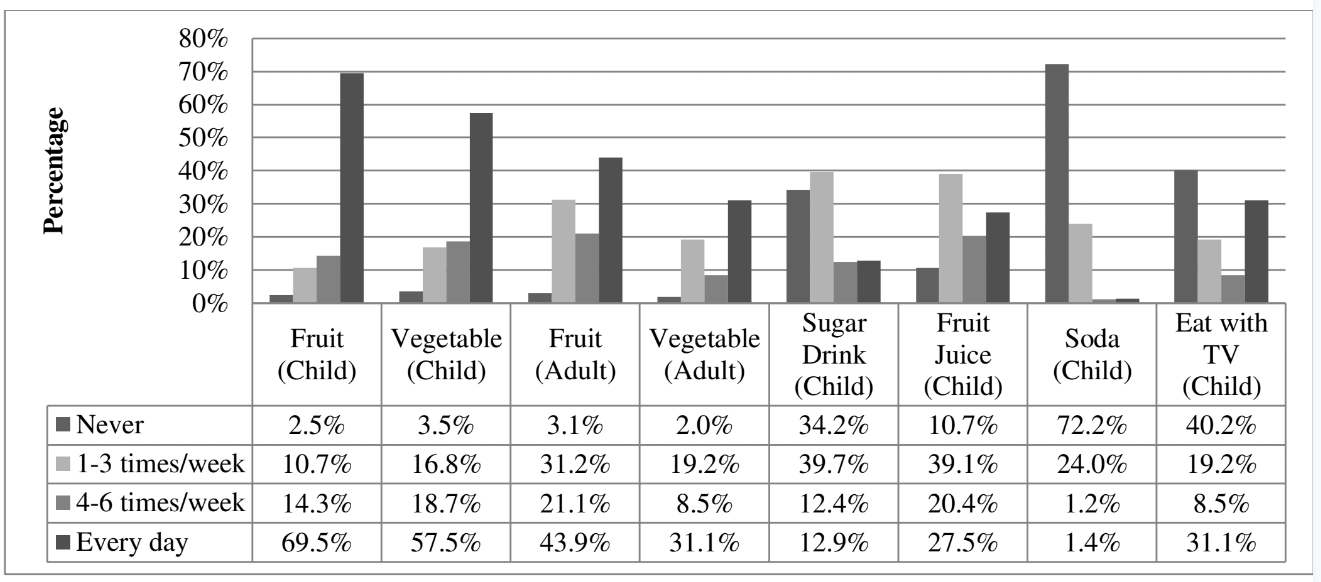
Our findings indicated that 69.5% and 57.5% of children ate F/V every day and that only 2.5% and 3.5% never had any. F/V intakes were significantly lower among adult participants (Ffruit = 28.92, p <. 001; Fvegetable = 3.20, p = .003). Additionally, 25.3% of the children drank sports drinks, punch, or other fruit-flavored sugared drinks more than three times per week, and 27.5% drank 100% pure fruit juice every day. Slightly more than a quarter (26.6%) drank nondiet soda at least once a week. With regard to our question about television, we found that 31.1% of children ate with a television on every day. Data related to dietary intake and television use are shown in Figure 1. We also found that 29.5%, 48.3%, 17.3%, 3.5%, and 1.4% of adult participants rated their child's overall eating habits as excellent, good, fair, not so good, or poor, respectively.
Figure 1.
Dietary Intakes and Television Use in a Typical Week (N = 392)
Factors Associated with Child Dietary Intakes
We found that White children as compared to Black children more frequently consumed fruits (M = 3.78 vs. 3.49, p = .043) and less frequently consumed sugar-sweetened beverages (M = 1.96 vs. 2.31, p = .043) and fruit juice (M = 2.55 vs. 3.07, p = .001). Additionally, children less frequently consumed sugar-sweetened beverages if their corresponding adult participant was married or partnered (M = 1.86) versus divorced/separated/widowed (M = 2.34, p = .005) or single (M = 2.42, p < .001). Also, children less frequently consumed sugar-sweetened beverages if their corresponding adult participant had at least a bachelor's degree (M = 1.79) versus only a high school diploma (M = 2.22, p = .003) or some college (M = 2.19, p = .001). Moreover, children from families with the lowest incomes (≤$19,999) as compared to those from higher-income families (≥$20,000) more frequently consumed sugar-sweetened beverages (M = 2.48 vs. 1.95, p < .001) and fruit juice (M = 2.92 vs. 2.57, p = .017). Children's dietary intakes did not vary according to corresponding adult participants' employment statuses.
Age was significantly and positively correlated with children's frequency of consumption of sugar-sweetened beverages (r = .16, p = .001) and nondiet soda (r = .27, p < .001) but was not significantly correlated with their F/V intakes. Additionally, there was a significantly positive relationship between adult participants' perceived quality of children's overall eating habits and children's age (r = .12, p = .022). Furthermore, older children tended to eat more often with a television on (r = .13, p = .008). Adult participants' race, marital status, employment status, education level, or family income did not significantly influence frequency of children's eating with a television on.
Relationships Between Adult and Child Dietary Intakes
Table 2 shows that adult participants' F/V intakes were positively correlated with children's intakes (rfruit = .16, p < .001; rvegetable = .38, p < .001). Only children's age significantly influenced the correlation between child and adult vegetable intakes, with a higher correlation for children aged 6–12 than those aged 1–5 (r = .51 vs. .27, z = 2.73, p = .006). Children's fruit intakes were weakly correlated with their fathers' fruit intakes (r = .12, p = .212) and mothers' fruit intakes (r = .05, p = .525) but moderately correlated with their grandparents' fruit intakes (r = .31, p = .113). Children's vegetable intakes were moderately and significantly correlated with their fathers' vegetable intakes (r = .38, p = .001) and mothers' vegetable intakes (r = .34, p = .001) but weakly correlated with their grandparents' vegetable intakes (r = .16, p = .454).
| Demographic | Fruits | Vegetables | ||||
| r | p-value | f | r | p-value | f | |
| Race | ||||||
| White | .15 | .057 | 280 | .42 | <.001 | 278 |
| Non-White | .20 | .009 | 94 | .25 | .025 | 93 |
| Marital status | ||||||
| Married | 08 | .262 | 251 | .35 | <.001 | 249 |
| Nonmarried | .26 | .003 | 123 | .43 | <.001 | 122 |
| Employment | ||||||
| Nonemployed | .32 | .002 | 92 | .49 | <.001 | 91 |
| Other | .12 | .065 | 280 | .36 | <.001 | 278 |
| Education | ||||||
| ≥Bachelor's degree | .12 | .173 | 168 | .36 | <.001 | 167 |
| Other | .16 | .032 | 207 | .38 | <.001 | 205 |
| Child age | ||||||
| Aged 6–12 years | .20 | .015 | 201 | .51 | <.001 | 199 |
| Aged 1–5 years | .11 | .151 | 174 | .27 | .001 | 173 |
| Annual income | ||||||
| ≤$19,999 | .26 | .08 | 57 | .23 | .064 | 56 |
| $20,000–$59,999 | .12 | .278 | 110 | .31 | .001 | 109 |
| ≥$60,000 | .15 | .041 | 188 | .44 | <.001 | 189 |
| Note. Bold type indicates statistical significance. r = Pearson correlation coefficient; f = frequency. | ||||||
Discussion and Conclusion
In 2016, the population in the Midwest region was about 51% female and about 76% White, 10% Black, and 8% Hispanic (U.S. Census Bureau, 2016); therefore, our study sample is relatively representative of the population in the midwestern United States. Given the similarity in residents' eating patterns across the Midwest (CDC, 2017b), the study results can be applied to help Extension professionals design education programs to promote healthful eating habits among midwestern children, especially older Black children who are from low-income families or are living with adults with low education levels. Programs are needed to help children increase F/V intakes and reduce sugar-sweetened beverage consumption. Additionally, attention should be paid to reducing children's time eating with a television on. Support for the need for such programs includes evidence showing that increasing F/V intakes, decreasing sugar-sweetened beverages, and eating without a television on can help reduce childhood obesity (de Ruyter, Olthof, Seidell, & Katan, 2012; Vik et al., 2013). One suggestion is to develop and implement targeted school- and community-based nutrition interventions focused on increasing children's F/V intakes (Alexander et al., 2016). Another suggestion is to provide nutrition education programs (Chipman & Litchfield, 2012) to parents and grandparents so that they will encourage their children to consume more F/V at family meals.
Parental role modeling has been reported to be associated with children's F/V intakes (Draxten, Fulkerson, Friend, Flattum, & Schow, 2014). However, our study found that children's parents more likely affected their vegetable intakes than their fruit intakes, and this correlation became stronger as children got older. Therefore, Extension professionals may consider focusing on educating both children and parents to increase children's vegetable intakes. In line with previous research (Ontai, Williams, Lamp, & Smith, 2007), our study results also suggest the need to provide tailored training programs to parents so that they are able to change feeding practices to overcome children's resistance to eating healthful foods. The moderate correlation between children's fruit intakes and grandparents' fruit intakes, although nonsignificant due to small sample size (32 grandparents), may indicate that grandparents are involved in purchasing fruits and serving fruits to their grandchildren. More research is needed to confirm this relationship.
Although our study provides Extension professionals with valuable information for designing future education programs, the use of adult-report measurements limits its extent. Reporting and recall biases may exist because adult participants may not have remembered what their children ate or known what their school-aged children ate at school. Moreover, literature shows that adult participants usually underestimate their own dietary intakes by about 20% (Freedman et al., 2014), and this percentage may increase when reporting children's dietary intakes. Despite these limitations, our findings can inform Extension professionals' efforts to promote healthful eating habits among children in the Midwest and thereby contribute to reducing the high childhood obesity rate.
Acknowledgment
The College of Nursing Research Center at Michigan State University in East Lansing, Michigan, funded the study described here.
References
Alexander, R., Hill, J., Grier, K., MacAuley, L., McKenzie, A., Totten, T., . . . Zoellner, J. (2016). Evaluating the feasibility of a gardening and nutrition intervention with a matched contact-control physical activity intervention targeting youth. Journal of Extension, 54(5), Article 5FEA7. Available at: https://joe.org/joe/2016october/a7.php
Avery, A., Anderson, C., & McCullough, F. (2017). Associations between children's diet quality and watching television during meal or snack consumption: A systematic review. Maternal and Child Nutrition, 13(4). doi:10.1111/mcn.12428
Birch, L. L., Savage, J. S., & Fisher, J. O. (2015). Right sizing prevention. Food portion size effects on children's eating and weight. Appetite, 88, 11–16. doi:10.1016/j.appet.2014.11.021
Centers for Disease Control and Prevention. (2017a). National Health and Nutrition Examination Survey. Retrieved from https://www.cdc.gov/nchs/nhanes/index.htm
Centers for Disease Control and Prevention. (2017b). State indicator report on fruits and vegetables 2013. Retrieved from https://www.cdc.gov/nutrition/downloads/State-Indicator-Report-Fruits-Vegetables-2013.pdf
Centers for Disease Control and Prevention. (2017c). Youth Risk Behavior Surveillance System (YRBSS) overview. Retrieved from https://www.cdc.gov/healthyyouth/data/yrbs/overview.htm
Chipman, K., & Litchfield, R. (2012). Extension newsletters and individual counseling: Equally effective in changing worksite wellness participants dietary intakes. Journal of Extension, 50(3), Article 3FEA5. Available at: https://joe.org/joe/2012june/a5.php
de Ruyter, J. C., Olthof, M. R., Seidell, J. C., & Katan, M. B. (2012). A trial of sugar-free or sugar-sweetened beverages and body weight in children. The New England Journal of Medicine, 367(15), 1397–1406. doi:10.1056/NEJMoa1203034
Draxten, M., Fulkerson, J. A., Friend, S., Flattum, C. F., & Schow, R. (2014). Parental role modeling of fruits and vegetables at meals and snacks is associated with children's adequate consumption. Appetite, 78, 1–7. doi:10.1016/j.appet.2014.02.017
Fisk, C. M., Crozier, S. R., Inskip, H. M., Godfrey, K. M., Cooper, C., Robinson, S. M., & Southampton Women's Survey Study Group. (2011). Influences on the quality of young children's diets: The importance of maternal food choices. British Journal of Nutrition, 105(2), 287–296. doi:10.1017/S0007114510003302
Fitzgerald, N., & Spaccarotella, K. (2009). Barriers to a healthy lifestyle: From individuals to public policy—An ecological perspective. Journal of Extension, 47(1), Article 1FEA3. Available at: https://www.joe.org/joe/2009february/a3.php
Ford, C. N., Slining, M. M., & Popkin, B. M. (2013). Trends in dietary intake among US 2- to 6-year-old children, 1989–2008. Journal of the Academy of Nutrition and Dietetics, 113(1), 35–42. doi:10.1016/j.jand.2012.08.022
Freedman, L. S., Commins, J. M., Moler, J. E., Arab, L., Baer, D. J., Kipnis, V., . . . Willett, W. (2014). Pooled results from 5 validation studies of dietary self-report instruments using recovery biomarkers for energy and protein intake. American Journal of Epidemiology, 180(2), 172–188. doi:10.1093/aje/kwu116
Han, J. C., Lawlor, D. A., & Kimm, S. Y. (2010). Childhood obesity. The Lancet, 375(9727), 1737–1748.
Harrison, K., Liechty, J. M., & The Strong Kids Program. (2012). US preschoolers' media exposure and dietary habits: The primacy of television and the limits of parental mediation. Journal of Children and Media, 6(1), 18–36. doi:10.1080/17482798.2011.633402
Hebestreit, A., Intemann, T., Siani, A., De Henauw, S., Eiben, G., Kourides, Y. A., . . . Pigeot, I. (2017). Dietary patterns of European children and their parents in association with family food environment: Results from the I.Family study. Nutrients, 9(2). doi:10.3390/nu9020126
Kim, Y. (2016). Evaluating an integrated nutrition and parenting education program for preschoolers and their parents. Journal of Extension, 54(5), Article 5RIB5. Available at: https://www.joe.org/joe/2016october/rb5.php
Mathias, K. C., Rolls, B. J., Birch, L. L., Kral, T. V. E., Hanna, E. L., Davey, A., & Fisher, J. O. (2012). Serving larger portions of fruits and vegetables together at dinner promotes intake of both foods among young children. Journal of the Academy of Nutrition and Dietetics, 112(2), 266–270. doi:10.1016/j.jada.2011.08.040
National Conference of State Legislatures. (2016). Childhood overweight and obesity trends. Retrieved from http://www.ncsl.org/research/health/childhood-obesity-trends-state-rates.aspx
Ontai, L. L., Williams, S. T., Lamp, C., & Smith, D. (2007). An integrative approach to addressing childhood overweight: Inclusion of parenting information in nutrition education programs. Journal of Extension, 45(3), Article 3FEA2. Available at: https://joe.org/joe/2007june/a2.php
Palfreyman, Z., Haycraft, E., & Meyer, C. (2015). Parental modelling of eating behaviours: Observational validation of the parental modelling of eating behaviours scale (PARM). Appetite, 86, 31–37. doi:10.1016/j.appet.2014.08.008
Pierce, G. L. (2015). Methodological report: Michigan State University State of the State Survey. East Lansing, MI: Michigan State University, Institute for Public Policy and Social Research.
Skinner, A. C., Ravanbakht, S. N., Skelton, J. A., Perrin, E. M., & Armstrong, S. C. (2018). Prevalence of obesity and severe obesity in US children, 1999–2016. Pediatrics, 141(3). doi:10.1542/peds.2017-3459
Stata/SE 14 [Computer software]. College Station, TX: StataCorp.
U.S. Census Bureau. (2016). American Community Survey 1-year estimates. Retrieved from https://censusreporter.org/profiles/02000US2-midwest-region/
Vik, F. N., Bjornara, H. B., Overby, N. C., Lien, N., Androutsos, O., Maes, L., . . . Bere, E. (2013). Associations between eating meals, watching TV while eating meals and weight status among children, ages 10–12 years in eight European countries: The ENERGY cross-sectional study. International Journal of Behavioral Nutrition and Physical Activity, 10. doi:10.1186/1479-5868-10-58
Wang, Y., Beydoun, M. A., Li, J., Liu, Y., & Moreno, L. A. (2011). Do children and their parents eat a similar diet? Resemblance in child and parental dietary intake: Systematic review and meta-analysis. Journal of Epidemiology & Community Health, 65(2), 177–189.