October 2017
|
October 2017 // Volume 55 // Number 5 // Feature // v55-5a5


Using Standardized Evaluation Metrics to Demonstrate Collective Statewide Impacts of Diverse Water Conservation Programming
Abstract
Although the diversity of Florida Cooperative Extension landscape water conservation programs creates evaluation challenges, it is possible to measure their impacts as a whole. We conducted pilot testing of a statewide evaluation strategy and identified behavior changes resulting in an average monthly water savings of 3,257 gal and utility bill savings of $10.78 per participant. Here we explain the approach we used, providing details about underlying research on water conservation practices and technologies, standardized metrics for demonstrating environmental and economic impacts of behavior/technology adoption, and reporting tools. A focus on statewide impacts based on standardized metrics can be extremely valuable to U.S. Extension professionals.
Introduction
Water is one of the most valuable and limited resources in the United States, and population growth and climate change have intensified the pressure on water resources (Adams et al., 2013; U.S. Environmental Protection Agency, n.d.; Wolters, 2014). In Florida, a state well known for its pleasing landscapes, residents pump thousands of gallons of water into their landscapes daily in amounts that exceed what is required by turfgrass and other landscape plants, sometimes applying more than two thirds of their total household water use toward irrigation (Baum, Dukes, & Miller, 2005; Haley, Dukes, & Miller, 2007; Monaghan, Ott, Wilber, Gouldthorpe, & Racevskis, 2013). More efficient residential irrigation is considered a key to saving water, and the University of Florida Institute of Food and Agricultural Sciences (UF/IFAS) offers statewide Cooperative Extension programs (such as Florida Friendly Landscaping) to encourage water conservation practices among residents (University of Florida Institute of Food and Agricultural Sciences [UF/IFAS], 2015). One of the highest priorities is the reduction of landscape water use (UF/IFAS, 2015).
Cooperative Extension is known for delivering educational programs based on local needs. However, evaluating statewide impacts can be difficult. In Florida, evaluating the statewide impacts of water conservation programs is a major challenge, due to the variability of programs around the state. To address this challenge, we assembled a team of researchers and Extension professionals with expertise in water issues, agricultural engineering, natural resources economics, survey methodology, and program evaluation. We collaborated to develop an evaluation approach that would allow us to use standardized metrics to demonstrate the statewide impacts of Florida's diverse water conservation programming efforts. Minimal information is available in existing literature on evaluating similar outcomes across diverse programs (Adler-Baeder, Kerpelman, Griffin, & Schramm, 2010; Payne & McDonald, 2015), and this initiative addressed that gap.
Overview of the Evaluation Approach
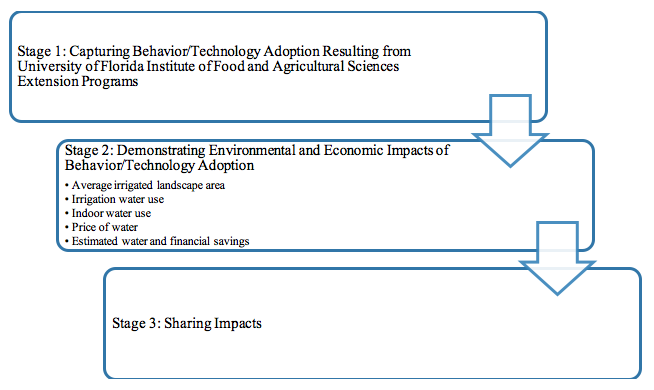
To achieve our goal, we developed an evaluation "package" comprised of three stages (see Figure 1):
- Stage 1—capturing behavior/technology adoption resulting from UF/IFAS Extension programs;
- Stage 2—demonstrating environmental and economic impacts of behavior/technology adoption; and
- Stage 3—sharing impacts.
This evaluation package is innovative because it allows for demonstration of unified statewide impacts of diverse water conservation programming efforts in Florida. The package includes survey tools for measuring behavior change (Stage 1), resources for converting behavior changes to gallons of water saved (Boyer & Dukes, 2015) and gallons of water saved to financial and other impacts (Borisova, Warner, Searcy, Kumar Chaudhary, & Dukes, 2017) (Stage 2), and a data presentation tool (Stage 3).
Figure 1.
Stages of Evaluation Package for Demonstrating Unified Statewide Impacts of Water Conservation Programming Efforts in Florida
Pilot Test
To test the new evaluation approach, we collected postprogram data via paper survey from 75 individuals who attended one of three Florida Cooperative Extension water conservation programs selected for the pilot test. The pilot test instruments were designed to examine standard water conservation practices promoted by UF/IFAS Extension. The instruments were validated by a panel of experts with expertise in agricultural and biological engineering, landscape water conservation practices, survey methodology, and Extension program development. Out of 75 participants who completed the study's retrospective pre-/posttest survey, 49 provided their email addresses for follow-up. Six months later, we sent the electronic follow-up survey to those 49 participants. Out of 49 emails sent, 44 were deliverable to Extension program participants, and we received a total of 23 completed surveys, for a completion rate of 52.2%.
Stage 1: Capturing Behavior/Technology Adoption Resulting from UF/IFAS Extension Programs
We first used a retrospective pre-/posttest survey to measure Extension program participants' water conservation behavioral intentions attributable to participation in the programs. The retrospective pre-/posttest survey was administered by Extension agents in electronic or paper format. We then used a companion follow-up survey to measure participants' water conservation behavior changes resulting from participation in the programs. The follow-up survey was designed to be administered electronically by Extension specialists 6 months after program participation. The survey tools were accessed by members who had been added to a water conservation evaluation group, and we designed the tools so that data could be accessed in real time and filtered by agent, county, or district. In addition to capturing behavior change, the surveys (both retrospective pre-/posttest and follow-up) addressed square footage of irrigated landscape and frequency of irrigation (DeMouche, Bathke, & Doesken, 2007).
The survey design was informed by the water conservation potential of various behaviors identified through Florida-based research on irrigation practices and technologies (Kopp, Cerny-Koenig, & Lopez, 2007) conducted by Boyer and Dukes (2015). Table 1 presents the estimated quantity of water saved as a result of 11 landscape irrigation behavior changes.
| Water Conservation Activity | Water Savings (gal/1,000 sq ft/yr) | Approximate cost ($) | Documentation |
| Install expanding disk interrupt rain sensor | 2,541 | 200 | Rationale: Meeks et al. (2012) found that using rain sensors resulted in an 8% irrigation savings for a two days/week irrigation schedule. Cárdenas-Lailhacar et al. (2010) observed a 13%–24% irrigation savings using a rain sensor during dry conditions. In an earlier study, Cárdenas-Lailhacar et al. (2008b) observed irrigation savings of 3%–44% depending on the rain sensor type and setpoint. Calculation: A conservative estimate of irrigation savings is 8%: (0.08) (31,767) = 2,541 |
| Calibrate sprinkler system to deliver ½″ or ¾″ water instead of 1″ | 7,942–15,884 | 2401 | Rationale: Trenholm and Unruh (2002) recommend 0.5–0.75 in/irrigation event. Calculation: By using 0.75 in/event, there is a 25% savings as compared to the baseline; and by using 0.5 in/event, there is a 50% savings: (0.25) (31,767) = 7,942; (0.50) (31,767) = 15,884 |
| Use UF/IFAS recommendations and calibrate sprinkler system to replace 60% ET instead of 100% | 12,707 | 2402 | Rationale: Dukes (2014) notes that a 60% ET replacement schedule is generally adequate to maintain turf, although some supplemental hand watering may be necessary during warm months. Calculation: By replacing only 60% of water, 40% will be saved: (0.40) (31,767) = 12,707 |
| Install soil moisture sensor or evapotranspiration controller | 11,118–22,872 | 500 | Rationale: Several studies have demonstrated the water savings potential of soil moisture sensor (SMS) or evapotranspiration (ET) controller. When using an ET controller and rain sensor, Rutland and Dukes (2012) observed a 41% irrigation reduction under wet conditions, and Davis et al. (2009) found a 43% reduction under dry conditions. In an SMS study in Gainesville, Florida, Cárdenas-Lailhacar et al. (2010) observed irrigation savings of 72% during wet conditions and of 35% (first half of 2006) to 54% (second half of 2006) during dry conditions. SMSs and ET controllers tend to reduce irrigation by 35%–72%. Calculation: (0.35) (31,767) = 11,118; (0.72) (31,767) = 22,872 |
| Convert turfgrass area to landscaped bed with micro irrigation | 15,569–31,767 | 750 | Rationale: Trenholm et al. (2002) recommends that ornamental plants be irrigated only as needed once established. This recommendation is based on studies of ornamentals grown in Florida (Scheiber et al. 2008; Wiese et al. 2009). Alternatively, Haley and Dukes (2007) reported that mixed turf and ornamental landscapes that used microirrigation in landscaped beds irrigated 74 mm/month over the entire landscape, which is equal to 55 mm/month (16,198 gal/1,000 sq ft/yr) for the ornamentals, as compared to 105 mm/month for irrigation with sprinklers only. Calculation: (31,767−16,198) = 15,569 |
| Convert spray head nozzles to multi-stream, multi-trajectory (MSMT) nozzles | 2,859 | 2963 | Rationale: MSMT nozzles apply water more evenly and have lower application rates (≈0.5 inches/hr). Southern Nevada Water Authority and Eugene Water and Electricity Board (Sovocool et al. 2013; Petersen 2012) have both observed an improvement in distribution uniformity that could translate to a 9% savings based on the Irrigation Association's scheduling multiplier. Calculation: (31,767) (9%) = 2,859 |
| Install pressure compensating heads | 2,224 | 2724 | Rationale: At a higher pressure, a spray head will apply a greater rate. By reducing pressure from 50 to 30 psi, the flowrate could be decreased by approximately 7%.5Calculation assumes that 60 psi is the minimum municipal pressure maintained for fire protection, 50 psi is a reasonable on-site pressure, and 30 psi is the sprinkler manufacturer's recommended operating pressure. Calculation: (31,767) (7%) = 2,224 |
| Reduce irrigation from 3 days/week to 2 days/week | 10,483 | 0 | Rationale: Reduction from 3 days/week to 2 days/week yields an annual 33% savings. Calculation: (31,767) (33%) = 10,483 |
| Reduce irrigation from 7 days/week to 2 days/week | 22,555 | 0 | Rationale: Reduction from 7 days/week to 2 days/week yields an annual 71% savings. Calculation: (31,767) (71%) = 22,555 |
| Reduce irrigation frequency during the winter (Skip a Week) | 8,259 | 0 | Rationale: During the period between daylight savings (approximately November–March), irrigation would be skipped every other week. During the weeks the irrigation system would run, irrigation would be reduced from two times per week to one time per week. Irrigation savings would be achieved through 9 weeks of no irrigation and 9 weeks of 50% reduction in irrigation. Total annual irrigation reduction would be 26%. Calculation: (31,767) (26%) = 8,259 |
| Reduce irrigation frequency during the summer | 5,718 | 0 | Rationale: The summer months typically have sufficient rainfall to provide the majority of the turfgrass's water requirements. Summer (June, July, and August) savings could be approximated by the savings obtained using a soil moisture sensor. In a SMS study in Gainesville, Florida, Cárdenas-Lailhacar et al. (2010) observed irrigation savings of 72% during wet conditions. Calculation: (31,767 gal/year) (3 summer months/12 per year) (72%) = 5,718 |
| 1,2Based on a four-hour irrigation contractor service call at $60/hr 3Based on 8 nozzles per 1,000 sq ft area at $7/nozzle and a four-hour irrigation contractor service call at $60/hr 4Based on eight pressure regulating spray heads per 1,000 sq ft area at $4/spray head and a four-hour irrigation contractor service call at $60/hr 5Reduction based on Toro Precision Series with arcs Q, H, and F and with radii of 5, 8, 10, 12, and 15 ft. | |||
| Note. The baseline annual water use (i.e., 31,767 gal/1,000 ft2 of turfgrass) is estimated for Central Florida and based on University of Florida Institute of Food and Agricultural Sciences recommendations, with irrigation twice per week with 100% evapotranspiration replacement and an irrigation rate of 1.0 in./hr. Table is reprinted with permission from "Estimated Water Savings Potential of Florida-Friendly Landscaping Activities" (Publication AE515), by M. J. Boyer and M. D. Dukes, 2015, University of Florida Institute of Food and Agricultural Sciences, Gainesville, FL, pp. 5–6. | |||
To ensure a useful end product, we used an ad hoc feedback process with Extension professionals that guided multiple rounds of revision during development of the survey tools. For example, although rain barrel installation is not a target behavior from a water savings standpoint, it is an important part of many programs, and participating agents requested associated data.
Stage 2: Demonstrating Environmental and Economic Impacts Based on Pilot Test Data
Using the results from the pilot test follow-up survey, we calculated gallons of water saved by participants using the known savings associated with each behavior change along with the average area of irrigated landscape in square feet (Table 2). We then identified the statewide average utility bill cost per thousand gallons of water to estimate the savings for program participants (Table 2).
| Behavior | Number of responses | Associated water savings (gallons) per 1,000 ft2/month | Average monthly water savings (gallons) by follow-up residents/month | Average monthly water bill savings ($) |
| Used different irrigation zones/zone run times based on plants' irrigation needs | 1 | 1,059 | 1,839 | 6.09 |
| Adjusted irrigation times seasonally | 1 | 582 | 1,011 | 3.35 |
| Followed watering restrictions | 4 | 1,147 | 7,968 | 26.37 |
| Eliminated irrigated areas/Turned off zone(s) or cap irrigation heads for established woody plants | 6 | 2,647 | 27,588 | 91.32 |
| Converted turfgrass areas to landscaped bed/Replaced high-water plants with drought-tolerant plants/Replaced high-volume irrigated areas with low-volume irrigated areas | 4 | 1,972 | 13,700 | 45.35 |
| Total | 16 | 52,106 | 172.48 | |
| Average for 16 respondents | 3,257 | 10.78 | ||
| Note. Out of 23 follow-up responses, only 16 responses were included in further analysis. | ||||
Average Irrigated Landscape Area
We calculated the average irrigated landscape area (1,737 ft2) by identifying the mean of respondents' reported irrigated landscape square footages. Respondents' average irrigated landscape area was much lower than the average size for residential irrigated landscapes (4,400 ft2); this may be because these respondents had already adopted relevant water conservation practices, such as replacing irrigated landscape with nonirrigated landscape.
Irrigation Water Use
The annual baseline irrigation for turfgrass by Central Florida homeowners is 31,767 gal per 1,000 ft2 (Boyer & Dukes, 2015). We multiplied this number by the average size of the irrigated landscape to calculate the baseline annual irrigation water use among the 23 Extension participants, resulting in an average 55,179 gal of water used by each participant annually [31,767 (gal/1,000 ft2) * 1.737 (ft2) = 55,179 gal]. To estimate the average monthly irrigation water use, we divided 55,179 gal per year by 12, for a result of 4,598 gal per month.
Total Water Use
The estimated indoor water use in a 2.2-person household is 67.6 gal per day, or 4,521 gal per household per month (Davis & Dukes, 2014). We added this number to the average monthly irrigation water use (4,598 gal/month), for a result of 9,119 gal of total water used per household per month.
Calculation of Estimated Water Savings Resulting from Adopting Landscape Water Conservation Behaviors
Research has not yet explored the cumulative effects of adopting multiple landscape water conservation behaviors. Therefore, when participants indicated that they had made multiple changes to their irrigation, we opted to calculate water saved conservatively by using only the single behavior that corresponded to the highest water savings. To simplify calculations, we grouped behaviors that resulted in same amounts of water savings and had five different groups based on similar water savings.
For example, water savings when a participant had seasonally adjusted irrigation times was 6,988 gal per 1,000 ft2 per year (Boyer & Dukes, 2015), which corresponds to a monthly water savings of 582 gal per 1,000 ft2. We multiplied this value by the average irrigated landscape area (1,737 ft2) to determine that the average water savings for a participant who adopted this practice was 1,011 gal per month (582 * 1.737 = 1,011 gal/month). We calculated water savings for the other four landscape water conservation behavioral groups in this manner as well.
Calculation of Estimated Financial Savings Resulting from Adopting Landscape Water Conservation Behaviors
We calculated water rates using reported water rates based on an average consumption of 4,000 and 8,000 gal per month from 187 water and wastewater service providers in Florida (Raftelis Financial Consulting, 2016). We excluded wastewater charges and possible taxes or fees collected by water utility providers. The average statewide bill for 4,000 gal per month water consumption was $21.56, and the average statewide bill for 8,000 gal per month water consumption was $34.15. Most of the utilities use minimum water charges and apply inclining water rates, with water price per thousand gallons increasing with water use. To identify the average reduction in water bill per thousand gallons of water saved, we estimated the difference between the bills for 8,000 gal and 4,000 gal ($13.24 per 4,000 gal of water saved) and divided the difference by 4. The average savings due to reductions in water use was $3.31 per thousand gallons of water saved.
For example, we calculated water bill savings relative to the practice of seasonally adjusting irrigation times by multiplying the monthly water savings (i.e., 1,011 gal) by the statewide average cost per thousand gallons of water ($3.31/1,000 gal). The resulting water bill savings averaged $3.35 per person per month.
Results: Estimated Water and Financial Savings Resulting from Adopting Landscape Water Conservation Behaviors
The total savings that corresponded to the reported behavior changes in the group of respondents was 52,106 gal of water per month, or 625,272 gal per year, which is valued at a monthly overall total of $172.48, or $2,069.76 per year, a savings of about $10.78 per participant per month. Additionally, we calculated water delivery cost reductions (data not presented), which corresponded to a savings of $135.48 per month for Florida water utilities, or approximately $1,625.76 per year.
Stage 3: Sharing Impacts
To highlight the statewide impacts we identified using our innovative evaluation approach, we used the pilot test data to create an infographic showcasing the most common behavior changes, the corresponding quantities of water saved, and the resulting financial benefits to both residents and water utilities (Figure 2). We then distributed the infographic to Extension professionals through various sources, such as social media platforms and personalized emails. The informal feedback we received was positive, and we plan to modify the image annually. Our strategy for sharing impacts was not limited to the infographic; we also generated news releases and provided a template for agents' annual report of accomplishments. Because impact measurement is important for empowering communities, demonstrating the value of UF/IFAS Extension, and guiding Extension program planning, we presented the impacts of water savings as metrics that relate to communities (e.g., number of houses that can be supplied with saved water). Also, along with using various formats to present information (e.g., infographic), we used various options for information dissemination, such as social media posts, presentations, and webinars.
Figure 2.
Infographic Presenting Pilot Test Water Conservation Outcomes and Impacts
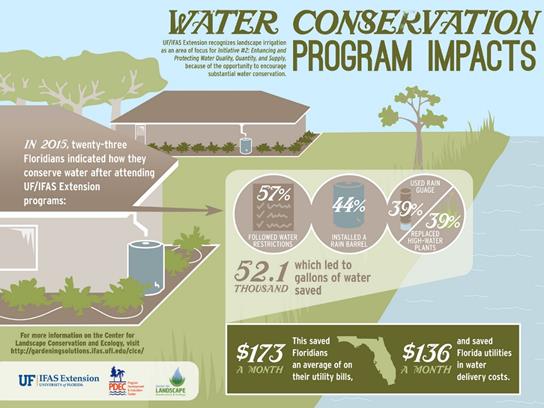
Considering that the pilot test data were collected from a very small sample and that over 80,000 people participate in UF/IFAS water conservation programming in Florida each year (D. Craig, personal communication, December 7, 2015), our pilot test demonstrated the substantial impacts Extension programs can have on water resources. Further, it points to the great need to measure and document these otherwise unreported impacts.
Encouraging Participation by Extension Professionals
Efforts are under way to standardize water conservation impact reporting throughout the state. We have conducted several in-service trainings to raise awareness of the tools, explain the process, and encourage Extension professionals to use the available resources in their program evaluation efforts. Additional support was provided through an informal monthly webinar open to all interested Extension professionals, through which they could learn and ask questions about the project. In 2016, 9 months after the full version of the evaluation packet was launched, 34 Extension agents had accessed the tools for their use. Florida Extension administration is encouraging Extension professionals to engage in standardized water conservation impact reporting. District Extension directors have been helpful in disseminating information and have encouraged Extension professionals to participate.
Discussion
The approach we used for standardized water conservation impact reporting has multiple advantages. The estimated water savings can be supported by the available literature. Additionally, the format allows for flexible reporting at the individual, local, and state level and provides a mechanism for examining the impacts of alternative delivery methods or program designs.
The endeavor of developing a standardized evaluation process has some limitations and challenges (Adler-Baeder et al., 2010; Payne & McDonald, 2015). Although the tools for standardization have been requested by Extension professionals (Warner, 2014) and feedback has been very positive, the tools have not been used in the manner we anticipated. We have found that many agents have adopted and adapted the tools for use in their individual programs and reported at the local level, but not at the state level. We have overcome this challenge by modifying our approach and focusing on helping agents report on standard indicators in their annual reports of accomplishment. We now focus on providing support to agents as they modify the approach for use with their local programs and then collating the data from their reports. Overall, we have seen increased accountability in water conservation programs.
Furthermore, it is very difficult for Extension program participants to estimate the square footages of their irrigated landscape areas. We tried different ways of helping participants provide accurate responses, and our solution was to provide a reference statement that helps the participant visualize the size of the irrigated landscape. In moving forward, we have used an average residential irrigated area, a value that is available from University of Florida research.
Although self-reported data is considered a standard for Extension evaluation, responses may be affected by factors such as social desirability bias (Grimm, 2010). Even though resources limit the extent of data that can be collected (Garst & Bruce, 2003), we hope to incorporate water supply utility company data to verify self-reported and estimated water savings in future evaluations. Although the standardized evaluation approach simplifies the evaluation process, it does not account for the potential variability in water conservation results among households or different weather conditions, and this drawback can be addressed by the analysis of data from water supply utility companies.
Finally, whereas water conservation reduces customers' water bills and utility companies' treatment and delivery costs (U.S. Environmental Protection Agency, 2004), it also affects the companies' revenues. We did not address the relationship between customers' water use, utility companies' revenues, and water prices in this evaluation framework. It is important to recognize, though, that given the population growth rate in the state, water conservation allows utility companies to delay costly investments in expanding capacity and acquiring additional water sources that also can be associated with increases in water prices.
As others have found, developing tools for standardization that reflect group consensus can be highly time consuming (Garst & Bruce, 2003) and resources need to be invested into training the intended users of the tools (Adler-Baeder et al., 2010). Additional potential challenges include establishing a mechanism to measure statewide water savings impacts while enabling Extension professionals to personalize and access their own data. Finally, this approach focuses on water conservation only and does not capture other impacts, such as increases in social capital, water quality improvements, protection of aquatic ecosystems, and improved plant health.
Recommendations
Extension services across the United States face the challenge of standardizing data collection and reporting systems to demonstrate real impacts (Adler-Baeder et al., 2010; Payne & McDonald, 2015). We recommend that program evaluators and Extension professionals collectively develop standardized evaluation tools that can centralize data collection and improve the quality of reporting. We detailed the process we used to convert postprogram water conservation evaluation results into statewide impacts metrics so that this process can be replicated or modified by others.
We emphasize that it is possible to measure impacts across diverse programs, and we encourage Extension professionals to conduct economic evaluations of their programs in order to demonstrate impacts to funding agencies and legislators. Although we consider the development of an approach based on standardized evaluation metrics a promising accomplishment, we have found that changing the process of statewide evaluation is time and resource intensive. A remaining challenge is to incorporate reported impacts that are obtained through other methods, such as collection of actual water use data. We are engaging a network of Extension professionals to encourage reporting on the statewide impacts. On the basis of our experiences thus far, we recommend that Extension professionals establish a communication plan when they begin developing instruments for standardizing evaluations. Extension professionals also should communicate regularly with administrators to ensure that centralized data collection and reporting will meet the needs and vision of the organization's leadership. Future collaboration with water utility companies will facilitate the incorporation of quantitative water use data before and after Extension program attendance to measure the impact of a program (Borisova & Useche, 2013).
Conclusions
Our intention was not to report statistical results, given the small sample size; instead our purposes were to discuss our experiences and to demonstrate that diverse programs within a state can, and should, be collectively evaluated to demonstrate impacts. We hope to further discuss and share the approach and tools presented in this article as we work to improve our process. It is our hope that our experiences will be helpful to Extension professionals across the United States and will support others' reporting of environmental and economic program impacts to stakeholders, funding agencies, and legislators.
Overall, we learned several lessons and experienced several challenges, which have led us to improve our evaluation approach by focusing our efforts on standardizing agent-level reporting. Strengths of the project include the availability of experts who brought research findings to instrument development–focused evaluation and acceptance of the standardized evaluation concept by Extension professionals. The cooperation of Extension professionals who were enthusiastic about the process and willing to secure participants for the pilot test was critical to our success, and the pilot test helped establish the instrument's validity and reliability. The availability of research on water savings (Boyer & Dukes, 2015) and utility rates (Raftelis Financial Consulting, 2016) was essential in calculating the impact of specific landscape water conservation behaviors.
In the era of complex funding and strict accountability requirements, Extension professionals are challenged to report the economic impacts of their programs (Franz & Townson, 2008; Frisk & Larson, 2011; Pratt & Bowman, 2008). Sharing cost-based information with stakeholders, funding agencies, and legislators will enable Extension administrators to justify investments in their programs. Presenting unified statewide environmental and economic impacts of diverse water conservation programming is a good way to meet this requirement.
Author Note
Author change in affiliation: Anil Kumar Chaudhary is an assistant professor in the Department of Agricultural Economics, Sociology, and Education at The Pennsylvania State University, University Park, Pennsylvania, and may be reached at auk259@psu.edu.
References
Adams, D. C., Allen, D., Borisova, T., Boellstorff, D. E., Smolen, M. D., & Mahler, R. L. (2013). The influence of water attitudes, perceptions, and learning preferences on water-conserving actions. Natural Sciences Education, 42(1), 114–122.
Adler-Baeder, F., Kerpelman, J., Griffin, M. M, & Schramm, D. G. (2010). Evaluating multiple prevention programs: Methods, results, and lessons learned. Journal of Extension, 48(6), Article 6FEA1. Available at: https://www.joe.org/joe/2010december/a1.php
Baum, M., Dukes, M., & Miller, G. (2005). Analysis of residential irrigation distribution uniformity. Journal of Irrigation and Drainage Engineering, 131(4), 336–341. doi:10.1061/(ASCE)0733-9437(2005)131:4(336)
Borisova, T., & Useche, P. (2013). Exploring the effects of Extension workshops on household water-use behavior. HortTechnology, 23, 668–676. Retrieved from http://horttech.ashspublications.org/content/23/5/668.full
Borisova, T., Warner, L. A., Searcy, J., Kumar Chaudhary, A., & Dukes, M. (2017). Estimating benefits of residential outdoor water conservation: A step-by-step guide (Publication FE1009). Retrieved from http://edis.ifas.ufl.edu/pdffiles/FE/FE100900.pdf
Boyer, M. J., & Dukes, M. D. (2015). Estimated water savings potential of Florida-Friendly Landscaping activities (Publication AE515). Retrieved from http://edis.ifas.ufl.edu/ae515
Davis, S., & Dukes, M. D. (2014) Methodologies for successful implementation of smart irrigation controllers. Journal of Irrigation and Drainage Engineering, 141(3), 1–9. doi:10.1061/(ASCE)IR.1943-4774.0000804
DeMouche, L., Bathke, D., & Doesken, N. (2007). Master gardeners' role in encouraging water conservation using a rain gauge network. Journal of Extension, 45(4), Article 4IAW5. Available at: https://www.joe.org/joe/2007august/iw5.php
Franz, N. K., & Townson, L. (2008). The nature of complex organizations: The case of Cooperative Extension. New Directions for Evaluation, 2008(120), 5–14.
Frisk, E., & Larson, K. L. (2011). Educating for sustainability: Competencies & practices for transformative action. Journal of Sustainability Education, 2, 1–20.
Garst, B. A., & Bruce, F. A. (2003). Identifying 4-H camping outcomes using a standardized evaluation process across multiple 4-H educational centers. Journal of Extension, 41(3), Article 3RIB2. Available at: https://www.joe.org/joe/2003june/rb2.php
Grimm, P. (2010). Social desirability bias. In J. Sheth & N. K. Malhotra (Eds.), Wiley International Encyclopedia of Marketing. London, UK: John Wiley & Sons.
Haley, M., Dukes, M., & Miller, G. (2007). Residential irrigation water use in Central Florida. Journal of Irrigation and Drainage Engineering, 133, 427–434. doi:10.1061/(ASCE)0733-9437(2007)133:5(427)
Kopp, K. L., Cerny-Koenig, T., & Lopez, R. (2007). Educating large landscape water users. Journal of Extension, 45(1), Article 1IAW6. Available at: https://www.joe.org/joe/2007february/iw6.php
Monaghan, P., Ott, E., Wilber, W., Gouldthorpe, J., & Racevskis, L. (2013). Defining audience segments for Extension programming using reported water conservation practices. Journal of Extension, 51(6), Article 6FEA8. Available at: https://www.joe.org/joe/2013december/a8.php
Payne, P. B., & McDonald, D. A. (2015). Common evaluation tools across multi-state programs: A study of parenting education and youth engagement programs in children, youth, and families at-risk. Journal of Extension, 53(3), Article 3FEA5. Available at: https://www.joe.org/joe/2015june/a5.php
Pratt, C., & Bowman, S. (2008). Principles of effective behavior change: Application to Extension family educational programming. Journal of Extension, 46(5), Article 5FEA2. Available at: https://www.joe.org/joe/2008october/a2.php
Raftelis Financial Consulting (2016). 2016 Florida water and wastewater rate survey. Retrieved from http://www.raftelis.com/news/2016-florida-survey-now-available/
University of Florida Institute of Food and Agricultural Sciences. (2015). Enhancing and protecting water quality, quantity, and supply. Retrieved from extadmin.ifas.ufl.edu/roadmap
U.S. Environmental Protection Agency. (2004). Drinking water costs & federal funding (EPA 816-F-04-038). Retrieved from http://yosemite.epa.gov/water/owrccatalog.nsf/7322259e90d060c885256f0a0055db68/11ee7c3d286ab8b385256f6c007134b9!opendocument
U.S. Environmental Protection Agency. (n.d.). Climate impacts on water resources. Retrieved from https://www.epa.gov/climate-impacts/climate-impacts-water-resources
Warner, L. A. (2014). Enhancing the capacity to create behavior change: Extension key leaders' opinions about social marketing and evaluation. Journal of Agricultural Education, 55(4), 176–190. doi:10.5032/jae.2014.04176
Wolters, E. A. (2014). Attitude–behavior consistency in household water consumption. The Social Science Journal, 51(3), 455–463. doi:10.1016/j.soscij.2013.10.003