April 2015
|
April 2015 // Volume 53 // Number 2 // Research In Brief // v53-2rb9


Effectiveness of Nutrient Management Plans on Vermont Dairy Farms
Abstract
A nutrient management plan (NMP) is a tool that helps livestock farmers optimize crop nutrient use. A survey of Vermont dairy farmers was conducted to learn about farmers' implementation of and perceptions about the effects of NMPs. Results showed that 46% of the 301 respondents had NMPs, particularly large and medium size operations. The majority followed the plans most of the time (barring weather and other constraints). The study revealed that NMPs affected total perceived fertilizer use and adoption of conservation practices. It showed that the person(s) updating the NMP affected the frequency to which the plan's recommendations were consulted.
Introduction
A nutrient management plan (NMP) is a tool livestock farmers use to optimize on-farm and purchased nutrient sources by using farm level data to provide field-specific prescriptions for nutrient applications (Beegle, Carton, & Bailey, 2000). These plans are considered key tools in helping farms increase long-term economic and environmental sustainability (Beegle et al., 2000; Klausner et al., 1998; VanDyke, Pease, Bosch, & Baker, 1999), helping protect water quality while producing high quality and high yielding crops (Genskow, 2012).
In Vermont, strategies addressing water quality problems resulting from excess nutrients have called for the widespread use of agricultural Best Management Practices (BMPs), including NMPs, to better manage phosphorus and other nutrient use on farms (LCBP, 2010). Dairies with more than 200 mature cows—large farm operations (LFOs) and medium farm operations (MFOs)—fall under state regulation and are required to have NMPs that meet USDA Natural Resources Conservation Service (NRCS) 590 practice standards that specify management of the source, timing, amount, and placement of plant nutrients and soil amendments (NRCS, 2006; Vermont Agency of Agriculture, 2013a). Further, farmers are required to annually update NMPs to meet these regulations. Small farms are not required to meet this same standard, but many choose to develop NMPs to meet requirements for other state and federal BMP cost-sharing programs.
As the use of NMPs has grown over the past decade, agricultural service providers and farmers alike have realized that the process of developing a prescriptive NMP can intensively consume time and financial resources (Genskow, 2012). In response to farmer needs, the University of Vermont (UVM) Extension developed a unique educational program that trains farmers on how to create, implement, and maintain their own NMP. This educational program includes computer and mobile software (e.g., goCrop™) and multi-session courses that address the science and practice of nutrient management and relevant regulatory requirements (Darby, 2009). Other agricultural service providers—including private consultants and federal and state agency employees—help farmers create and update NMPs, with varying levels of farmer involvement.
While it is generally assumed that NMPs decrease environmental impacts and save money by increasing farm efficiency and decreasing purchased fertilizers, anecdotal evidence suggests that, in practice, these assumptions may not always be correct. The scientific literature also indicates that for many BMPs (including NMP implementation and manure management), actual levels of implementation may not reach planned levels, reducing the benefits of these practices (Cabot & Nowak, 2005; Jackson-Smith, Halling, de la Hoz, McEvoy, & Horsburgh, 2010; Pierce, Nowak, & Cabot, 2007). Many studies indicate that farmers' understanding of and involvement in the development of NMPs may be critical to higher levels of implementation (Beegle et al., 2000; Everett, Blanchet, & DeJong-Hughes, 2010).
To learn more about farmers' implementation of and perceptions about NMPs, UVM Extension conducted a survey-based study of Vermont dairy farms. The objectives were to: a) identify the number and types of dairy farms with NMPs; b) determine the extent to which NMPs are implemented and regularly updated and understand what factors affect levels of use; and c) evaluate the perceived economic and environmental effects of NMPs on Vermont farms from the producer perspective.
Methods
During the winter of 2011-2012, a mail survey was developed following university institutional review board protocols on human subjects research and was administered drawing on the Dillman approach (Dillman, 2000). A two-page survey instrument was mailed in January 2012 (with two reminders sent 4 weeks apart to non-respondents) to 1,343 Vermont dairy farms, considered a total population of the state's dairy operations.
The survey contained 21 questions asking farmers to describe farm type, acreage, and number of livestock. It asked if the farm had an NMP, when it was developed and by whom, when it was last updated and by whom, and costs to develop and update the NMP. It also included questions about how widely the NMP was followed, how often NMP recommendations were consulted when making management decisions, how often NMP data were updated, fertilizer use before and after the NMP was implemented, amount of money saved and/or expended as a result of the NMP, impact on crop yields, and practices implemented as a result of the NMP.
A total of 301 valid responses were received (22.4% response rate).
Statistical Analyses
To understand perceived pre- and post-NMP effects on crop yield, fertilizer use, and cost savings, the Wilcoxon signed rank test was used.
Three explanatory variables on NMP use were explored to understand factors that drive differing levels of NMP implementation: a) who developed the NMP ("NMP developer"), b) who updated the NMP ("NMP updater"), and c) regulatory farm size. Survey options for NMP developer and updater included: a) farmer him/herself, b) private consultant, c) state or federal employee, d) with education and/or assistance from UVM Extension, and, in the case of the NMP updater, e) not updated. These variables (NMP developer and updater) related to differing levels of farmer involvement with their NMP, while the third variable reflected the difference between regulatory and voluntary nutrient management.
The survey divided NMP use into three separate measures. The first was the proportion of farm acreage where the farmer followed NMP recommendations (Table 1). A separate logistic regression model was used in this analysis for each explanatory variable noted above (Gelman & Su, 2013).
| Survey Response | Interpretation |
| 1 | Did not follow at all |
| 2 | < 25% of acres |
| 3 | 25% - 50% of acres |
| 4 | 50% - 75% of acres |
| 5 | 75% - 99% of acres |
| 6 | 100% of acres |
A second measure reflected the regularity to which the farmer consulted NMP recommendations for the crop rotation schedule, manure spreading rates, and fertilizer spreading rates. These were measured on a 1 to 5 scale, where "1" represented never, "3" represented every 3 years, and "5" represented every year.
A third measure reflected the regularity to which the farmer updated input data sets that form the basis for NMP recommendations, including:
- Soil test values,
- Manure test values,
- Manure production quantity,
- Crop rotation schedule,
- Manure application rates,
- Fertilizer application rates, and
- Phosphorus index information (Sharpley et al., 2003).
A principal components analysis was used to reduce the number of variables for each set of analyses and eliminate collinearity in responses. Separate MANOVA analyses were then used to evaluate relationships between the explanatory variables and retained principal components using type-II sums of squares to accommodate imbalance among the treatment levels (Fox & Weisberg, 2011).
The statistical program R (R Core Team, 2013) was used for all statistical analyses; all graphics were developed in ggplot (Wickham, 2009).
Results
Number of Vermont Dairy Farms with NMPs
Demographics of the respondents indicate that they comprised a representative sample of Vermont dairy farms (Table 2).
| Farm size | Survey responses | Proportion of survey responses | Number of Vermont dairy farmsa | Actual proportion of farm sizes in Vermont |
| SFOb | 242 | 80.4% | 842 | 82.8% |
| MFOc | 45 | 15.0% | 155 | 15.2% |
| LFOd | 14 | 4.60% | 20 | 2.00% |
| Totals | 301 | 100% | 1017 | 100% |
|
a Vermont Agency of Agriculture (2013b). b SFOs, small farm operations, include dairy farms with fewer than 200 mature dairy cows. c MFOs, medium farm operations, include dairy farms with between 200 and 700 mature dairy cows. d LFOs, large farm operations, include dairy farms with more than 700 mature dairy cows. |
||||
For the most part, LFOs and MFOs indicated that they had active NMPs, which was expected as both farm sizes are required by regulation to have them (Table 3). Although there had been no regulatory requirements for most SFOs to do so, about one third of SFOs also had NMPs; however, half had not updated their NMPs within three or more years and were considered out of date. Results revealed that the majority of dairy agricultural acreage across Vermont was managed under NMPs.
| Responses to the survey are tallied below and include the number and proportion of farms with NMPs, plans out of date, and percent of farm acres managed under an NMP. | ||||||||
| Farm size | Total Responses | Farms with an NMP | Out of Date NMPsa | Acres under an NMP | ||||
| n | % | n | % | n | % | % | ||
| SFO | 242 | 80.4 | 80 | 33.1 | 41 | 51.3 | 38.3 | |
| MFO | 45 | 15.0 | 44 | 97.7 | 3 | 6.8 | 98.8 | |
| LFO | 14 | 4.6 | 14 | 100.0 | 0 | 0.0 | 100.0 | |
| Totals | 301 | 100.0 | 138 | 45.8 | 44 | 31.9 | 64.7 | |
| a "Out of date" refers to plans not updated for three or more years. | ||||||||
Implementation of NMPs on Vermont Dairy Farms
Implementation and maintenance of NMPs were measured using three metrics as described above. For each metric, the effect of NMP developer, NMP updater, and farm size were evaluated as explanatory variables.
The results suggested that most farms (60.6%) implemented the NMP recommendations on at least 75% of their acreage. Less than one quarter (22.8%) of farms implemented the recommendations on all of their acreage; very few (15.8%) implemented the recommendations on less than half of their acreage.
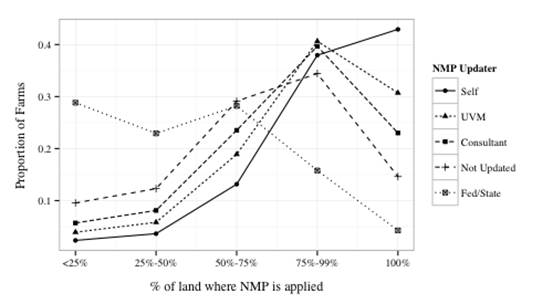
Several service providers, including UVM Extension, provided education and/or assistance to farmers as they developed and maintained their NMPs; therefore, the effects these groups had on NMP implementation were evaluated. Analysis revealed that there was no evidence that NMP developer and farm size affected the extent of NMP implementation (p = 0.29 and 0.17, respectively); however, the NMP updater was important (p = 0.04). Results showed that NMPs updated by farmers themselves, with assistance from UVM Extension, or by private consultants were similar in how extensively the NMP recommendations were implemented (Figure 1). NMPs updated by producers themselves were more likely to be implemented on 100% of their acreage, an indication that these producers may have greater buy-in or understanding of the NMP as a management tool. Plans not updated or updated by a federal or state employee were implemented on fewer acres.
Figure 1.
Proportion of Farms Applying NMPs, by Acreage Category and NMP Updater
Producers who applied NMP recommendations to less than 100% of their acres cited the weather, lack of time and/or money, and others reasons as barriers (Table 4). Some producers commented that "lack of time" was sometimes related to short windows of good weather and that a lack of cash meant that they could not afford to purchase enough fertilizer to meet the recommended crop needs.
| Reasons | Percent |
| Weather doesn't allow me to | 50.7 |
| Not enough time and/or money | 35.9 |
| Don't believe the recommendations | 4.2 |
| Custom operators won't follow | 4.2 |
| Plan wasn't available when needed | 1.4 |
| Don't understand the recommendations | 1.4 |
| Other1 | 9.1 |
| 1 These were open ended responses and included comments about farmers' busy schedules, prohibitive fertilization costs, and lack of needs to implement or change practices. | |
Producers were asked how often they consulted NMP recommendations on crops to plant, manure spreading rates, and fertilizer spreading rates, as well as how often they updated the plan's data used to generate recommendations. Mean values and middle 50% ranges are presented in Figure 2 for all farm sizes.
The data revealed that, generally, LFO and MFO producers consulted their plans and updated the information in most years. These operations showed less farm-to-farm variability in how often different elements of the plans were consulted and updated when compared to SFOs. MANOVA results showed strong evidence that SFOs consult NMPs less often (p=0.003) and moderate evidence that they updated their plans less often than MFOs and LFOs (p=0.06).
Figure 2.
Regularity with Which Producers Consult NMP Recommendations and Update NMPs
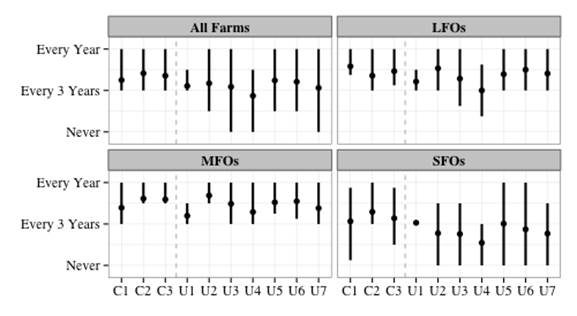
Means (dots) and middle 50% ranges (lines) reported. MFOs and LFOs are statistically similar, but SFOs consult and update their plans less often than larger farms.
Key
C1 = Consults crop rotations.
C2 = Consults recommended manure rates.
C3 = Consults recommended fertilizer rates.
U1 = Updates soil test values.
U2 = Updates manure test values.
U3 = Updates manure production quantity.
U4 = Updates crop rotation schedule.
U5 = Updates manure application rates.
U6 = Updates fertilizer application rates.
U7 = Updates phosphorus index information.
The effect of NMP updater on how producers used their NMPs was also clear in these measures. NMP developers did not appear to affect how often producers consulted NMP recommendations nor how often the plans' data were updated. However, there was strong evidence that NMP updaters did have an effect on how often NMP recommendations were consulted (p=0.001). In this case, NMPs updated by farmers themselves, by private consultants, and with assistance from UVM Extension were consulted similarly; plans not updated or updated by federal or state employees were consulted less often.
Economic Effects of NMPs
Results indicated that NMPs had no effect on perceived fertilizer costs. Likewise, plans, on average, did not confer extra costs to producers. Some variability existed in this regard as several producers reported savings while others reported significant costs in maintaining their NMPs (Figure 3).
Figure 3.
Distribution of Producer Responses Reporting Overall Cost or Savings Conferred by NMPs
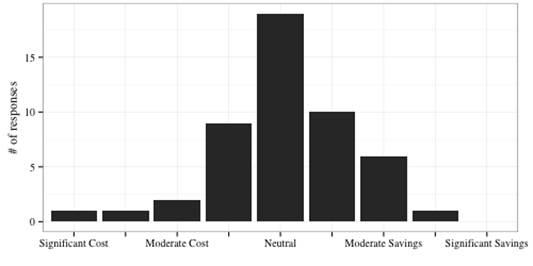
Note: The average difference between cost and savings is not statistically different from zero, or neutral (p=0.44).
Though producers did not perceive overall savings on fertilizer, NMPs did help reduce total fertilizer use and reduced individual nitrogen, phosphorus, and potassium rates (Figure 4). This inconsistency may be explained by recent rises in fertilizer prices or to higher costs of custom fertilizer formulations that better complement the high phosphorus nutrient profile of dairy manure (Powers & Van Horn, 2001). So, while producers used less fertilizer, increased costs meant that, overall, fertilizer expenses remained level.
Figure 4.
Fertilizer Use Before and After NMP Adoption
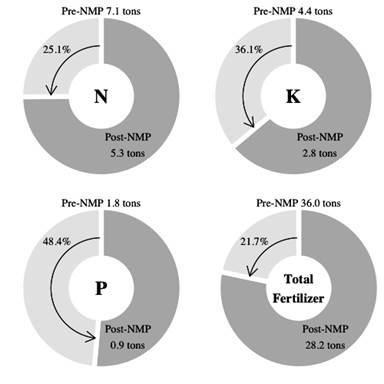
Note: Pre-NMP values for each nutrient (where N is nitrogen, P is phosphorus, and K is potassium) are represented by the whole circle, post-NMP values by the darker shaded portion. Percent reductions are given in the lighter shading. All values are per farm, per year, and all are statistically significant (p < 0.05).
Environmental Effects of NMPs
Phosphorus levels in surface waters are of great interest in Vermont as they have risen above established water quality targets in several parts of Lake Champlain, the state's largest water body (LCBP, 2008). Analysis of survey responses showed that NMPs helped farms reduce phosphorus use by 1800 pounds (0.9 tons) per farm per year since implementing their NMPs, a greater proportional reduction than other nutrients (Figure 4).
Through the survey producers also reported that NMPs had a slightly positive effect on crop yields, suggesting more targeted and efficient use of available nutrients from manure and fertilizer.
A majority of farms indicated adoption of conservation practices as a result of developing NMPs (Table 5). For example, more than half started to regularly use manure setbacks, while nearly half incorporated manure more quickly and established buffers at field edges.
| Conservation Practice | Percent Adoption Since NMP |
| Manure setbacks | 57.3 |
| Buffers | 48.3 |
| Timely manure incorporation | 46.9 |
| Applying NPK by recommendation | 40.6 |
| Cover cropping | 33.6 |
| Crop rotation | 32.2 |
| Reduced tillage | 11.9 |
| Strip cropping | 4.90 |
Seventy-eight percent of respondents felt that nutrient runoff and erosion on their farms was reduced as a result of implementing NMP recommendations. Additionally, several farmers commented that NMPs raised their environmental awareness. For example, one farmer wrote, "[The NMP] makes us more aware of how our practices impact the environment." Another wrote, "[We are] more sensitive about land near streams and waterways, keeping manure spreading setbacks and buffers in place."
Discussion
The survey results showed that Vermont dairy farms of all sizes had NMPs and used them to make management decisions, especially when farmers updated the plans themselves. Similar to other studies, results showed that by implementing NMPs, farmers reduced fertilizer use, especially phosphorus applications (Shepard, 2005; VanDyke et al., 1999). However, a shift away from purchased fertilizer may represent a stronger reliance on manure, and, therefore, it is unclear whether NMPs actually encourage lower nutrient application rates or eliminate excess nutrients in the soil (Shepard, 2005).
Results seemed to indicate that full NMP implementation was limited primarily by inclement weather conditions. Therefore, idealized effects of NMPs detailed in many modeling-based studies may not always be realistically attainable (Amon-Armah et al., 2013; Gitau, Gburek, & Jarrett, 2005; Thomas et al., 2007; VanDyke et al., 1999). Furthermore, as the Northeast U.S. experiences more extreme weather events, implementation of conservation practices and climate change adaptation strategies to improve soil quality will become more important for water quality and farm economics (Frumhoff, McCarthy, Melillo, Moser, & Wuebbles, 2007; Stager & Thill, 2010). The study showed that this is already occurring, as the majority of respondents had implemented one or more conservation practices.
Implications for Extension Programming
The results also indicated that NMPs were more likely to be followed if farmers themselves updated their plans, were updated by a consultant, or with education and/or assistance from UVM Extension. Other studies have shown that close farmer involvement in NMP development resulted in better use of the recommendations (Everett et al., 2010; Genskow, 2012). Focused education and technical assistance from Extension personnel can help farmers understand how and why the plans may be used to make management decisions that positively affect farm economics and environmental quality. Further, any methods that Extension educators can use to encourage, coach, and/or facilitate farmers to update their plans on a regular basis will likely increase successful implementation of NMP recommendations.
Recommendations for Future Research and Outreach
The study showed that farm size was a significant predictor of how often the plans were consulted and updated; for example, SFOs consulted their NMPs significantly less often than MFOs. In Vermont, most small farm operations have not been required to have NMPs that meet USDA NRCS 590 practice standards. However, ongoing public concerns about water quality may indicate that, in the future, all farms, including SFOs, will be required to develop and follow NMPs. Therefore, education of and proactive outreach to this farm audience may be another means for better and broader scale NMP adoption.
Results of the survey also indicated that the persons(s) who updated the NMP affected the frequency with which the plan's recommendations were consulted. More investigation into this finding is warranted. By learning more about why certain types of individuals affect adoption of NMP recommendations may help Extension and other service providers better understand how to optimize NMP use among dairy and other livestock farmers. Further, investigating farmers' beliefs, values, and motivations around nutrient management and water quality may lead to enhanced Extension education and technical support for farmers as they develop, update, and use NMPs to make management decision on their farms.
Conclusion
The survey sought to learn more about dairy farmers' implementation of and perceptions about NMPs. Results showed that Vermont dairy farms of all sizes, particularly large and medium size operations, had NMPs that meet the NRCS 590 standard. The majority of farmer respondents, especially those who updated the plans themselves, followed the plans most of the time (barring weather and other constraints) and used them to make management decisions. The study revealed that NMPs helped farmers reduce total fertilizer use and reduced individual nitrogen, phosphorus, and potassium rates. It also showed that farms adopted conservation practices as a result of developing NMPs.
References
Amon-Armah, F., Yiridoe, E. K., Ahmad, N. H. M., Hebb, D., Jamieson, R., Burton, D., & Madani, A. (2013). Effect of nutrient management planning on crop yield, nitrate leaching and sediment loading in thomas brook watershed. Environmental Management, 52(5), 1177-1191. doi: 10.1007/s00267-013-0148-z
Beegle, D. B., Carton, O. T., & Bailey, J. S. (2000). Nutrient management planning: Justification, theory, practice. Journal of Environmental Quality, 29(1), 72-79.
Cabot, P. E., & Nowak, P. (2005). Planned versus actual outcomes as a result of animal feeding operation decisions for managing phosphorus. Journal of Environmental Quality, 34(3), 761-773. doi: 10.2134/jeq2002.0529
Darby, H. (2009). Digging in: A nutrient management course for farmers. St. Albans, VT: University of Vermont Extension. Retrieved from: http://www.uvm.edu/extension/cropsoil/wp-content/uploads/Digging_In_2013.pdf
Dillman, D. (2000). Mail and internet surveys. New York, NY.: John Wiley & Sons, Inc.
Everett, L. A., Blanchet, K., & DeJong-Hughes, J. (2010). Small-group workshops develop participant commitment for nutrient management planning. Journal of Extension [On-line], 48(4), Article 4TOT9. Available at: http://www.joe.org/joe/2010august/tt9.php
Fox, J., & Weisberg, S. (2011). An {R} companion to applied regression, second edition. Thousand Oaks, CA: Sage Publications. Retrieved from: http://socserv.socsci.mcmaster.ca/jfox/Books/Companion
Frumhoff, P. C., McCarthy, J. J., Melillo, J. M., Moser, S. C., & Wuebbles, D. J. (2007). Confronting climate change in the U.S. Northeast: Science, impacts, and solutions. Synthesis report of the Northeast Climate Impacts Assessment (NECIA). Cambridge, MA: Union of Concerned Scientists (UCS).
Gelman, A., & Su, Y. S. (2013). arm: Data analysis using regression and multilevel/hierarchical models. R package version 1.6-10. Retrieved from: http://CRAN.R-project.org/package=arm
Genskow, K. D. (2012). Taking stock of voluntary nutrient management: Measuring and tracking change. Journal of Soil and Water Conservation, 67(1), 51-58. doi: 10.2489/jswc.67.1.51
Gitau, M. W., Gburek, W. J., & Jarrett, A. R. (2005). A tool for estimating best management practice effectiveness for phosphorus pollution control. Journal of Soil and Water Conservation, 60(1), 1-10.
Jackson-Smith, D. B., Halling, M., de la Hoz, E., McEvoy, J. P., & Horsburgh, J. S. (2010). Measuring conservation program best management practice implementation and maintenance at the watershed scale. Journal of Soil and Water Conservation, 65(6), 413-423. doi: 10.2489/jswc.65.6.413
Klausner, S. D., Fox, D. G., Rasmussen, C. N., Pitt, R. E., Tylutki, T. P., Wright, P. E., Chase, L.E., & Stone, W. C. (1998). Improving dairy farm sustainability I: An approach to animal and crop nutrient management planning. Journal of Production Agriculture, 11(2), 225-233.
LCBP. (2008). State of the lake and ecosystem indicators report. Grand Isle, VT: Lake Champlain Basin Program.
LCBP. (2010). Opportunities for action: An evolving plan for the future of the Lake Champlain basin. Grand Isle, VT: Lake Champlain Basin Program.
NRCS. (2006). Natural Resources Conservation Service conservation practice standard - code 590. Retrieved from: http://www.nrcs.usda.gov/Internet/FSE_DOCUMENTS/nrcs143_022228.pdf
Pierce, F. J., Nowak, P., & Cabot, P. E. (2007). Coping with the data dilemma. In M. Schnepf & C. Cox (Eds.), Managing Agricultural Landscapes for Environmental Quality: Strengthening the Science Base. Ankeny, IA: Soil and Water Conservation Society.
Powers, W. J., & Van Horn, H. H. (2001). Nutritional implications for manure nutrient management planning. Applied Engineering in Agriculture, 17(1), 27-39.
R Core Team. (2013). R: A language and environment for statistical computing (Version 3.0.2). Vienna, Austria: R Foundation for Statistical Computing. Retrieved from: http://www.R-project.org/
Sharpley, A. N., Weld, J. L., Beegle, D. B., Kleinman, P. J. A., Gburek, W. J., Moore, P. A., & Mullins, G. (2003). Development of phosphorus indices for nutrient management planning strategies in the United States. Journal of Soil and Water Conservation, 58(3), 137-152.
Shepard, R. (2005). Nutrient management planning: Is it the answer to better management? Journal of Soil and Water Conservation, 60(4), 171-176.
Stager, J. C., & Thill, M. (2010). Climate change in the Champlain basin: what natural resource managers can expect and do. Adirondack and Vermont chapters: The Nature Conservancy.
Thomas, M. A., Engel, B. A., Arabi, M., Zhai, T., Farnsworth, R., & Frankenberger, J. R. (2007). Evaluation of nutrient management plans using an integrated modeling approach. Applied Engineering in Agriculture, 23(6), 747-755.
VanDyke, L. S., Pease, J. W., Bosch, D. J., & Baker, J. C. (1999). Nutrient management planning on four virginia livestock farms: impacts on net income and nutrient losses. Journal of Soil and Water Conservation, 54(2), 499-505.
Vermont Agency of Agriculture. (2013a). Agricultural water quality regulatory programs.
Vermont Agency of Agriculture. (2013b). Number of vermont dairy farms.
Wickham, H. (2009). ggplot2: Elegant graphics for data analysis. New York: Springer.