April 2015
|
April 2015 // Volume 53 // Number 2 // Research In Brief // v53-2rb8


Survey of Pest Management Practices on Washington Dairy Farms
Abstract
Washington state dairy producers were surveyed to determine pest and parasite prevalence and range of current pest management strategies. Nearly all respondents reported treating their cattle or premises for flies, while 62% reported treating their animals for external parasites. Use of pyrethroid and pyrethrins insecticides was common throughout the state. Results indicated that use of non-chemical options to control flies are commonly used by Washington dairy producers and may have become more widespread since the late 1990s. Extension professionals could improve outreach education to dairies by partnering with farm supply stores, veterinarians, and feed distributors.
Introduction
U.S. dairy producers are motivated to reduce fly populations on their dairies to improve animal health and well-being, which in turn improves milk production. Numerous chemical and non-chemical treatment options to control flies and/or other external parasites are available to dairy managers. Pest management plans vary among dairies in Washington State; generally, dairies tailor their programs based on economics and cattle housing accommodations.
Recent dairy surveys queried producers about economics (Bitsch, 2009; Neibergs & Brady, 2013), feeding practices (Leonardi et al., 2011), and on-farm mortality composting (Price, Carpenter-Boggs, & Goldberger, 2009). Very few surveys have asked dairy managers about pest problems and pest management strategies; Neibergs and Brady (2013) did not query them on costs of pest control either. The last comprehensive survey on pest management practices on dairies was accomplished in 1997 in New York (Harrington et al., 1997). The last survey on agricultural chemical usage on dairies was conducted in 2006 by the United States Department of Agriculture, National Agricultural Statistics Service (USDA-NASS, 2007a).
The University of Washington's (UW) Pacific Northwest Agricultural Safety and Health (PNASH) Center partnered with Washington State University (WSU) Extension Integrated Pest Management (IPM) Program. Our main objective was to obtain baseline information on pest prevalence and pest management practices on Washington dairies as part of a larger project aimed at reducing pyrethroid insecticide use and exposure on dairies. Following are the principal results of our survey of pest management practices on dairy farms. These response data will serve to inform the research team's future outreach programming objectives.
Survey Methodology
WSU Extension and PNASH prepared a brief, six-page questionnaire and sent it to 414 dairy producers in Washington State during the fall of 2012. The questionnaire was based on a previous survey of Washington beef producers (Ferguson, Coates, Walsh, & Linton, 2006) and included questions from the previous 1997 New York survey (Harrington et al., 1997). To ensure validity, the questionnaire was reviewed by the Washington State Dairy Federation (WSDF) and WSU Veterinary Medicine Extension. The survey was also approved by UW's Institutional Review Board. Surveys were addressed and mailed from WSDF to all WSDF Grade-A dairy producers. The survey queried producers on pest and parasite issues, methods of pest management, and information sources. Two follow-up reminders were issued, one as a postcard mailed to each recipient and a second via WSDF's weekly e-newsletter.
Results
Statewide Distribution of Survey Respondents
Seventy-nine surveys from 18 counties were returned, with 77 considered suitable for inclusion in analysis; the response rate was approximately 19%. For convenience, the state of Washington was divided into six regions: northwest, southwest, north central, south central, northeast, and southeast (Figure 1). Respondents are grouped accordingly in Table 5. Counties represented in this survey are:
- Northwest: Clallam, King, Kitsap, Skagit, Snohomish, Whatcom;
- Southwest: Clark, Cowlitz, Grays Harbor, Lewis, Pacific, Wahkiakum;
- North Central: no response;
- South Central: Grant, Yakima;
- Northeast: Spokane, Stevens; and
- Southeast: Adams, Franklin.
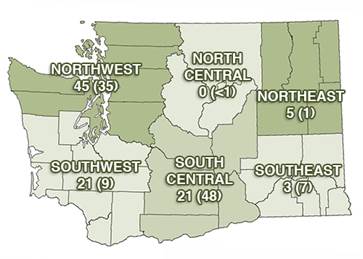
The highest number of responses came from the northwest region (35 responses, or 45%), followed by south central and southwest regions (each with 16, or 21%), 4 (5%) from the northeast, 2 (3%) from the southeast, and none from the north central region (Figure 1, first number in region is percentage of respondents). Four respondents (5%) did not specify a region. Using milk cow inventory for each county as an index for milk production (USDA-NASS, 2007b), percent respondents was compared with percent of the state's dairy cow herd for the region (second number in region, Figure 1). This showed that south central and southeast regions were probably under-sampled, while northwest, southwest, and northeast regions were probably over-sampled.
Figure 1.
Percentage of Survey Respondents (Percentage of State Dairy Herd) in Six Regions of Washington (USDA-NASS, 2007b)
Sixty respondents (78%) managed conventional dairy operations. Seventeen respondents (22%) described their dairies as organic, transition to organic, natural, or biorational; these were called non-conventional respondents in analysis.
Pests and Parasites
The prevalence of fly pests and parasites was assessed by asking dairy producers when and how often they treat for flies, cattle grubs, cattle lice, mites, and ticks. Fly pests were deemed the most important, based on relative frequency of treatment reported by producers. Four different kinds of flies can become pests on dairies. House fly and stable fly are prominent on conventional operations, while face fly and horn fly are the principal species on dairy operations in which cattle are pastured. House flies can be quite annoying to animals and people; they have great potential to transfer disease pathogens throughout the dairy. The biting/bloodsucking activity of stable flies and the smaller horn flies directly result in reduced milk production and consequent economic loss. Face flies annoy cattle by feeding on secretions from eyes and nostrils; they may also transmit the pathogen responsible for pinkeye disease. Cattle grubs, cattle lice, mites, and ticks, all considered external parasites of cattle, may cause coat and hide damage (grubs, lice, mites), blood loss (lice, ticks), reduced milk production (grubs, lice, ticks), or disease transmission (ticks) (Ferguson et al., 2006; Geden, Rutz, & Pitts, 2010; Jonsson, Mayer, Matschoss, & Green, 1998).
Frequency of Treatment for Pests and Parasites
Based on their responses to several questions, approximately 92% of conventional dairies reported using chemical treatment for flies on animals or premises. Half of non-conventional (mostly organic) dairies reported applying chemicals (pyrethrins) to control flies, while the other half did not treat for flies. In contrast, only 70% of conventional dairies and 35% of non-conventional dairies reported treating animals for external parasites.
Most conventional dairy respondents reported regularly treating for all flies, with 32% of respondents treating often (daily, every few days, and weekly) and 40% treating less often, from bi-weekly to monthly (Table 1). Twelve percent of non-conventional dairy respondents reported treating for all flies every few days, while 12% treated every week. Very little response data were gathered for specific fly species.
|
% (number) conventional dairy respondents reporting frequency** n = 60 |
|||||||
| Fly pests | Daily | Every few days | Weekly | Every two weeks | Every month | Never | Non-response |
| All flies* | 13 (8) | 12 (7) | 7 (4) | 10 (6) | 30 (18) | 20 (12) | 7 (4) |
| Face flies | 8 (5) | 2 (1) | 0 | 0 | 7 (4) | 30 (18) | 53 (32) |
| Horn flies | 8 (5) | 2 (1) | 0 | 2 (1) | 5 (3) | 28 (17) | 55 (33) |
| House flies | 10 (6) | 2 (1) | 2 (1) | 0 | 10 (6) | 25 (15) | 52 (31) |
| Stable flies | 7 (4) | 3 (2) | 0 | 2 (1) | 7 (4) | 27 (16) | 55 (33) |
|
% (number) non-conventional dairy respondents reporting frequency** n = 17 |
|||||||
| All flies | 0 | 12 (2) | 12 (2) | 0 | 6 (1) | 53 (9) | 18 (3) |
| Face flies | 0 | 12 (2) | 6 (1) | 0 | 6 (1) | 53 (9) | 24 (4) |
| Horn flies | 0 | 12 (2) | 6 (1) | 0 | 0 | 53 (9) | 29 (5) |
| House flies | 0 | 12 (2) | 6 (1) | 0 | 0 | 53 (9) | 29 (5) |
| Stable flies | 0 | 12 (2) | 6 (1) | 0 | 6 (1) | 53 (9) | 24 (4) |
|
*One write-in response of "when needed" for All flies is not included in table. **Percentages may not add up to 100 due to rounding error. |
|||||||
Conventional dairy respondents who treated cattle for parasites reported a typical annual treatment for cattle grubs (18%), cattle lice (28%), mites (22%), and ticks (8%) (Table 2). In addition, 28% of conventional respondents reported treating their cattle for lice more than once a year. Producers would often treat for more than one parasite at the same time; approximately 19% of respondents treated for all four parasites during the same season. Very few non-conventional dairy respondents reported treating for parasites (Table 2).
|
% (number) conventional dairy respondents reporting frequency* n = 60 |
|||||
| Parasite | One time a year | Twice a year | Three times a year | Never | Non-response |
| Cattle grubs | 18 (11) | 5 (3) | 5 (3) | 52 (31) | 20 (12) |
| Cattle lice | 28 (17) | 15 (9) | 13 (8) | 37 (22) | 7 (4) |
| Mites | 22 (13) | 8 (5) | 5(3) | 50 (30) | 15 (9) |
| Ticks | 8 (5) | 5 (3) | 3 (2) | 55 (33) | 28 (17) |
|
% (number) non-conventional dairy respondents reporting frequency* n = 17 |
|||||
| Cattle grubs | 0 | 0 | 6 (1) | 82 (14) | 12 (2) |
| Cattle lice | 6 (1) | 12 (2) | 12 (2) | 64 (11) | 6 (1) |
| Mites | 0 | 6 (1) | 12 (2) | 76 (13) | 6 (1) |
| Ticks | 0 | 0 | 0 | 88 (15) | 12 (2) |
| *Percentages may not add up to 100 due to rounding error. | |||||
Importance of Reasons for Treatment
Dairy producers were queried on their motivations to treat for flies and parasites. Response data were aggregated. For fly treatment, the top four reasons ranked as very important (extremely + frequently important) by conventional dairy respondents were presence of flies on cattle, cattle behavioral responses to flies, presence of flies on buildings, and presence of flies on hutches (Table 3). Fewer non-conventional dairy producers found any reason to be very important; presence of flies on cattle was ranked by 24% of them as very important. For on-animal parasite treatment, the top reason ranked as very important by 22 and 24% of conventional and non-conventional producer respondents, respectively, was the presence of parasites on cattle (Table 4).
|
% (number) conventional dairy respondents citing rank of importance* n = 60 |
||||
| Reason | Very important | Less important | Never important | Non-response |
| Presence of flies on cattle | 50 (30) | 32 (19) | 2 (1) | 17 (10) |
| Cattle behavioral responses to flies | 43 (26) | 33 (20) | 3 (2) | 20 (12) |
| Presence of flies on buildings | 42 (25) | 40 (24) | 3 (2) | 15 (9) |
| Presence of flies on hutches | 40 (24) | 30 (18) | 10 (6) | 20 (12) |
| Read that flies are a problem | 15 (9) | 33 (20) | 33 (20) | 18 (11) |
| Traditional use from past years | 13 (8) | 42 (25) | 23 (14) | 22 (13) |
| Veterinarian recommendation | 7 (4) | 32 (19) | 43 (26) | 18 (11) |
| Neighbor complaints | 5 (3) | 17 (10) | 62 (37) | 17 (10) |
| Others in area treat | 3 (2) | 23 (14) | 53 (32) | 20 (12) |
|
% non-conventional dairy respondents citing rank of importance* n = 17 |
||||
| Presence of flies on cattle | 24 (4) | 6 (1) | 12 (2) | 59 (10) |
| Cattle behavioral responses to flies | 18 (3) | 12 (2) | 12 (2) | 59 (10) |
| Read that flies are a problem | 18 (3) | 12 (2) | 12 (2) | 59 (10) |
| Presence of flies on buildings | 18 (3) | 6 (1) | 18 (3) | 59 (10) |
| Presence of flies on hutches | 6 (1) | 12 (2) | 18 (3) | 65 (11) |
| Traditional use from past years | 6 (1) | 12 (2) | 18 (3) | 65 (11) |
| Veterinarian recommendation | 18 (3) | 6 (1) | 18 (3) | 59 (10) |
| Others in area treat | 0 | 12 (2) | 29 (5) | 59 (10) |
| Neighbor complaints | 0 | 12 (2) | 24 (4) | 65 (11) |
| *Response data were combined as follows: very important = frequently + extremely important; less important = not very + occasionally; never important = not at all. Percentages may not add up to 100 due to rounding error. | ||||
|
% conventional dairy respondents citing rank of importance* n = 60 |
||||
| Reason | Very important | Less important | Never important | Non-response |
| Presence of parasites on cattle | 22 (13) | 33 (20) | 10 (6) | 35 (21) |
| Veterinarian recommendation | 17 (10) | 27 (16) | 22 (13) | 35 (21) |
| Read that parasites are a problem | 15 (9) | 23 (14) | 23 (14) | 38 (23) |
| Traditional use from past years | 10 (6) | 27 (16) | 22 (13) | 42 (25) |
| Others in area treat | 0 | 20 (12) | 38 (23) | 42 (25) |
|
% non-conventional dairy respondents citing rank of importance* n = 17 |
||||
| Presence of parasites on cattle | 24 (4) | 6 (1) | 12 (2) | 59 (10) |
| Read that parasites are a problem | 12 (2) | 18 (3) | 12 (2) | 59 (10) |
| Veterinarian recommendation | 18 (3) | 6 (1) | 18 (3) | 59 (10) |
| Traditional use from past years | 0 | 18 (3) | 24 (4) | 59 (10) |
| Others in area treat | 0 | 12 (2) | 29 (5) | 59 (10) |
| *Response data were combined as follows: very important = frequently + extremely important; less important = not very + occasionally; never important = not at all. Percentages may not add up to 100 due to rounding error. | ||||
Use of Pyrethroid and Pyrethrins Insecticides
Dairy producers were queried on which insecticide formulations and products they used on animals and premises. The research team was interested primarily in pyrethroid insecticide use on dairies.
Producers reported that the principal usage areas for pyrethroids and pyrethrins are on-animal (cows and calves) and premises (Table 5). Producers used permethrin on cattle most commonly, followed by pyrethrins, then beta-cyfluthrin. Beta-cyfluthrin consists of four of the eight biologically active isomers of cyfluthrin (Panger & Hetrick, 2013). For application to premises, producers reported using permethrin and beta-cyfluthrin most commonly, followed by cyfluthrin, then pyrethrins (Table 5). Statewide, dairy producers reported using seven different compounds. In addition to the four previously mentioned, producers reported treatments with bifenthrin, esfenvalerate, and fenvalerate (Table 5).
| Number of responses by usage area | ||||||
|
Region & Chemical |
Cows & calves |
Pasture | Premises* | Fencerows | Manure | Row Totals |
| Northwest n = 32 | ||||||
| beta-cyfluthrin | 0 | 0 | 8 | 1 | 0 | 9 |
| cyfluthrin | 0 | 0 | 4 | 0 | 0 | 4 |
| permethrin | 11 | 0 | 6 | 1 | 0 | 18 |
| pyrethrins | 8 | 3 | 3 | 0 | 0 | 14 |
| Southwest n = 14 | ||||||
| beta-cyfluthrin | 2 | 0 | 0 | 0 | 0 | 2 |
| esfenvalerate | 0 | 0 | 1 | 0 | 0 | 1 |
| permethrin | 7 | 0 | 3 | 0 | 0 | 10 |
| pyrethrins | 0 | 1 | 2 | 0 | 0 | 3 |
| South central n = 15 | ||||||
| beta-cyfluthrin | 1 | 0 | 6 | 2 | 0 | 9 |
| bifenthrin | 0 | 0 | 0 | 0 | 1 | 1 |
| cyfluthrin | 2 | 0 | 4 | 2 | 0 | 8 |
| fenvalerate | 0 | 0 | 2 | 1 | 0 | 3 |
| permethrin | 8 | 0 | 3 | 1 | 0 | 12 |
| pyrethrins | 5 | 0 | 1 | 0 | 1 | 7 |
| Northeast n = 3 | ||||||
| permethrin | 1 | 0 | 1 | 0 | 0 | 2 |
| pyrethrins | 1 | 0 | 0 | 0 | 0 | 1 |
| Southeast n = 2 | ||||||
| beta-cyfluthrin | 1 | 0 | 0 | 0 | 0 | 1 |
| No region n = 3 | ||||||
| cyfluthrin | 2 | 0 | 0 | 0 | 0 | 2 |
| permethrin | 2 | 0 | 2 | 0 | 0 | 4 |
| Usage area totals | 51 | 4 | 46 | 8 | 2 | 111 |
| *Premises included buildings, calf hutches, pens, and around structures. | ||||||
Use of Formulations for On-Animal and Premises Treatments
When dairy producers were asked which formulations they used for fly control, the most common responses were pour-ons and sprays (Table 6). For external parasites, pour-ons were the most common (Table 6). As seen in response data for treatment frequency, producers often treat their animals with the same product or formulation for multiple pests. For example, 34% of dairy respondents used a single pour-on product to treat for two to five pests/parasites.
|
% responding producers citing use* n = 57 |
||||||
| Pest | Pour-ons | Sprays | Dust bags | Backrubbers | Ear tags | Blocks |
| Flies | 51 | 54 | 21 | 4 | 4 | 2 |
| Cattle grubs | 33 | 5 | 5 | 4 | 2 | 2 |
| Lice | 47 | 16 | 14 | 4 | 2 | 2 |
| Mites | 33 | 9 | 7 | 4 | 0 | 0 |
| Ticks | 19 | 5 | 5 | 4 | 0 | 0 |
| *The overall nonresponse rate was 26%. Write-in formulations included injectables and organic products. | ||||||
Dairy producers were asked what type of product they used for premises treatment (n = 56). In this question, premises included grounds, buildings, hutches, and manure. Seventy percent of responding producers indicated they used spray formulations on their premises. Second most commonly used was scatter bait (46%). A few respondents used automatic misters/puffers (11%). The nonresponse rate was 27%.
Use of Non-Chemical Fly Control Methods
To determine the overall pest management strategies on Washington dairies, producers were also asked about non-chemical fly control methods, such as sticky traps and wasp parasites. Presumably organic dairies would rely more on cultural, physical, or mechanical, and biological control methods to combat fly populations. However, response data were sparse for non-conventional dairies as only 59% of them provided answers to this query (82% of conventional dairies responded) (Table 7). Manure management was the most commonly selected non-chemical fly control for all responding dairies; general sanitation, cleaning feed alleys daily, and using sticky traps to catch adult flies followed. Many producers reported use of physical control methods, with 46% selecting fans and 36% ventilation. Using hydrated lime in bedding was reported by 27% of responding dairies. Nearly 19% of responding dairies reported using wasp parasites. Use of baited fly traps, electronic bug killers, and netting/screening were also reported.
|
Conventional dairy producers reporting use n = 49 |
Nonconventional dairy producers reporting use n = 10 |
||||
| Practice |
Number of responses |
% of respondents |
Number of responses |
% of respondents |
Total uses reported |
| Manure management | 38 | 78 | 8 | 80 | 46 |
| General sanitation | 32 | 65 | 6 | 60 | 38 |
| Fly ribbons, sticky traps | 28 | 57 | 8 | 80 | 36 |
| Clean feed alleys daily | 28 | 57 | 6 | 60 | 34 |
| Barn fans | 24 | 49 | 3 | 30 | 27 |
| Ventilation | 18 | 37 | 3 | 30 | 21 |
| Hydrated lime | 14 | 29 | 2 | 20 | 16 |
| Wasp parasites | 9 | 18 | 2 | 20 | 11 |
| Baited fly traps | 7 | 14 | 3 | 30 | 10 |
| Electronic bug killers | 4 | 8 | 0 | 0 | 4 |
| Netting/screening | 2 | 4 | 1 | 10 | 3 |
Annual Cost of Treatment
Nearly half of respondents (46%) reported that they spent <$5 per head annually on treatment for fly pests and parasites (Table 8). Twenty-four percent spent up to $10 a head on external pest/parasite control; 21% reported no cost for on-animal treatment. With regard to premises treatment for fly control, 46% spent between $100 and $500, and another 36% spent over $500 (Table 8). Only 16% of responding dairies indicated they spent nothing on premises treatment.
| External Pests/Parasites* | Premises Treatments* | ||||
| Cost/head ($) |
% respondents n = 63 |
Cost of fly control ($) |
% respondents n = 69 |
||
| 0 | 21 | 0 | 16 | ||
| <5 | 46 | 50 | 1 | ||
| 5 to 10 | 24 | 100 to 500 | 46 | ||
| 10 to 15 | 3 | 500 to 1,000 | 13 | ||
| > 15 | 6 | > 1,000 | 23 | ||
| *Nonresponse rate for external pests/parasites was 18% and for premises treatments, 10%. | |||||
Information Sources
When asked how they currently obtain pest control knowledge, 71% of producers indicated personal experience (Table 9). The second most commonly chosen information source was veterinarian (49%), followed by other dairy producers (31%), chemical company representatives (25%), and private consultants (14%). Less important information sources were university handbooks, researchers, and Extension. Other sources of information written in included periodical publications (Table 9).
| Information source |
% with response* n = 72 |
Other information sources cited by producers |
| Personal experience | 71 |
Periodical publications Dairy journals Internet Salesman, parasite salesman Trade show Route truck driver |
| Veterinarian | 49 | |
| Other producers | 31 | |
| Chemical company representative | 25 | |
| Private consultant | 14 | |
| University handbooks | 4 | |
| University researchers | 1 | |
| University Extension | 1 | |
| *Nonresponse rate was 6%. | ||
Conclusions and Implications
Our survey of pest management practices of Washington dairies represents the first of its kind in the Pacific Northwest United States. When results from the 2012 survey are compared to the 1997 New York dairy survey results (Harrington et al., 1997), it is evident that fly and external parasite problems continue to be economically important on U.S. dairies, despite regular and frequent employment of chemical (mostly pyrethroid insecticides) and non-chemical management strategies. A comparison of data from both surveys suggests that use of non-chemical options to manage fly pests has become more widespread over 15 years. In the 2012 survey, greater percentages of respondents reported use of practices such as general sanitation, cleaning feed alleys, using fans and ventilation, using beneficial wasp parasites, and using lime in bedding. When asked about pest management information sources, dairy producers responded similarly in both surveys, with personal experience ranking first, followed by veterinarian's advice (although recommendation by a farm supply dealer ranked as important as a veterinarian in the 1997 survey).
Advice from Extension was ranked very low in both surveys, indicating that Extension professionals could improve outreach education to dairies by partnering with farm supply stores, veterinarians, and feed distributors. These survey data were used to guide recruitment of dairies for IPM demonstration trials in 2014 and will be used to inform development of educational materials for dairy industry stakeholders to increase adoption of integrated strategies for fly and external parasite management.
Acknowledgements
The authors thank all the dairy producers for their responses. The study was funded by the CDC/NIOSH Cooperative Agreement number 5 U54 OH07544-12 through a sub-contract grant with the University of Washington's PNASH Center.
References
Bitsch, V. (2009). 2008 Michigan dairy industry survey. Agricultural Economics Report No. 637. Michigan State University. Retrieved from: https://www.msu.edu/~mdr/08survey.pdf
Ferguson, H., Coates, S. O., Walsh, D., & Linton, A. (2006). Survey to assess parasite and fly control methods utilized by Washington beef cattle producers. Washington State University Extension Bulletin EB2017E. Retrieved from: http://ipm.wsu.edu/livestock/CattleSurveyEB.pdf
Geden, C. J., Rutz, D. A., & Pitts, C. W. (2010). Pest management recommendations for dairy cattle. Cornell and Penn State Cooperative Extension. Publication Web code #XF0275. Retrieved from: http://pubs.cas.psu.edu/FreePubs/PDFs/XF0275.pdf
Harrington, E. P., Weingart, D. B., Kaufman, P., Waldron, J. K., Smith, W. G., & Rutz, D. A. (1997). Pest and pesticide use assessment and personal protective equipment use for dairy cattle production systems in New York State for 1997. Pesticide Management Education Program, Cornell University. Retrieved from: http://pmep.cce.cornell.edu/piap/dairycattle97/index.html
Jonsson, N. N., Mayer, D. G., Matschoss, A. L., & Green, P. E. (1998). Production effects of cattle tick (Boophilus microplus) infestation of high yielding dairy cows. Veterinary Parasitology 78: 65-77. Retrieved from: http://www.sciencedirect.com/science/article/pii/S0304401798001186
Leonardi, C., Moreira, V. R., Bardwell, R. D., McCormick, M. E., Autin, M., Jr., Perez, B., & Martinez, M. C. (2011). An assessment of current feeding practices in Louisiana dairy farms. Journal of Extension [On-line], 49(6) Article 6RIB9. Available at: http://www.joe.org/joe/2011december/rb9.php
Neibergs, J. S., & Brady, M. (2013). 2011 economic contribution analysis of Washington dairy famrs and dairy processing: An input-output analysis. Washington State University Extension. Farm Business Management Report. Retrieved from: http://www.wadairyfederation.org/wp-content/uploads/2012/03/2013-Updated-Dairy-Economic-Impact.pdf
Panger, M., & Hetrick, J. (2013). Risks of cyfluthrin and beta-cyfluthrin use to federally threatened Bay Checkerspot Butterfly (Euphydryas editha bayensis), Valley Elderberry Longhorn Beetle (Desmocerus californicus dimorphus), California Tiger Salamander (Ambystoma californiense), Central California Distinct Population Segment, and Delta Smelt (Hypomesus transpacificus), and the federally endangered California Clapper Rail (Rallus longirostris obsoletus), California Freshwater Shrimp (Syncaris pacificus), California Tiger Salamander (Ambystoma californiense) Sonoma County Distinct Population Segment and Santa Barbara County Distinct Population Segment, San Francisco Garter Snake (Thamnophis sirtalis tetrataenia), and Tidewater Goby (Eucyclogobius newberryi). Environmental Fate and Effects Division, Office of Pesticide Programs, US Environmental Protection Agency. Washington, DC. Retrieved from: http://www.epa.gov/oppfead1/endanger/litstatus/effects/redleg-frog/2013/cyfluthrin/assessment.pdf
Price, C., Carpenter-Boggs, L., & Goldberger, J. (2009). On-farm mortality composting in Washington State: Outreach and producer survey. Journal of Extension [On-line], 47(6) Article 6RIB8. Available at: http://www.joe.org/joe/2009december/rb8.php
United States Department of Agriculture, National Agricultural Statistics Service. (2007a). Agricultural chemical usage: 2006 dairy cattle and dairy facilities summary. Retrieved from: http://usda01.library.cornell.edu/usda/current/AgriChemUsDairy/AgriChemUsDairy-05-23-2007.pdf
United States Department of Agriculture, National Agricultural Statistics Service. (2007b). Washington cattle and calves – inventory and Sales: 2007 and 2002. 2007 Census of Agriculture – County Data. Retrieved from: http://www.agcensus.usda.gov/Publications/2007/Full_Report/Volume_1,_Chapter_2_County_Level/Washington/