December 2014
|
December 2014 // Volume 52 // Number 6 // Tools of the Trade // v52-6tt8


Assessing Irrigation Water Quality for pH, Salts, & Alkalinity
Abstract
Proper irrigation management is increasingly critical as demand and competition for high quality, potable water grows. Coupled with identifying all potential stressors, accurate interpretation of water quality reports is essential to irrigation managers because management practices affect both soil and plant health. The complex nature of information given in water quality reports makes interpretation and selection and implementation of appropriate management options difficult for many stakeholders. Therefore, an easy-to-follow flow chart was developed for use by Extension agents to aid in consultations with stakeholders' about their water quality reports.
Introduction: Irrigation Water Quality and Agriculture
Agriculture, nursery, and turfgrass managers depend on an adequate supply of water for irrigation. With increasing demand for potable water, irrigation managers are turning to alternative, poorer quality sources of water (e.g., recycled runoff, saline groundwater, reclaimed water) for irrigation purposes (Jimenez, 2006). Poor quality irrigation water poses many hazards to plant production if not managed properly.
Due to increasing use of poor quality water for irrigation, simple tools are needed to help Extension agents and stakeholders make appropriate irrigation management decisions.
The Water Quality Flow Chart
The water quality flow chart (WQFC, Figure 1) can assist plant managers in making irrigation management decisions. It should not be the sole reference used to determine water source suitability. Other stress factors to consider along with the WQFC include:
- Geographic region (arid, temperate)
- Salinity tolerance of the plant(s) grown
- Weather conditions (temperature, rainfall, evapotranspiration)
- Soil texture, use, and intensity of management
Identifying stress factors is especially important for arid regions where salts can build up in soils rather quickly.
Southwestern USA Example (Sevostianova, Leinauer, Sallenave, Karcher, & Maier, 2011a, 2011b):
- Maintenance of warm and cool-season grasses
- Three water sources, categorized "no problem" by WQFC
- Warm-season turfgrasses—no problem
- Cool-season grasses- —salinity induced stress/death
Although beneficial in terms of water conservation, the use of poorer quality water for irrigation without proper management can cause soil structure issues and plant growth and quality problems. The information available about irrigation water quality is very technical (Grattan, 2002; Hopkins, Horneck, Stevens, Ellsworth, & Sullivan, 2007), and stakeholders have difficulty identifying proper management strategies (Bailey, Bilderback, & Birr, 1999).
Water quality reports typically include values for pH, total dissolved salts (TDS), electrical conductivity (EC), sodium absorption ratio (SAR), adjusted residual sodium (adj RNa), bicarbonate/carbonates, and/or residual sodium carbonate (RSC). These parameters interact in a complex manner, influencing plant growth and soil structure.
To simplify irrigation quality assessment, the WQFC (Figure 1) accounts for pH, salts, and alkalinity concurrently. This tool will help Extension agents understand water quality reports and the associated irrigation management issues (IMIs, Table 1), and, with knowledge of other stressors present, offer management options (MOs, Table 2) to stakeholders.
| IMI | Description | MO1 |
| 1 | Applying irrigation water with pH <5.5 may result in damage to sensitive plants, and young roots and leaves | 1, 2, 3 |
| 2 | Pure water: Not enough Ca and Mg ions are present to aggregate the soil. Soils disperse, easily compact, resulting in limited water and air movement, and root growth. | 1, 2, 4, 5 note 12 |
| 3 | Pure water with Na: Inadequate Ca and Mg ions present to aggregate the soil. In addition, the minimal Na ions present occupy binding sites in the soil (CEC). Soils disperse, easily compact, resulting in limited water and air movement, and root growth. | 1, 2, 4, 5 note 1 |
| 4 | Ion toxicities may exist; evaluate plant salinity tolerance. | 11 |
| 5 | Increasing permeability problem. Monitor water quarterly to make sure that there are no changes. | 3 |
| 6 | Inadequate Ca and Mg ions present to counter Na ions. Soils disperse, compact easily, and limit water and air, and root growth, ion toxicity likely. | 3, 4, 5, 6, 8, 9 note 1 |
| 7 | Optimal pH range for plant nutrient availability is 5.5 – 6.5. Some pesticides are susceptible to alkaline hydrolysis as pH increases above 7.0. | 1 |
| 8 | Elevated HCO3- and CO32- (AKA as high alkalinity) may increase the buffering capacity (ease of changing pH) of your soil over time. Alkaline hydrolysis, the degradation rate (half-life) of some pesticides when the pH > 7.0, may increase in the presence of HCO3- and CO32-. | 1, 2, 4, 7 |
| 9 | HCO3- and CO32- quickly complex with Ca and Mg to form a precipitate. Inadequate amount of Ca and Mg available to complex with HCO3- and CO32-, aggregate the soil, and be available for plant uptake. In finer textured soils, if Na is present, it will dominate the CEC and Na issues may persist (IMI 5). In addition, sandy soils may become clogged (AKA sealing). | 1, 2, 4, 5, 7, 8, 9, 10 note 1 |
| 10 | Biological activity can cause daily and seasonal pH fluctuation is in surface water bodies. | 1 |
| 1 MO = Management option which are described in detail in Table 2. 2 Note 1 - More problematic in finer textured soils, soils with appreciable organic matter, and soils with moderate to high CEC. | ||
| MO | Description |
| 1 | Invest in pH meter or litmus paper to monitor pH. Monitor and log pH over the day and seasons to identify any patterns in pH shifts. Schedule irrigation events and pesticide applications when water pH is most ideal and or treat water accordingly. |
| 2 | Apply base forming fertilizers such as calcium nitrate to raise pH, and acid forming fertilizers such as urea to lower pH. |
| 3 | Submit soil sample for testing and evaluate results. |
| 4 | Encourage good water movement by enhancing existing drainage, and if necessary break-up the surface layer. |
| 5 | Increase Ca and or Mg by applying gypsum (if pH > 7.0), lime (if pH < 6.0), or some other source, either by land application or through an injection system. Application via injection system with each irrigation event is preferred. |
| 6 | Applying an acid can remove Na and lower pH. Where soil already has Ca present (calcareous soils, CaCO3), applying acid can release Ca to exchange with Na on exchange sites. Application with each irrigation event is preferred. |
| 7 | Monitor HCO3- and CO32- using a pool alkalinity test kit or by submitting a water sample for analysis. Submit soil sample for testing to assess the buffering capacity of the soil. |
| 8 | Applying an acid will dissolve the CO32- and HCO3- complexes formed with Ca and Mg; the released Ca and Mg displace Na. Applying an acid can also remove Na, and lower pH. Application with each irrigation event is preferred. |
| 9 | Investigate if alternative water source is available for irrigation use or to blend with current water source. |
| 10 |
Apply specific volume of irrigation water to leach excess salts from the soil profile.
|
| 11 | Plant tolerance to presence of excess salts and individual ions vary. Consider selecting species/cultivars tolerant of salinity to minimize potential for crop losses. |
Figure 1.
Water Quality Flow Chart For pH, Salts, and Alkalinity y
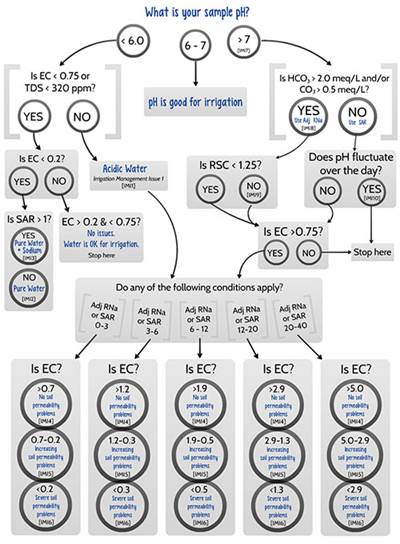
The following brief overview of water quality parameters and potential irrigation management issues addressed in the WQFC could be given to stakeholders to help evaluate their water quality and irrigation management.
Water Quality Parameters
The term "water quality" describes the physical, chemical, and biological components of water and has been extensively examined and reported for drinking water (Chapman, 1996; Walker & Moore, 2003). Irrigation water quality may impact the health and productivity of plants, soils, and the surrounding ecosystems receiving drainage water (Sanchez & Silvertooth, 1996). Reclaimed irrigation water may have higher salt content than municipal, potable water sources (Devitt, Morris, Baghzouz, & Lockett, 2005). Poor quality irrigation water can also reduce pesticide efficacy and alter the physical structure of soils (Sanchez & Silvertooth, 1996).
Monitor irrigation water quality throughout the growing season and over time (years), and adjust management actions (e.g., fertilization, soil amendment, drainage development, and irrigation volume) to maximize plant health while protecting natural resources (Lockett, Devitt, & Morris, 2008).
pH
- Measure of acidity (H+) and alkalinity (OH-) in solution, ranges from 0-14
- 7 = neutral (H+ ions = OH- ions)
- >7 = alkaline
- <7 = acidic
- Influences soil pH and nutrient availability
- Reliable indicator of other water quality issues
- Plant and soil management problems (Duncan, Carrow, & Huck, 2009)
- Damaged irrigation equipment (Devitt, Morris, Baghzouz, & Lockett, 2005)
- Reduced pesticide efficacy (Duncan, Carrow, & Huck, 2009)
Salinity
- Measure of the soluble salts content in a water source, reported as:
- Lab - Total dissolved salts (TDS; expressed in ppm or mg/L)
- Field - Electrical conductivity (EC; expressed in dS/m or mmhos/cm)
- Highly saline irrigation water:
- Reduces seed germination, rooting, growth, establishment, and fruiting of plants (Hillel, 2000)
- Lowers the osmotic potential of the soil solution, reducing plant available water (Duncan, Carrow, & Huck, 2009)
SAR
- Assesses the sodium (Na) status and permeability hazard of irrigation water
- Relationship between soluble Na and soluble calcium (Ca) and magnesium (Mg) used to predict the exchangeable Na fraction of soil equilibrated with a given solution (Leinauer & Devitt, 2013)
- Elevated SAR values in irrigation water applied to clay soils can cause:
- Dispersion of soil colloids
- Reduced infiltration and hydraulic conductivity
adj RNa
- Better estimate than SAR of potential irrigation management issues when:
- bicarbonate concentrations ≥ 120 ppm
- bicarbonate-rich water applied to alkaline soils
- Does not require any additional analysis – uses commonly reported parameters
Bicarbonates
- Produced by dissolving carbon dioxide in water
- Expressed as ppm or meq/L
- High levels of bicarbonates in irrigation water can:
- Cause unsightly foliar deposits on leaf tissue
- Precipitate salts
- Clog drip emitters and soil pores
- Form complexes with Mg and Ca – reducing Ca and Mg for plant uptake and colloidal dispersion (Leinauer & Devitt, 2013)
- Increase soil pH if the buffering capacity of the soil (resistance to pH change) is low
Residual Sodium Carbonate
- Determines if excess Ca and Mg in irrigation water after Ca and Mg ions precipitate with carbonates
- Expressed as meq/L
- Useful when determining
- Irrigation water management
- Soil amendment needs
Conclusions
Successful management of production systems (agriculture, turfgrass, nursery, landscape) irrigated with poor quality water can only be achieved by understanding potential stressors and accounting for their impacts in determining production inputs (nutrients, soil amendments, cultivation, and irrigation).
By following the WQFC, one can determine potential IMIs and MOs; however, stressor addition can create an issue even if the WQFC indicates no issues. Of all potential stressors, irrigation water quality is commonly the most difficult for stakeholders to understand and manage.
This irrigation WQFC is a tool that will make help Extension agents interpret water quality reports and advise stakeholders about appropriate management options when other potential plant growth stressors are considered
Acknowledgements
The authors greatly appreciate the through reviews from Dr. Bernd Leinauer and Dr. Raul Cabrera.
References
Bailey, D., Bilderback, T., & Birr, D. (1999). Water considerations for container production of plants. North Carolina State University – Horticulture Information Leaflet. HIL #557.
Chapman, D. (1996). Water quality assessments - A guide to use of biota, sediments and water in environmental monitoring. 2nd ed. UNESCO/WHO/UNEP by E&FN Spon. London.
Devitt, D. A., Morris, R. L., Baghzouz, M., & Lockett, M. (2005). Water quality changes in golf course irrigation ponds transitioning to reuse water. HortScience. 40, 2151-2156.
Duncan, R. R., Carrow, R. N., & Huck, M. T. (2009). Turfgrass and landscape irrigation water quality: Assessment and management. CRC Press. Taylor & Francis Group. Boca Raton, FL.
Grattan, S. R. (2002). Irrigation water salinity and crop production. University of California, Agriculture and Natural Resources. Publication 8066.
Hillel, D. (2000). Salinity management for sustainable irrigation: Integrating science, environment, and economics. The International Bank for Reconstruction and Development/The World Bank. http://dx.doi.org/10.1596/0-8213-4773-X.
Hopkins, B. G., Horneck, D. A., Stevens, R. G., Ellsworth, J. W., & Sullivan, D. M. (2007). Managing irrigation water quality for crop production in the Pacific Northwest. Pacific Northwest Extension Publication. PNW 597-E.
Jimenez, B. (2006). Irrigation in developing countries using wastewater. International Review for Environmental Strategies. 6(2), 229-250.
Leinauer, B., & Devitt, D. A. (2013). Irrigation science and technology In: Turfgrass: biology, use, and management. Agronomy Monograph No. 56. Eds. J.C. Stier, B.P. Horgan, and S.A. Bonos. ASA-SSSA-CSSSA. Madison, WI.
Lockett, A. M., Devitt, D. A., & Morris, R. L. (2008). Impact of reuse water on golf courses and turfgrass parameters monitored over a 4.5 year period. HortScience. 43, 2210-2218.
Sanchez, C. A., & Silvertooth, J. C. (1996). Managing saline and sodic soils for producing horticultural crops. HortTechnology. 6(2), 99-107.
Sevostianova, E., Leinauer, B., Sallenave, R., Karcher, D., & Maier, B. (2011a). Soil salinity and quality of sprinkler and drip irrigated cool-season turfgrasses. Agronomy Journal. 103:1503–1513. doi:10.2134/agronj2011.0162
Sevostianova, E., Leinauer, B., Sallenave, R., Karcher, D., & Maier, B. (2011b). Soil salinity and quality of sprinkler and drip irrigated warm-season turfgrasses. Agronomy Journal. 103:1773–1784. doi:10.2134/agronj2011.0163
Walker, M., & Moore, R. (2003). A Web site for interpreting drinking water quality analyes. Journal of Extension [On-line], 41(1) Article 1TOT3. Available at: http://www.joe.org/joe/2003february/tt3.php