October 2013
|
October 2013 // Volume 51 // Number 5 // Feature // v51-5a10


Bringing the DuPont Profitability Model to Extension
Abstract
This article discusses a financial training program used by Deere and Company for almost 10 years. The objective is to describe the program and to discuss a pre-test/post-test methodology to test the effectiveness of a program for possible duplication by Extension. Results show that participants significantly improved from the pre-test to the post-test regardless of participants' demographics, which is critical to stakeholders to maintain funding. However, from an application standpoint there was still room for improvement. The article discusses several ways for Extension agents to overcome this.
Introduction
Throughout their long history, Extension education programs have proven to be a useful tool for owners and employees of food and ag companies. Over 100 years ago, the United States Congress formed the Extension System with the explicit purpose of improving production practices in agriculture (USDA, 2011). Today, the role of Extension goes beyond production and also focuses on marketing and financial assistance (Hostetler, 2007) and training (Balliet, Douglass, & Hanson, 2010; Barnard, 2003). In addition, Extension services increasingly are asked to test the effectiveness of their programs to ensure that programs are delivering a value to participants that justifies the cost (Diem, 2003; Nielsen, 2011). Roucan-Kane and Suttle (2009) discussed in detail the writing, purpose, timing, and types of evaluations that can be used by Extension agents.
The goal of the research reported here was to determine participants' increase in financial knowledge as a result of a financial training event based on the DuPont Profitability Linkage model (commonly called the DuPont model). This article has two primary purposes for use in Extension: (a) presenting the details of a program and (b) discussing and providing an evaluation method to test the effectiveness of the training.
Balliet, Douglass, and Hanson (2010) discussed the Farm Financial Analysis Training (FFAT) and tested its effectiveness using participants' self-assessed perceived gain in knowledge. Barnard (2003) discussed a computer simulation game used in Extension to teach financial practices such as cash flow budgeting, breakeven analysis, and profitability analysis with the DuPont model. Hanson, Parsons, Musser, and Power (1998) evaluated a financial management outreach program through the use of a survey. The survey asked participants the average value of the impact of the workshop tools to their farm budgeting and planning. This question allowed the authors to calculate a dollar value for the program.
The article is organized as follows. The first section presents the DuPont model and its importance. The second and third sections discuss the financial educational program and the training's evaluation method: pre- and post-tests. Finally, the fourth and fifth sections discuss the results of the evaluation, draw conclusions, and identify implications for Extension.
The Use of the DuPont Model for Companies to Succeed
Poor financial practices rank among the top reasons for business failure (Liesz, 2002). In addition, Hostetler (2003, p. 1) noted, "producers are often looking for ways to increase their profitability." The DuPont model is a relatively simple tool to evaluate business performance as well as identify strategies for improvement. Extension has an important role in bringing techniques such as DuPont analysis to help businesses evaluate their performance and find ways to improve it. DuPont analysis is not just for large corporations; from farms and ranches on up, financial statements can tell a manager what is going on in the business and where limited management time should be used.
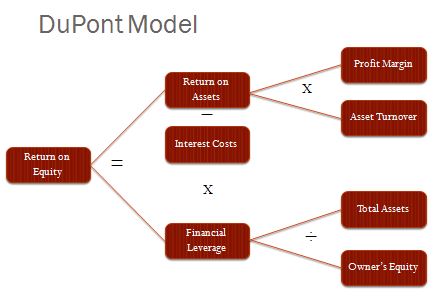
The DuPont model is a well-known method for using information from common financial statements to analyze a business' health and see how the different components affect the profitability of a firm (Figure 1). The model has been used with food and agribusiness companies by many authors (e.g., Gardner, McGowan, & Moeller, 2011; Little, Little, & Coffee, 2009; Shadbolt, 2011). The model assesses the financial performance of a company by using numbers from the balance sheet and income statement. It also identifies the factors that most influence the company's financial results. Extension training programs focusing on the DuPont model should emphasize the three main factors that impact the profitability of a company.
Margin or Return on Sales or "Earns"
This refers to the firm's ability to control margins through increases in revenues or decreases in costs. The higher the margins, the better. To increase revenues, marketers can increase prices or number of units sold. The latter is usually recommended, especially for goods with elastic demand. To increase sales while holding prices constant, companies can expand store hours, better target customer segments, and improve products to better fit the needs of the target market. Costs can be decreased by the operations manager through improving production efficiency (e.g., investments in new machines, more efficient production methods), reaching more economies of scale, ordering less expensive supplies and obtaining suppliers' discounts, switching from a printed catalog to a website, outsourcing some tasks, etc. It is generally easier to reduce expenses than to increase sales (Liesz, 2002).
Asset Turnover or "Turns"
This measures the firm's efficiency at using its assets to generate revenue—the higher the asset turnover, the better. Assets encompass both current and non-current (also called fixed) assets. For fixed assets, less expensive equipment can potentially be used to replace more expensive units and thus improve asset turns. While improving the turnover of fixed assets (such as land, building, equipment) may be a long-term goal, in the short term companies can improve the turnover of current assets. Typically, current assets are used up in the business or converted into cash within a year and include cash on hand, accounts receivables, and inventories.
Improving asset turnover through accounts receivables is achieved by having customers pay their bills faster. While good credit terms can attract customers, a marketing manager can still lower accounts receivables by offering discounts for payments in cash, encouraging early payments, or discourage sales to delinquent customers. Improving asset turnover through inventories can be accomplished by minimizing inventory while avoiding stock-outs. Holding inventory is expensive because cash is tied up and storage facilities are required. Inventory must be counted, guarded, and managed, all of which increases costs. Stock-outs mean missed sales and potentially lost customers, which is also expensive. The key for the manager is to get to the optimal inventory level through good forecasting of future demand, good management of current inventory and sales, and excellent communication with suppliers to get fast replenishment. Given that different products have different demands, a unique inventory strategy for each product may be needed.
Financial Leverage or "Leverage"
This represents the degree to which the company uses borrowed money. As firms increase their amount of debt, leverage increases. The key with leverage is to use the cheapest form of financing. Usually debt (i.e., taking on a loan) is less expensive than financing with owners' equity, although it can reduce a firm's liquidity. If a business can earn a higher return from the assets purchased with debt funds (higher ROA) than the interest rate on those funds, this "spread" increases its return on equity capital (ROE). However, because of the fixed nature of principal and interest payments on debt obligations, financial risk increases rapidly with increased leverage, resulting in the necessity to evaluate the benefit-cost ratio of adding additional debt to the capital structure of a business.
Figure 1.
The DuPont Profitability Linkage Model
The Training Program
In early 2000, Deere and Company tasked Purdue University with the development of a financial training program for their territory managers. Deere and Company is a global corporation that reported fiscal 2012 income of over $3 billion on net sales and revenues of $36 billion. Deere and Company manufactures, sells, distributes, and delivers a full line of agricultural equipment and a variety of commercial, consumer, and landscapes equipment and products to a broad range of customers (Deere and Company, 2013).
The Center for Food and Agricultural Business at Purdue University developed a 2 1/2- day workshop for territory managers to develop their ability to translate the quantitative aspects of financial analysis into recommendations to dealers. "Territory managers" are the link between Deere Corporate and the independent equipment dealers to respond to questions, provide information on new product/service offerings, and in general assist the dealer in assessing and improving the effectiveness and efficiency of his/her business. One focus of this assistance is benchmarking and assessing the financial performance of the business. The program is designed to teach key financial ratios and their linkages using the DuPont model. A case study of a John Deere dealer is used throughout the program to apply the concepts. The program discussed below can be used by Extension agents teaching the DuPont model.
It is important to note that although this article discusses a teaching framework specific to a small audience consisting of major input suppliers' territory managers, the same framework and same testing method can be easily adapted to any audience. In addition, case studies are extremely useful in helping participants understand and apply the concepts without having to share their personal financial information. A case study adapted to the audience can therefore be written by Extension agents to increase participants' understanding. An alternative would be to use the short case study from Barnard and Boehlje (2004) or the simulation game discussed by Barnard (2003).
At the beginning of the program, the participants review financial statements (balance sheet and income statement) and the links between them. They learn how to "think like a CFO" by learning about the five key financial performance areas CFOs think about: profitability, capital structure and debt service, size and growth, risk and financial documentation, and creating shareholder value. A discussion of financial analysis and benchmarking is then proposed through a presentation of ratios (profitability, asset utilization, capitalization, and debt service) and sustainable growth rate. The last instructor presentation provides information on financial diagnostics and ties together the topics presented earlier by introducing the DuPont model and the cash conversion cycle.
These lectures are followed by a much appreciated discussion with the John Deere dealer featured in the case study. To help develop confidence, participants—in groups of five—then create a presentation containing an analysis and recommendations to the dealership featured in the case study. For most participants, this presentation is followed by another one, a few months later, to their boss about a dealer in their territory. This program has been given to John Deere territory managers since 2004. The program has been found to be so successful by Deere and Company that it continues to be offered every year.
Data and Methodology
In addition to participants' evaluations, the training was tested using pre-tests and post-tests conducted between 2005 and 2009 over seven sessions. Melvin, Boehlje, Dobbins, and Gray (2004) used the same pre-test and post-test to quantify the effectiveness of a computer software program with farm producers. This methodology can be used by Extension agents to gather data to demonstrate to stakeholders the impact of a program. Each participant was given a pre-test at the beginning of the program and a post-test at the end of the program. Both tests had the same questions organized in a different order.
The questions are organized in three areas of learning. The calculation based questions relate to the computations/calculations that take place in the DuPont model (questions 1, 2, and 10 in Appendix 1). The conceptual based questions relate to the meaning of the terminology behind the DuPont model (questions 3, 4, and 9 in Appendix 1). The application based questions test whether the respondent understands the strategies companies should take to improve profitability (questions 5, 6, 7, and 8 in Appendix 1).
Results
This section shows how Extension agents can analyze and report the results to stakeholders using the statistical software IBM SPSS Statistics 20. This section also allows Extension agents to compare their numbers to the ones here. The tests were taken by 195 participants; selected demographics are presented in Figures 2 and 3. Not answering a question was treated as a wrong answer.
Figure 2.
Respondents' Education Level
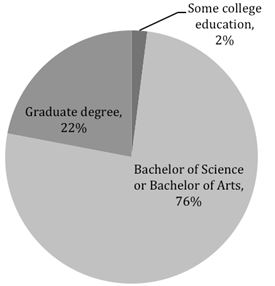
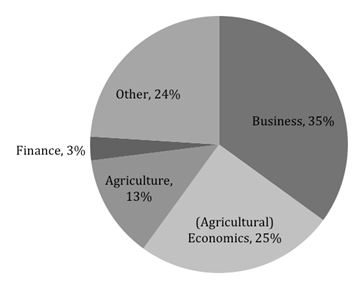
Figure 3.
Respondents' College Major
As indicated by a paired sample t-test, the average post-test score was statistically higher (Table 1). Participants' self-assessment of financial knowledge also increased from 2.76 to 3.56 (of 5). For all areas of learning—calculation, conceptual, and application—scores were statistically significantly higher with the post-test. However, less than half of the respondents increased their scores for the calculation and conceptual questions. The pre-test average scores for the conceptual questions were high at 2.48 out of 3, which limits the opportunities for improvement. Additionally, the workshop participants are not the ones responsible for calculating the ratios and populating the DuPont model. The most important aspect of the program is for participants to be able to apply the financial concepts and give recommendations to John Deere dealers. The program was therefore successful, given that 71% of the respondents increased their scores for the application questions.
However, there is still room for improvement. While the calculation and conceptual scores are based on three questions, there were four application questions. Therefore, the participants proportionally are still not doing as well on the application questions as on the other questions. Perhaps the use of a case study with a computer simulation component (e.g., Barnard, 2003) could help Extension agents further improve participants' learning from an application standpoint.
| Description | Overalla | Calculationb | Conceptualc | Applicationd | Self-Assessmente | |||||
| Pre-test | Post-test | Pre-test | Post-test | Pre-test | Post-test | Pre-test | Post-test | Pre-test | Post-test | Average | 5.67 | 6.57 | 1.98 | 2.21 | 2.48 | 2.67 | 1.21 | 2.34 | 2.76 | 3.56 |
| Std. Dev. | 1.61 | 1.48 | .78 | .77 | .78 | .54 | .9 | 1.06 | .72 | .57 |
| Minimum | 1 | 2 | 0 | 0 | 0 | 0 | 0 | 0 | 1 | 2 |
| Maximum | 9 | 10 | 3 | 3 | 3 | 3 | 4 | 4 | 5 | 5 |
| Increases | 117** | 76** | 55** | 138** | 114** | |||||
|
Note. N=195, except for Self-Assessment, which was introduced after two sessions, and is based on 153 respondents. Results of statistical tests are a paired samples t-test for differences in the number of increases. a Based on 10 questions. b Based on 3 questions. c Based on 3 questions. d Based on 4 questions. e based on 10 questions. ** p < .01. |
||||||||||
Focusing on each question individually provides some additional information. Extension agents can use Tables 2 through 4 to benchmark further their results and determine how to adapt their training. The statistical significance for the difference was tested with a t-test. On average, the scores decreased for question 1 significantly at the 99% confidence level, indicating that participants are still not clear on what goes on the DuPont model. To help with this, Extension agents should provide participants with a laminated copy of the DuPont model to take home for easy referral. The question with the greatest average increase in score was question 10, followed by questions 5, 6, 3, and 8. On those questions, the differences are all significant at the 99% confidence level except for question 8, which was significant at the 95% confidence level. Questions 2, 4, 7, and 9 do not present significant differences between the pre-test and the post-test. Questions 4 and 9 are both conceptual questions where the scores in the pre-test were already high, limiting the potential for improvement. The lack of improvement on question 2 and 4 may also suggest the need to alter the teaching method or increase the amount of emphasis placed on those questions in the lectures (Rockwell & Kohn, 1989).
| Description | Question 1 | Question 2 | Question 10 | |||
| Pre-test | Post-test | Pre-test | Post-test | Pre-test | Post-test | |
| Average | 0.86 | 0.75 | 0.68 | 0.73 | 0.45 | 0.73 |
| Std. Dev. | 0.03 | 0.03 | 0.47 | 0.44 | 0.50 | 0.45 |
| Increases | 9.7%** | 23.1% | 34.9%** | |||
|
Note. N=195, except for Self-Assessment, which was introduced after two sessions, and is based on 153 respondents. Results of statistical tests are a paired samples t-test for differences in the number of increases. ** p < .01. |
||||||
| Description | Question 3 | Question 4 | Question 9 | |||
| Pre-test | Post-test | Pre-test | Post-test | Pre-test | Post-test | Average | 0.80 | 0.94 | 0.85 | 0.88 | 0.83 | 0.85 |
| Std. Dev. | 0.40 | 0.23 | 0.36 | 0.33 | 0.38 | 0.36 |
| Increases | 18.5%** | 12.8% | 12.8% | |||
|
Note. N=195, except for Self-Assessment, which was introduced after two sessions, and is based on 153 respondents. Results of statistical tests are a paired samples t-test for differences in the number of increases. ** p < .01. |
||||||
| Description | Question 5 | Question 6 | Question 7 | Question 8 | ||||
| Pre-test | Post-test | Pre-test | Post-test | Pre-test | Post-test | Pre-test | Post-test | |
| Average | 0.26 | 0.48 | 0.14 | 0.32 | 0.40 | 0.38 | 0.42 | 0.52 |
| Std. Dev. | 0.44 | 0.50 | 0.35 | 0.47 | 0.49 | 0.49 | 0.49 | 0.50 |
| Increases | 34.4%** | 24.1%** | 13.8% | 25.6%* | ||||
|
Note. N=195, except for Self-Assessment, which was introduced after two sessions, and is based on 153 respondents. Results of statistical tests are a paired samples t-test for differences in the number of increases. ** p < .01, * p<.05. |
||||||||
Analyses of ANOVA tables show that the improvements from pre-test to post-test are significantly greater at the 90% level for later trainings and throughout the years, suggesting that an instructors' learning curve was present and that outreach programs should use the same instructors over time to maximize participants' learning. The data were also analyzed to see if differences existed based on participants' demographics (education, college major, self-assessment of pre- and post-financial knowledge, and position in the company). None of the demographics significantly explained the changes from pre- to post-test, suggesting that the results above can easily be used by Extension agents for comparison. A correlation analysis was performed between the difference in self-assessment of pre- and post-financial knowledge and the difference in score between the pre and post-test. The correlation factor of 0.110 indicated that self-assessment may not be a reliable method for Extension agents to determine the true effectiveness of a training program.
Conclusion and Implications
Poor financial performance is one of the top reasons for business failure. The DuPont Profitability Linkage Model is a simple but powerful tool to assess the financial performance of a company. Extension has an important role in bringing techniques such as DuPont analysis to local ag businesses and, even further, assisting owners in successfully applying such methods to improve their management. Although the subject of this article is teaching the DuPont model to a John Deere audience of territory managers, DuPont analysis is not just for large corporations; from farms and ranches on up, financial statements can tell a manager what is going on in the business and where limited management time should be used.
All managers use some sort of Management by Exception—spending their limited time on the parts of the business that are most pressing and less time on the parts that seem to be running fine. By teaching DuPont analysis, Extension can help business owners and managers identify the parts that will most effectively affect their bottom line. The information is in the company's financial statements and documents, but the right questions must be asked. This article presents a successful training program that can be adapted by Extension agents to teach the DuPont model to diverse audiences with testing that can be used to report quantitatively the effect of the training.
Testing the effectiveness of workshops is becoming more and more critical in Extension to secure funding and improve programs' effectiveness. In this workshop, several methods were used to test such effectiveness and aid in both formative and summative evaluation: pre-test and post-test, evaluation form, and the creation and delivery of PowerPoint presentations by the participants. They can easily be replicated by Extension agents. While other methods are available, these evaluations are easy to do and understand; results can be effectively communicated and are not based on participants' self-assessment but rather on actual results.
The results show that participants' self-assessment of financial knowledge significantly increases from pre-test to post-test. This leads us to believe that their perceived increase in financial knowledge will make them more confident in applying the learning therefore leading to better business decisions. However, it is important to note that participants' self-assessment of financial knowledge was not found to be correlated with the difference in score between the pre- and post-test. This suggests that self-assessment may not be a reliable method for Extension agents to determine the true effectiveness of a training program.
The results also indicated the presence of an instructors' learning curve, implying that outreach programs should use the same instructors over time to maximize participants' learning. In addition, the results are similar to other studies on the subject and indicate that demographics were not significant at explaining differences in scores. Therefore, although this article focuses on a small audience consisting of major input supplier's territory managers, the same framework and same testing method can be easily adapted to any audience to experience the same success.
While the results were extremely encouraging, there is still room for improvement from an application standpoint. First, Extension agents may want to conclude with an interview of a farmer or rancher who has used the DuPont model, highlighting specific actions they have taken as a result of its use. Second, Extension agents could provide a toolkit to participants at the end of the program, with a list of recommendations and actions that can be taken based on common findings from the use of the DuPont model. Finally, the evaluation method used could be improved. The post-test was given to participants immediately at the end of the workshop and may not have allowed them enough time to fully comprehend the concepts. The long-term program effectiveness may therefore be greater than what is discussed here.
The post-test could have been handled in several ways. While the present research used a traditional pre-test post-test methodology, other methods are possible, such as a retrospective pretest-posttest. Nielsen (2011) described that method as a single administration of an instrument at the conclusion of a treatment, which asks respondents to compare their current state with their perception of their pre-treatment state. A post post-test could also be implemented to test the retention of participants over time, but this technique may suffer a low response rate. Given the advantages and drawbacks of each method, Extension agents should determine which evaluation form is best adapted to their needs.
References
Balliet, K. L., Douglass, M. B., & Hanson, G. (2010). Long-term impact of the Farm Financial Analysis Training curriculum on FSA borrowers in Pennsylvania. Journal of Extension [On-line], 48(1) Article 1FEA6. Available at: http://www.joe.org/joe/2010february/a6.php
Barnard, F. L., & Boehlje, M. (2004). Using Farm Financial Standards Council recommendations in the profitability linkage model: The ROA dilemma. Journal of the ASFMRA, 67(1), 7-11. Retrieved from: http://portal.asfmra.org/userfiles/file/journal/barnard7_11.pdf
Barnard, F. L. (2003). Using a computer simulation game to teach agri-business management. Journal of Extension [On-line], 48(1) Article 5TOT7. Available at: http://www.joe.org/joe/2003october/tt7.php
Diem, K. G. (2003). Program development in a political world—It's all about impact! Journal of Extension [On-line], 41(1) Article 1FEA6. Available at: http://www.joe.org/joe/2003february/a6.php
Deere and Company (2013). Deere & Company Annual Report 2012. Retrieved from: http://www.deere.com/en_US/docs/Corporate/investor_relations/pdf/financialdata/reports/2013/ 2012_annual_report.pdf
Gardner, J. C., McGowan, C. B., & Moeller, S. E. (2011). Using accounting information for financial planning and forecasting: An application of the sustainable growth model using Coca-Cola. Journal of Business Case Studies, 7(5), 9-15.
Hanson, G. D., Parsons, R. L., Musser, W., & Power, L. (1998). Impact analysis of farm finance workshops. Journal of Extension [On-line], 36(3) Research in Brief 3RIB2. Available at: http://www.joe.org/joe/1998june/rb2.php
Hostetler, K. M. (2007). Answering the producers' question: Is it feasible? Journal of Extension [On-line], 41(1) Article 6FEA5. Available at: http://www.joe.org/joe/2007december/a5.php
Liesz, T. J. (2002). Really modified DuPont analysis: Five ways to improve Return on Equity. Proceedings of the 2002 SBIDA Conference. Retrieved from: http://www.sbaer.uca.edu/research/sbida/2002/Papers/19.pdf
Little, P. L., Little, B. L., & Coffee, D. (2009). The DuPont model: Evaluating alternative strategies in the retail industry. Academy of Strategic Management Journal, 8, 71-80.
Melvin, J., Boehlje, M., Dobbins, C., & Gray, A. (2004). The DuPont profitability analysis model: An application and evaluation of an e-learning tool. Agricultural Finance Review, 64(1), 75-89.
Nielsen, R. B. (2011). A retrospective pretest-posttest evaluation of a one-time personal finance training. Journal of Extension [On-line], 49(1) Article 1FEA4. Available at: http://www.joe.org/joe/2011february/a4.php
Rockwell, S. K., & Kohn, H. (1989). Post-then-pre evaluation. Journal of Extension [On-line], 27(2) Article 2FEA5. Available at: http://www.joe.org/joe/1989summer/a5.php
Roucan-Kane, M., & Suttles, J. (2009). Guide for program evaluation. Purdue University, Working Paper 09-05. Retrieved from http://ageconsearch.umn.edu/bitstream/48538/2/09-05.pdf
Shadbolt, N. M. (2011, March). Competitive strategy analysis of NZ pastoral farming systems. Proceedings of the 18th International Farm Management Association Congress, Vol. 1, Methven, Canterbury, New Zealand, 122-132. Retrieved from: http://www.ifmaonline.org/pdf/congress/11_Shadbolt_P122-132.pdf
USDA. (2011). Extension. Retrieved from http://www.csrees.usda.gov/qlinks/extension.html
Appendix 1
The Pre-Test Questionnaire
The survey for the pre-test is below. The multiple-choice questions for the post-test were the same but sequenced in a different order. In the post-test, these questions were preceded by a question about the participant job title and their self-assessment of their financial knowledge after the workshop. Note that the stars next to the answer categories of the multiple choice questions indicate the right answers and were not included in the pre-test given to the participants.
PRE-TEST
Personal ID Number: ___
As we begin the program, we need you to provide us with a self-assessment of your knowledge and skills in financial management. This will help you start thinking about the concepts we will be covering during the program.
Before completing the questionnaire, please complete the following information:
Highest level of education: ◊ High School, ◊ Some College, ◊ BS/BA, ◊ Graduate Degree
Area of academics studied (please select only one category): ◊ General or Ag Business, ◊ Agricultural Economics/Economics, ◊ General Ag/Agronomy, ◊ Finance,
◊ Other (please specify): _________________________
Self-assessment of your financial knowledge (1 being poor and 5 being excellent):
1 2 3 4 5
Please circle the answer you believe is correct (there is only one correct answer per question):
- Which of the following financial data items are used in the John Deere profitability model?
- Total assets
- Variable expenses
- Interest expense
- All of the above
- a and b only
- In the John Deere Profitability model, net operating Return on Assets (ROA) can be derived directly from which of the following ratio(s)
- Net operating return on sales
- Financial leverage factor
- Asset turnover ratio
- All of the above
- a and c only*
- Which of the following measures the return the owner of a business receives on his/her invested money?
- Pre-tax return on equity*
- Net operating return on assets
- Operating leverage
- Asset turnover ratio
- None of the above
- Which of the following measures the revenue generated per dollar invested in assets?
- Pre-tax return on equity
- Net operating return on assets*
- Operating leverage
- Asset turnover ratio
- None of the above
- Which of the following managerial strategies affect Return on Assets (ROA)?
- Decrease operating costs
- Increase selling prices
- Lower interest costs
- All of the above
- a and b only*
- Which of the following managerial strategies can increase Return on Equity (ROE)?
- Increase employees productivity
- Increase service department efficiency
- Increase liabilities
- All of the above*
- a and b only
- Of the following managerial strategies, which will affect the asset turnover ratio?
- Increase selling prices*
- Decrease operating costs
- Lower interest on debt
- All of the above
- a and b only
- Which of the following managerial strategies will affect the operating leverage of the dealer?
- Increase selling prices
- Decrease fixed costs
- Lower variable expenses
- All of the above*
- b and c only
- In order for borrowing to enhance the return on equity, the interest rate of debt must be?
- More than the return on assets
- Less than return on assets*
- More than the operating leverage
- More than the asset turnover ratio
- None of the above
- What expense item is included in the calculation of ROE that is not included in the calculation of ROA?
- Variable expense
- Interest expense*
- Fixed expense
- Depreciation expense
- Cost of sales expense