February 2013
|
February 2013 // Volume 51 // Number 1 // Feature // v51-1a7


Needs and Perceptions of Cooperative Extension Educators Serving Latino Populations in the South
Abstract
A survey of 982 Extension educators from 12 southern states provides a snapshot of their experiences working with Latino communities. The objective of this article was to gather data regarding Extension educators' desire and perceived ability to work with the new Latino audiences in their communities and inform the development of cultural competency training. The rapid growth of the Hispanic population in rural communities in the South has left many Extension offices ill prepared to meet these new clients' needs. Suggestions for helping Extension educators develop effective partnerships and provide bilingual services are discussed.
Introduction
An important demographic change in the United States in recent years has been the dramatic growth in the numbers of Latinos migrating to new arrival communities in Southern states such as Georgia, North Carolina, and Arkansas (Dinan, 2005; Marotta & Garcia, 2003), where Latinos were sparse two decades ago (Kochhar, Suro, & Tafoya, 2005). Though not a homogeneous group, most of these new immigrants are coming from Mexico, have little formal education and limited English abilities, compete for low wage jobs (Capps, 2009), and have different needs than the bilingual, higher-income Latino groups (Delgadillo, 2003).
Many of these new Latino immigrants arrive in new receiving communities that are financially, socially, and structurally unprepared for them (Stamps & Bohon, 2006). Even though the absolute numbers of newcomers may be much smaller in rural areas, the impact of immigration is more acutely felt in rural communities than in large urban centers (Jensen, 2006).
Because of this rapid population change in the South, many social service organizations, including Extension, need to transform communication, networking, recruitment, and programming to enhance services for new immigrants and the communities receiving them (Allen, Gudino, & Crawford, 2011; Behnke, 2008; Hobbs, 2004). Many local Extension offices are ill equipped for this transformation; the needs of the incoming groups have not yet been assessed, and new programming demands are not reflected in budgeting, resource allocation, and professional development (Uttal, 2006).
Objectives
The objective of the study reported here was to determine the educational resources that Extension educators in the South need to serve Latino communities. The research questions developed to accomplish the objective were the following: 1) What are Extension educators' perceptions regarding educational resources they need to strengthen and/or expand their efforts to address the needs of Latinos in their communities?; 2) What are Extension educators' attitudes regarding Extension's role in working with the Latino community?; and 3) What are Extension educators' self-perceived knowledge, skills, and comfort regarding work with the Latino community? The study provides important information regarding the transitions and challenges experienced in many new arrival areas across the South and the response of service providers to such changes.
Methods
To assess Extension educator's present situation, knowledge, needs, and challenges when working with Latino audiences, the researchers created their own instrument with 45 quantitative and four qualitative questions. To establish content validity, the researchers asked a panel of experts to determine whether or not the instrument was appropriate to answer the research questions (Henerson, Morris, & Fitz-Gibbon, 1987). The panel indicated that in their opinion there had not been important omissions and that emphasis on the various sub-areas was balanced. This research was approved by NC State University IRB, the data was kept confidential via passcode protected excel files, and names and identifying information of respondents was not collected. The authors welcome others to use the survey piloted in this study. The full survey is available at: http://harvest.cals.ncsu.edu/surveybuilder/form.cfm?testid=6819.
The results reported in this article correspond to the part of the study dealing with the educational needs of Extension educators. It used 1) Six demographic questions about the respondents (Extension educators) and the Latino communities they serve; 2) One open-ended qualitative question (What specific educational resources do you most need in order to strengthen and/or expand your efforts to address the needs of Latinos in your county?); and 3) Sixteen quantitative questions. The 16 quantitative questions were a series of statements to which the respondents were asked to indicate their level of agreement in a five point scale (1 = strongly disagree to 5 = strongly agree), and are listed in Table 1.
The survey was posted online in March 2009, and responses were received until May 2009. The link to the survey was sent to State Cooperative Extension Directors and Administrators in 13 southern states, with the request that they forward it to all their Extension educators asking them to answer the questions and submit their responses. Approximately 2,600 Extension educators received the survey. The survey was completed by 1,065 Extension educators (41% response rate). The researchers received only three responses from Kentucky and eliminated those from the analysis. They also eliminated 80 responses that were incomplete. The final number of usable responses was 982.
Responses to quantitative questions were entered and analyzed using SPSS using Multivariate Analysis of Variance (MANOVA). Two researchers analyzed the data from the open-ended question, using a modified version of content analysis described by Lincoln and Guba (1985). The modified process was employed because the data were not acquired through naturalistic inquiry but from written responses to an unsigned survey. Thus, the researchers did not have access to respondents for process or terminal member checks, or the luxury of prolonged engagement and persistent observation.
The researchers initially worked independently and separated the responses into independent units (unitizing) and then contrasted the units to find recurring topics, ideas, and categories (categorizing). After each researcher had categorized all the data independently, the two worked together to find consensus and finish the data analysis. The research team then triangulated the qualitative data with the quantitative data, reviewed, and finalized the categories presented in this article.
To establish trustworthiness, the researchers followed suggestions by Lincoln and Guba (1985): 1) Used two investigators to reduce threat of investigator bias; 2) Triangulated results from the qualitative data with the quantitative data; 3) Used peer debriefing for each investigator; 4) Maintained an audit trail for dependability and confirmability; and 5) One of the researchers kept a reflective journal while working on the study.
Results
Demographics
Of the 982 respondents, over half identified themselves as a County Educator or Agent, followed by 17% currently working as a County Extension Director or equivalent. Respondents generally fell into two groups, with a large percentage (32%) having worked in Extension for less than 5 years, and the next largest percentage (29%) having worked in Extension for more than 20 years.
Seven percent of the respondents reported they could fluently speak Spanish. Eighty-four percent of participants described their Spanish-speaking skills as "poor," and even more participants described their Spanish reading and writing skills as "poor."
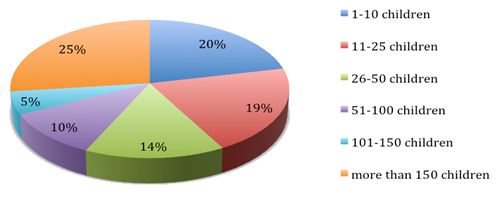
Thirty five percent of respondents indicated that there were between one and 1,000 Latino residents living in their county. Nineteen percent of respondents serve more than 150 Latino adults annually, though 32% serve only between one and 10 Latino adults each year (Figure 1). Throughout the South, respondents are serving more Latino children than adults, with 28% of Extension educators reporting they serve more than 150 children annually (Figure 2).
Figure 1.
Summary of Responses to Survey Question: "On Average, How Many Latino Adults Does Your Extension Office Serve Annually?"
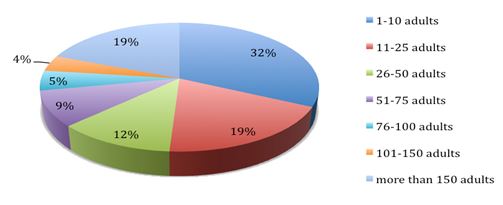
Figure 2.
Summary of Responses to Survey Question: "On Average, How Many Latino Children Does Your Office Serve Annually?
Educational Resources Needed
The researchers unitized the responses to the open-ended question about educational resources needed into 615 different units and categorized them into six major "emerging" themes: 1) Language; 2) Culture; 3) Needs assessment; 4) Personnel; 5) Resources; and 6) Characteristics of the Latino Community. The results are presented for each theme, integrating the data obtained from the analysis of the open-ended question and the quantitative questions. For descriptive pieces, quantitative data results are presented as percentages of respondents indicating they agreed or strongly agreed with the statements, while the estimated marginal means in Table 1 are used for comparisons between states.
Language
This category overwhelmingly generated the most responses. Participants clearly identified the need for more bilingual printed resources, indicating that exhibits, books, websites, advertisements, curriculum, and presentations should be available in both Spanish and English. On occasions, they were dissatisfied with the quality of the translation of existing resources in Spanish. However, only 15% of respondents said they were able to have their materials translated into Spanish (Question 1).
More than 100 respondents indicated in the answers to the open-ended question that they would consider taking Spanish classes, and 28% indicated that Extension educators should learn Spanish to better serve the Latino population (Question 2). Many suggestions were given to help bridge the language divide, including: 1) Enrolling in Spanish-language courses at work; 2), Being provided language software to learn Spanish at their own pace; 3) Interpretation services; and 4) English as a Second Language classes.
Culture
Some participants shared frustration with understanding Latino culture, yet most (54%) stated they were comfortable attending cultural celebrations held in Latino communities (Question 3). Nearly two thirds of all participants said that Extension educators should learn more about Latino culture in order to become more effective in their work with these communities (Question 4), which was higher than the 28% advocating for learning Spanish (Question 2). Some responses to the open-ended question indicated that cultural barriers and misunderstanding were sometimes a problem. In fact, 47% of participants said they thought Latinos are reluctant to accept services from members of other ethnic communities (Question 5).
Needs Assessment
Only a third of respondents (Question 6) reported regular interaction with the Latino community, and 39% said they are actively involved in reaching out to them (Question 7). While some respondents explained the lack of regular interaction by saying that there were not many Latinos in their counties, others indicated that they did not know how to effectively address their needs or that they had not yet identified their needs. Quantitatively, 37% indicated that they are interested in working with the Latino community, but they did not know how to find or approach key partners that could help them in their efforts (Question 8), and a significant portion (40%) said they work with members of the Latino community when developing their own programs (Question 9).
| Scale: 1=Strongly Disagree to 5=Strongly Agree | South 12 states | AL | AR | FL | GA | LA | MS | NC | OK | SC | TN | TX | VA |
| Valid responses (n) | 982 | 88 | 61 | 41 | 119 | 36 | 50 | 151 | 138 | 28 | 69 | 183 | 18 |
| Questions Asked | Estimated Marginal Means (SD) | ||||||||||||
| 1.When I develop a program, I usually have it translated into Spanish to facilitate use by the local Latino population. | 2.35 (1.08) | 2.20 | 2.18 | 2.68 | 2.54 | 2.09 | 2.32 | 2.47 | 2.13 | 2.07 | 2.10 | 2.57 | 2.09 |
| 2.Extension educators should learn Spanish to better serve Latino populations. | 2.71 (1.19) | 3.24 | 2.25 | 3.25 | 2.91 | 2.82 | 2.45 | 2.90 | 2.22 | 3.14 | 2.51 | 2.62 | 2.64 |
| 3.I am comfortable attending cultural celebrations held by the Latino community in my county. | 3.51 (0.95) | 3.26 | 3.46 | 3.61 | 3.65 | 3.44 | 3.30 | 3.61 | 3.26 | 3.43 | 3.30 | 3.79 | 3.55 |
| 4.Extension educators should learn about the Latino culture in order to be more effective in serving Latino populations in their area. | 3.66 (0.96) | 3.62 | 3.68 | 4.14 | 3.71 | 3.68 | 3.48 | 3.88 | 3.37 | 3.89 | 3.59 | 3.61 | 3.64 |
| 5.The Latino community in my county is reluctant to seek help from outsiders (that is, from those outside their ethnic community). | 3.35 (0.95) | 3.27 | 3.51 | 3.21 | 3.40 | 3.09 | 3.73 | 3.49 | 3.35 | 3.61 | 3.43 | 3.08 | 3.45 |
| 6.I regularly interact with the Latino community. | 2.80 (1.21) | 2.43 | 2.42 | 3.25 | 2.86 | 2.29 | 2.52 | 2.78 | 2.47 | 2.14 | 2.27 | 3.72 | 2.64 |
| 7.I am actively involved in reaching out to the Latino community in my county. | 3.09 (1.04) | 2.90 | 3.02 | 3.57 | 3.14 | 2.82 | 2.98 | 3.02 | 2.90 | 2.61 | 2.73 | 3.59 | 3.18 |
| 8.I am interested in working with the Latino community, but don't know how to find or approach key partners that could help me do so. | 2.95 (1.06) | 2.76 | 2.68 | 2.82 | 3.02 | 2.53 | 2.75 | 2.95 | 2.88 | 2.46 | 2.73 | 3.47 | 2.91 |
| 9.When I develop a program, I work with members of the community, including the Latino community, to make sure it meets their needs and interests. | 3.24 (0.93) | 3.02 | 3.16 | 3.64 | 3.32 | 2.97 | 3.09 | 3.15 | 3.09 | 2.96 | 3.06 | 3.64 | 3.09 |
| 10. Our county extension staff is well prepared to work with the Latino community. | 2.65 (1.08) | 2.46 | 2.67 | 2.89 | 2.86 | 2.29 | 2.50 | 2.37 | 2.40 | 2.00 | 2.38 | 3.26 | 2.91 |
| 11. I am familiar with other organizations that offer services to the Latino community in my region. | 3.29 (1.06) | 3.10 | 3.09 | 3.50 | 3.40 | 2.68 | 3.25 | 3.51 | 3.07 | 2.68 | 3.14 | 3.62 | 3.27 |
| 12. Extension agents should develop programs aimed at helping the Latino community. | 3.57 (0.84) | 3.62 | 3.25 | 4.14 | 3.62 | 3.62 | 3.45 | 3.71 | 3.37 | 3.64 | 3.38 | 3.64 | 3.45 |
| 13. Because of current economic conditions, devoting more funds through Cooperative Extension to Hispanic programming might not be a good idea. | 2.75 (1.03) | 2.93 | 2.89 | 2.18 | 2.86 | 3.03 | 2.91 | 2.56 | 3.23 | 2.61 | 2.76 | 2.36 | 3.18 |
| 14. I am reluctant to develop programs for the Latino community because immigration is controversial. | 2.30 (0.91) | 2.50 | 2.25 | 1.75 | 2.25 | 2.44 | 2.61 | 2.21 | 2.53 | 2.50 | 2.38 | 2.08 | 2.18 |
| 15. Latino community members are more of a burden than a benefit to my county. | 2.02 (0.86) | 2.33 | 2.14 | 1.46 | 1.89 | 2.12 | 2.32 | 1.94 | 2.21 | 1.96 | 2.02 | 1.85 | 2.09 |
| 16. Most Latinos in my county are poor and have low levels of education. | 2.98 (0.92) | 3.13 | 3.11 | 2.21 | 3.03 | 3.06 | 3.14 | 3.17 | 2.88 | 3.11 | 3.00 | 2.78 | 3.18 |
Personnel
Respondents felt that Extension was not quite as prepared to serve Latino clientele as they would like. For example, only 23% reported that county Extension staff is well prepared to work with the Latino community (Question 10). Participants cited the need for more bilingual staff members as a chief concern, followed by a lack of time, money, and staff to provide effective programming for the Latino community.
Resources
Fifty-four percent of respondents are familiar with other organizations in their area offering services for the Latino community (Question 11), and more than half (55%) indicated that Extension agents should develop programs for the Latino community (Question 12). However, 23% of respondents said that, because of current economic conditions, more Extension resources should not be devoted to serving Latino populations (Question 13). At the time of the survey (2009), only 8% were reluctant to develop programs for the Latino community because of controversy surrounding immigration (Question 14).
Characteristics of the Latino Community
Some participants indicated that in their case they did not need educational resources to effectively program for the Latino population because of some characteristics of Latinos in their counties. In some cases, it was because there were not many Latinos in their counties, because they all already spoke English, or because they were migrant workers and would not be able to benefit from most of the services.
A very small number of the responses to the open-ended question denoted a considerable disregard for the Latino community. However, most participants do not appear to hold prejudice against Latinos. For example, only 7% felt Latinos were more of a burden than a benefit in their counties (Question 15).
Thirty percent of the respondents indicated that in their county most Latinos are poor and have low levels of education (Question 16), which they indicated was an important factor for the needs assessment and the type of educational resources they would need.
Comparisons Between States
Table 1 shows the estimated marginal means to differ statistically by state using the Tukey HSD Post Hoc Test of Mean Differences (via MANOVA; F = 2.633, Wilk's Lamda = .421, p < .001). The first data column corresponds to the mean of the 12 Southern states and the standard deviation. The means in bold represent those means that are statistically different from the overall mean (p< .001 level).
The state with most deviations from the mean is Florida, where there is a statistically significant stronger sentiment regarding the need for Extension educators to learn Spanish (Question 2), learn about Latino culture (Question 4), and develop programs aimed at helping the Latino community (Question 12). Also in Florida respondents interact more with the Latino community and have a higher self-perceived ability to do so at statistically significant levels than the overall mean (Questions 6, 7, 9, and 11). Finally, in Florida, negative opinions about Latinos or about the role of Extension to work with Latinos, are significantly less frequent than in other states (Questions 13, 14, 15, and 16). Responses in Texas follow a very similar pattern to the one shown in Florida.
Responses in other states follow a different pattern. For example, in South Carolina, while respondents have positive opinions about the role of Extension toward Latinos, they feel quite unprepared. Their responses are significantly lower than the overall mean for the questions about regular interaction with Latino groups and active involvement to reach out to them (Questions 6 and 7), familiarity with service organizations for Latinos and work with members of the Latino community to develop programs (Questions 9 and 11), and level of preparation of the county staff to work with the Latino community (Question 10). Louisiana, and to a lesser extent Tennessee, follow a similar pattern.
Discussion
These results demonstrate that many of the respondents do not feel adequately prepared to serve the growing Latino population in their community because they do not fully understand the population or their needs; they may not recognize a subset of the population (migrant workers) as potential clientele; they face language and cultural barriers; they lack resources, materials, and funding; and they do not have sufficient support personnel. Consequently, most have not felt effective in their attempts to provide programming to members of the Latino community.
Respondents are overwhelmingly more supportive of the need for Extension educators to learn about Latino culture (66%) than the need to learn Spanish (28%). However, based on qualitative results, many of them consider language their most difficult barrier. This perception in itself may prevent educators from seeking out relationships with key Latino community leaders, many of whom are bilingual, and developing creative and collaborative solutions to the language barrier, underscoring the need for cultural competence training as a first step. Still, it is important to note that the majority of respondents are willing to learn Spanish, look for additional resources, and provide more effective programming to Latino audiences.
Most respondents stated they are comfortable working with Latino communities, an important starting point to building relationships with partners. However, nearly half of the participants are unfamiliar with key Latino leaders in their communities, and many are unfamiliar with the services offered by other agencies. Educators should develop collaborations with key partners already offering services to this population (Allen et al., 2011; Schvaneveldt & Behnke, 2012). Cultural competence training may provide educators the insights and skills needed to discover these Latino community resources and develop relationships with key leaders.
The difference in the number of Latino residents living in a county was shown to have an effect on resources, funding, services, and efficiency. Extension educators from states with larger Latino populations and a longer history with Latino groups, like Florida and Texas (23 and 37% Latino population respectively; U.S. Census, 2011), reported significantly higher respect for the value of the Latino community in their counties and higher responsibility, involvement and action, and self-perceived ability to work with them.
Notably, respondents in Texas and Florida were less reluctant than respondents in other states to work with the Latino community because of immigration issues. At the time of the survey (2009), there were no states where respondents were significantly more reluctant to work with Latinos due to a perception of immigration being a controversial issue, but it would be interesting to examine the current perception, especially in states such as Alabama, where policies have changed significantly since the completion of the survey.
Even in communities with relatively small Latino populations, Extension educators are providing more services to Latino children than Latino adults each year (Figures 1 and 2). This finding is interesting because it suggests that fewer Latino adults are seeking assistance, when in fact it may be that adults are less likely to speak English than are their children and are therefore unaware of or unable to benefit from current Extension services. We hope these larger numbers of youth will continue to stay engaged over their lifetime and also engage their parents and families.
Respondents' feelings regarding Latino culture may also be an indicator of the distance many feel between themselves and their Latino clientele. When educators are unfamiliar with Latino culture they may rely on mainstream stereotypes and generalizations. Nearly half of respondents said they felt Latinos were hesitant to accept services from members of other ethnic groups. This perception may leave Extension educators feeling their efforts within these communities would not be or are not appreciated or beneficial.
Recommendations
Experience and research have shown that translation of existing educational programs into Spanish is not sufficient to meet the needs of the Latino community. Programs and the people who deliver them must be culturally appropriate to be effective. In addition, programs that bring together participants from different cultures need to be developed and delivered in a way that advances understanding and bridges differences. The findings demonstrate that Extension educators are aware that they need help tackling the linguistic and cultural barriers that are preventing the delivery of culturally and linguistically appropriate services to the new immigrant Latino community. In addition to individual competence, organizations should invest in hiring bilingual/bicultural personnel, providing professional development opportunities, and developing bilingual/bicultural educational resources.
According to these results, many Extension professionals would benefit from Spanish courses, especially those focused on conversational Spanish (VanPatten, 1986). One way to make this possible is via Extension's connection with university Spanish-language classes that could be made freely available to Extension staff. Extension should employ bilingual/bicultural staff members to work with Latinos and be creative in programming approaches (Hobbs, 2004). For example, English as a Second Language (ESL) classes could be used in conjunction with "stealth education" to teach English vocabulary while also teaching topics such as nutrition, money management, and gardening (Schvaneveldt & Behnke, 2012). This approach does not require the educator to speak Spanish and attracts eager learners who gain new skills and competencies. Educators need to understand what types of programs Latino community members want and create programs or have their programs culturally adapted. Extension needs to ensure that there are effective programs to offer and then make a concerted effort to market them well.
Equally important to language skills is the need to open lines of communication with these communities (Uttal, 2006). Cultural competency training can provide the confidence, cultural contextualization, and understanding that will make this relationship building more likely to succeed. Cultural competence is a continual process. Educators should not be deterred when upsets occur (e.g., low attendance at first), but they should be mindful that relationships take time to develop (Schvaneveldt & Behnke, 2012). Extension educators who are able to effectively interact with their Latino clients will continually learn more about the culture and be able to engage key stakeholders and community members as collaborators. In addition, Extension educators should identify individuals who are successfully working with Latinos and engage them as advisors in how to best serve these clients. Such partnerships will also help Extension conduct thorough needs and assets assessments in Latino communities.
Finally, although the findings point to the fact that many Extension educators do not feel prepared to serve this population, some educators are very engaged and have effective programs targeting the Latino community. These Extension educators should share their experiences and best practices with those who lack experience in this area and create networks of support. One model of this type of support is taking place in North Carolina, where every county is represented on one of five District Latino Taskforces, and a state-level Cooperative Extension Latino Advisory Council, including non-Extension representatives advises statewide programming. Leadership for this network is supported by a dedicated Latino Affairs Facilitator (state specialist). Regionally, Extension professionals should attend conferences that allow Extension professionals and faculty to network, share their experiences, and draw on the knowledge of one another. Interested Extension educators are invited to participate in SERA-37 <http://sera37.wordpress.com> or NCERA-216 <http://nimss.umd.edu/homepages/home>, two Extension initiatives that unite Latino-serving Extension professionals to program and collaborate across their regions and the United States.
Conclusion
Extension educators must be supported in order to gain the skills necessary for serving, what is for many, new Latino populations in their counties. Resources that will help these Extension educators learn Spanish, build cultural competence, share knowledge and practice, have access to culturally appropriate programming in Spanish, and reach out to these communities will ultimately be the bridge that connects Extension and local Latino communities.
Acknowledgments
Funding in support of regional collaboration was provided by the Southern Rural Development Center. The authors wish to thank Dr. Bo Beaulieu and the Southern Region Extension Directors, Administrators, and State Program Leaders and Coordinators for assistance in distribution of the survey and the Respondents who responded to the survey. The authors appreciate the contributions of the SERA-37: The New Hispanic South membership, in particular members of the Immersion Task Force.
References
Allen, K., Gudino, A., & Crawford, C. (2011). Getting them in the door: Strategies for recruiting Latinos to family life education programs. Journal of Extension [On-line]. 49(3) Article Number 3TOT7. Available at: http://www.joe.org/joe/2011june/tt7.php
Behnke, A. O. (2008). Expanding the Latino market niche: Developing capacity and meeting critical needs. Journal of Extension [On-line], 46(5) Article Number 5RIB5. Available at: http://www.joe.org/joe/2008october/rb5.php
Capps, R. (2009). Immigrant youth issues in the US [Video File]. Presentation for national webcast of the National Governor's Association. Retrieved from: http://media.nga.org/2009/090603WebcastImmigrants.wmv
Delgadillo, L. (2003). Guidelines for reaching out and counseling low income monolingual Latino clients. Journal of Extension [On-line], 41(6) Article Number 6FEA5. Available at: http://www.joe.org/joe/2003december/a5.php
Dinan, K. A. (2005). Federal policies restrict immigrant children's access to key public benefits: A children in low-income immigrant families policy brief. New York, NY: National Center for Children in Poverty.
Hobbs, B. B. (2004). Latino outreach programs: Why they need to be different. Journal of Extension [On-line], 42(4) Article Number 4COM1. Available at: http://www.joe.org/joe/2004august/comm1.php
Jensen, L. (2006). New immigrant settlements in rural America: Problems, prospects, and policies (Carsey Institute Report on Rural America). Retrieved from: http://www.carseyinstitute.unh.edu/publications/Report_Immigration.pdf
Kochhar, R., Suro, R., & Tafoya, S. (2005). The new Latino south: The context and consequences of rapid population growth (Pew Hispanic Center Report). Retrieved from: http://www.pewhispanic.org/2005/07/26/the-new-latino-south/
Lincoln, Y. S., & Guba, E. G. (1985). Naturalistic inquiry. Newbury Park, CA: Sage Publications.
Marotta, S. A., & Garcia, J. G. (2003). Latinos in the United States in 2000. Hispanic Journal of Behavioral Sciences, 25(1), 13-34.
Schvaneveldt, P. L., & Behnke, A. (2012). Family life education with Latino immigrant families. In S. Ballard & A. Taylor (Eds.), Family life education in diverse populations. Newbury Park, CA: Sage.
Stamps, K., & Bohon, S. A. (2006). Educational attainment in new and established Latino metropolitan destinations. Social Science Quarterly, 87, 1225-1240.
U. S. Census Bureau. (2011). Overview of Race and Hispanic Origin: 2010. Washington, DC: Author. Retrieved from: www.census.gov/prod/cen2010/briefs/c2010br-02.pdf
Uttal, L. (2006). Organizational cultural competency: Shifting programs for Latino immigrants from a client-centered to a community-based orientation. American Journal of Community Psychology, 38, 251-262.
VanPatten, B. (1986). Second language acquisition research and the learning/teaching of Spanish: Some research findings and implications. Hispania, 69(1), 202-216.