June
2012
|
June 2012 // Volume 50 // Number 3 // Feature // v50 -3a6


Identifying and Measuring Food Deserts in Rural Ohio
Abstract
The purpose of our article
is twofold. First, we introduce a framework for U.S. Extension
educators to measure the extent of food access at any scale when
information about food carried by retailers is limited. Second, we
create a baseline for the Ohio Food Policy Council so that work to
increase food access in rural areas will have a benchmark to measure
success. Three broad aspects of food accessibility—physical,
economic, and healthful—are considered. Lack of larger
supermarkets, lack of competition, and high concentrations of nearby
fast food alternatives are three issues that deserve attention in
rural Ohio.
Introduction
Access to affordable and nutritious food by low-income and rural communities has long been a concern to advocates, policymakers, and the general public. In the past, these concerns led to the creation of programs such as the Supplemental Nutrition Assistance Program (SNAP, formerly known as the Food Stamp Program) and the Supplemental Nutrition Program for Women, Infants, and Children (WIC). Despite the advent of these food assistance programs, some low-income rural communities are still lacking adequate access to nutritious food, and residents live in food deserts. Recently, increases in obesity and chronic diseases associated with poor diets have led to concerns that some low-income and rural communities still lack access to affordable and nutritious foods. These concerns led the U.S. Congress, in the 2008 Farm Bill, to request that the Department of Agriculture (USDA) conduct a study of these food deserts. Published in June 2009, the USDA study concluded that:
- 2.3 million (2.2% of all) U.S. households live more than a mile from a supermarket AND do not have access to a vehicle;
- 3.4 million (3.2% of all) U.S. households live between 0.5 to 1 mile AND do not have access to a vehicle;
- 4.4% of U.S. households in rural areas live more than 1 mile from the supermarket AND do not have access to a vehicle; and
- 22% of U.S. households in low-income urban areas live 0.5 to 1 mile from a supermarket with no access to a vehicle.
Likewise, the Ohio Food Policy Council became interested in understanding the extent of food deserts in rural Ohio for the purpose of recommending methods to reduce inadequate food accessibility and to establish a benchmark from which future policy success can be measured. To this end, we conducted a study of Ohio rural food deserts.
The Ohio Food Policy Council was established by Governor's Executive Order #27S by Governor Strickland in August of 2007. Its mission is to:
- Collect and analyze information on the production and processing of food in Ohio as well as the patterns of food consumption.
- Protect Ohio's valuable farmland and water resources by encouraging the growth of food products in Ohio.
- Provide those in need with greater access to fresh and nutritious foods.
- Assist Ohio farmers and businesses in marketing their food products inside and outside the state.
- Develop strategies to link producers and consumers in local food systems.
What Are Food Deserts?
The language in the 2008 Farm Bill defines a food desert as an "area in the United States with limited access to affordable and nutritious food, particularly such an area composed of predominantly lower income neighborhoods and communities" (USDA, ERS, 2009). Accordingly, the methods we chose for identifying food deserts in the study reported here use three broad aspects of accessibility—physical accessibility, economic accessibility, and healthful accessibility.
Food deserts have traditionally been discussed in an urban context, but can exist in both urban and rural areas, as supermarkets continue to move towards newer suburban developments characterized by higher incomes and greater buying potential (Gallagher, 2006). This is important for Ohio, a state that features several substantial urban centers, but is also home to a significant rural population (nearly 43% of Ohio households).
Further, in order to restore the land-grant mission, we argue that practical work such as food desert identification should be part of Extension services. In fact, such work will promote the land-grant mission by allowing Extension educators to engage in catalytic work for food system revitalization (Colasanti, Wright, & Reau, 2009).
Measuring Food Accessibility
Various approaches have been used to measure the size of food deserts. In Chicago, Gallagher (2006) estimated the impact of food deserts on public health by approximating a "Food Balance Score" that was done by dividing distance of every city block to the nearest fresh food outlet over distance to the nearest fast food restaurant. Rose et al. (2009) used a 1 km radius to estimate service areas of supermarkets in New Orleans. Apparicio, Cloutier, and Shearmur (2007) used three measures of accessibility to food outlets to identify food deserts in Montreal, Canada: proximity (distance to the nearest supermarket), diversity (number of supermarkets within a distance of less than 1000 meters), and variety in terms of food and prices (average distance to the three closest different chain-name supermarkets). Several other studies were undertaken in California, Missouri, Texas, Mississippi, and many other states using similar methods with slight adjustments (Algert, Aditya, & Douglas, 2006; Baker, Schootman, Barnidge, & Kelly, 2006; Berg & Murdoch, 2008; Blanchard & Thomas, 2008).
The study reported here framed food accessibility in rural Ohio along the three axes of accessibility introduced earlier.
- Physical accessibility measures food accessibility by estimating vehicle travel time, walking travel distance, and public transportation accessibility. In other words, physical accessibility identifies households that are able to efficiently and easily access a food outlet via private and/or public transportation.
- Second, since households' demand for food is a function of income and price, economic accessibility measures food accessibility by estimating median income and poverty rate and calculating the level of local competition between supermarkets, which determines local price levels.
- Finally, the healthful accessibility aspect measures food accessibility by identifying households faced with nutritional challenges compounded by high concentrations of nearby fast food alternatives on one hand, and less nutritional food alternatives at the store on the other hand.
Unlike previous approaches, our framework can be applied at any scale with or without a Geographic Information System (GIS) environment. However, almost all of our analysis was conducted in a GIS environment, using ESRI's ArcGIS software. We combined a visual and a statistical approach to measure the size of food deserts and the impact on rural Ohioans. We considered "rural" Ohio to be those areas of the state designated as not urbanized in the 2000 United States Decennial Census. Using ArcGIS, we overlayed the Census TIGER urbanized area shape file http://www.census.gov/geo/www/tiger/ on to the state boundary to "mask" out all urbanized areas in the state.
The demographic data was estimated for 2008 using block group spatial data with associated demographic data from ESRI's ArcGIS Business Analyst extension. We estimated that a total of 5,209,819 Ohioans are living in rural areas (1,979,561 out of 4,627,893 households). In the study, we focused on households as opposed to individuals because that is the standard set by the USDA ERS (2009) study.
We assumed that most rural Ohioans purchase their fresh and nutritious food from retail food outlets (USDA ERS, 2009). The retail grocery store spatial and descriptive data was also provided by ESRI's Business Analyst, which is originally sourced from InfoUSA. Each business location has a North American Industrial Classification System (NAICS). We used the 4-digit NAICS code 4451 for supermarkets and other grocery and convenience stores. We added in large super-centers (NAICS code 4529) that carry a full line of grocery products among other lines of products, such as WalMart. We refer to both of these types of stores as "retail grocery stores" in general. Therefore, retail grocery stores entail all sizes of outlets from corner stores to super-centers. When we refer to large supermarkets, we narrow down grocery stores to include only those stores with 40,000 square feet or greater. The median square footage of a supermarket was 47,500 in 2007, with big boxes over 100,000 square feet. Later, when calculating healthful food accessibility, we use location data on fast food restaurants (NAICS code 72221).
Because the study analyzed all of rural Ohio, it was necessary to use secondary data. Therefore, we focused only on retail grocery outlets as defined by the North American Industry Classification System (NAICS) and not on all places that rural Ohioans obtain food.
Geographical Accessibility
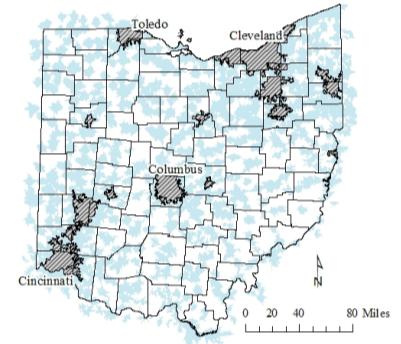
We measured physical accessibility in three ways: via driving, walking, and, to a much more limited extent, public transportation. To capture the first segment of geographic accessibility, we identified the location of every retail grocery store in rural Ohio and those located near the border between Ohio and its bordering states (Michigan, West Virginia, Kentucky, Indiana, and Pennsylvania). Using ArcGIS Network Analyst, we calculated a 10-minute drive distance along the road network to these outlets (again, outlets ranging in size from a corner store to a super-center). Using block group data from the census, we estimated the number of households living in and out of a 10-minute drive along roads (Figure 1). We also used the demographic data to estimate the number of rural households with and without access to a vehicle. The use of drive-time at this scale (all the rural areas in a state) is unique. Most often straight-line distance is used, which is less accurate, particularly in rural areas, where the road network is not as dense. The results state that:
- 24% (or 475,095 rural Ohio households) of rural Ohioans households do not live within a 10-minute drive of a retail grocery store of any size.
- Of the households living within a driving distance to a retail grocery store, 5% (or 75,223 rural Ohio households) do not own a car.
- 3.8% (or 75,223 rural Ohio households) of rural Ohioans live within driving distance of a retail grocery store AND do not have access to a vehicle.
Figure 1.
10-Minute Drive (in light blue) to Ohio Retail Grocery Stores
We also estimated the number of rural Ohioan households living within walking distance of a food outlet. We first created a 1-mile walk distance around each grocery store and calculated the number of rural households living in and out of the walking distance buffers (Figure 2). We recognize that this distance is quite far in an urban setting, but not in a rural setting. In most urban studies, ½ mile is used as walking distance (Rose et al. (2009); Apparicio, Cloutier, & Shearmur, (2007); Algert, Aditya, & Douglas (2006)).
- 75% of rural Ohio households live further than a 1-mile walking distance to a grocery store.
- 59,389 rural Ohio households, or 3%, live more than 1 mile from a supermarket AND do not have access to a vehicle.
To capture the third element of physical accessibility, we focused on public transportation. Bus service is very inconsistent across rural areas of Ohio. Counties such as Gallia County in Appalachia, Ohio, have no bus service. The Gallia County Council on Aging does provide transportation for Gallia County senior citizens age 60 and older to grocery stores. There are exceptions for individuals between 50 and 60 years of age. Therefore most individuals in Gallia County under 60 years old have limited access to grocery stores and must secure alternative transportation, which can be a double burden for those residents with low incomes.
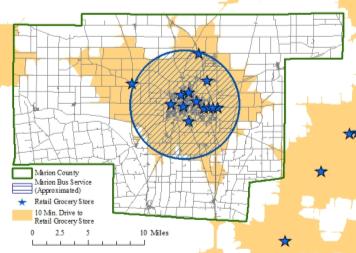
Further, due to the lack of complete data on bus accessibility in rural Ohio, we limited our study to a case study. In Marion County, the bus service is available within the downtown area and 5 miles around the downtown area (Figure 2). Therefore, we first estimated the bus service area by creating a 5 mile-radius around downtown Marion. Then, we calculated the total number of households inside and outside the bus service area.
- Most of the grocery stores are within the bus service area, but 27.5 % of Marion county households (or 6,890) do not live within a bus service area.
- 2.4% of households (or 601) live outside of a bus service area AND do not own a car.
- 38.7% of households (or 9,696) live outside of a 10-minute drive (in orange on the map), while 1% of Marion County households (or 251 households) live outside of a 10-minute drive AND do not own a car AND live outside of a bus service area.
Figure 2.
Retail Grocery Store Access via
Public Transportation, Marion County
Economic Accessibility
Next we examined economic accessibility of food. Economic accessibility is divided into income and price segments because demand for food is a function of both income and price. Limited accessibly due to low income was captured by measuring the median per capita income and households living inside and outside of both the 10-minute drive and 1-mile walk to grocery stores. We did this by using the resulting shapefiles from the physical accessibility section driving and walking examples and overlaying them on the block group spatial demographic data to estimate the mean yearly per capital incomes both in and outside of those drive times and walking distances.
- Median yearly per capita income of households living further than a 10-minute drive is $22,371, and the median yearly per capita income of households living within a 10-minute drive $23,105, which are statistically different.
- For rural Ohio households making under $10,000, we found that 9.7% of these households (or 134,827 households) live within a 10-minute drive and 9.9% of households (or 42,223 households) live outside a 10-minute drive.
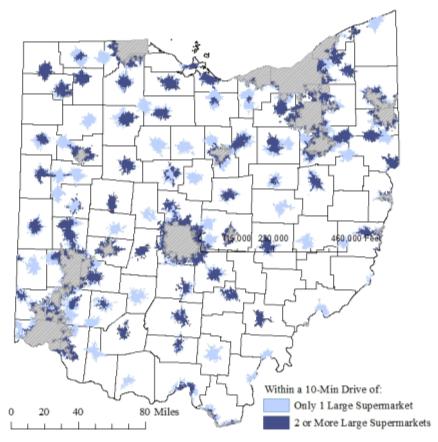
To capture the price segment of economic accessibility, we identified communities dominated by a single large supermarket (>40,000 sq feet). The assumption is that communities dominated by one food outlet are more likely to face higher prices, an indication of food affordability, because of monopolistic forces (Basker, 2005). Selecting the large supermarkets out of the retail grocery store spatial data, we then calculated the drive distance to each of the stores. Next, we identified where these drive distances overlapped (Figure 3). Households in rural Ohio that were located in areas that drive distances overlapped are considered to be in a competitive zone for large supermarkets.
- 583,271 of rural households (29.5%) live in areas where there is some competition—being within a 10-minute drive of more than one large supermarket.
- 268,333 households (13.6%) live in areas that are dominated by one larger supermarket that may have higher prices because of lack of competition.
- Of these households, 16,786 of them (or 6.3%), do not own vehicles to drive to a more competitive zone.
Figure 3.
Geography of Large Supermarket Competition
Healthful Accessibility
To estimate healthful accessibility we assumed that larger stores have relatively more shelf space and a larger variety of goods. We used the layer of large supermarkets from the previous section and the 10-minute drive distance to estimate the number of Ohio rural households, and whether or not they had access to a vehicle, that are within a 10-minute driving distance and those that are not.
- 43.0% or 851,604 households live in a 10-minute drive of a large supermarket.
- For those households within this 10-minute driving-distance, 51,252 households (6.0%) are without a car.
To further explore healthful accessibility, we compared accessibility of limited service restaurants (often referred to as "fast" or "convenience" food establishments) to accessibility of large supermarkets. In particular, we were interested in how many rural Ohioans are within a 10-minute drive distance from a fast food restaurant and not a 10-minute drive to a supermarket. To define fast food restaurants we used the North American Industry Classification System (NAICS) definition for "Limited-Service Eating Places" (72221).
Figure 4 illustrates in beige those areas of rural Ohio that are more proximate to fast food than they are to a supermarket. Those households in white areas are outside a 10-minute drive of both fast food and large supermarkets. Therefore, households in green and white areas in Figure 4 suffer from physical and healthful inaccessibility. The 486,702 rural households in green areas (or 24.6% of rural Ohioans), however, also face nutritional challenges compounded by high concentrations of nearby fast food alternatives. This situation is what Gallagher (2006) calls the "Food Balance Effect."
Figure 4.
Rural Ohio Areas with Fast Food Access and Not Large Supermarket Access (in beige)
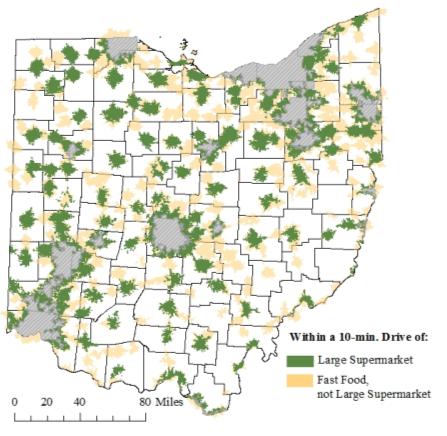
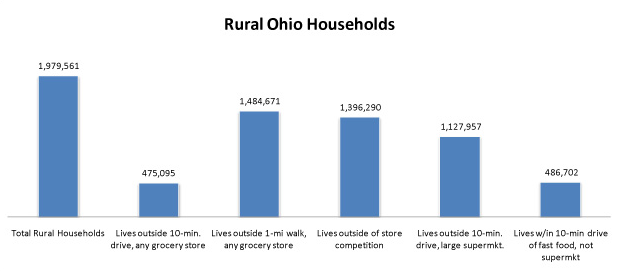
Figure 5.
Comparing Access, Selected Results for 2008 Rural Ohio Households
Conclusion
Food deserts exist throughout the United States in areas where individuals lack physical, economic, and healthful accessibility to nutritious food. The 2009 food deserts study conducted by the USDA found that 2.2% (2.3 million) of all U.S. households live outside of walking distance, or a 1-mile radius, of a supermarket and do not own a vehicle. However, that number rises to 4.4% when only rural households are considered. Similarly, 3% (59,389) of rural Ohio households live beyond a 1-mile walk of a retail grocery store of any size and do not own a vehicle. It is important, then, to note that rural areas, with their greater distances, present a unique challenge to food access.
Findings suggest that Appalachian and western portions of Ohio have greater food gaps. Appalachia, in particular, suffers from a lack of large supermarkets. Further, lack of larger supermarkets and lack of competition are two issues that deserve attention in rural Ohio. A large number of rural Ohioans face nutritional challenges compounded by high concentrations of nearby fast food alternatives.
Previous studies offer policy recommendations for increased access including: creating new outlets, increasing the healthiness of food offerings at existing outlets, developing new transportation opportunities, and using alternative distribution methods. These recommendations, however, focus on solutions applicable primarily to urban food deserts and, although helpful, do not fully address the unique aspects of rural food deserts. Rural food deserts should be considered differently for several reasons, but primarily because of issues arising from their lower densities.
Ideally, further study would build on the research reported here by examining further rural points of food access such as farmer's markets, other venues that are not considered retail grocery stores but sell food (like dollar stores), and other methods such as reciprocity and redistribution used by low-income households to increase food access (Wright-Morton, 2008). In addition, further study should explore alternate means of rural transportation and food distribution techniques and how rural food desert solutions may differ from the urban context.
As more and more states, regions, counties, and cities develop food policy councils and groups like them to address restructuring the food system, Extension educators can play a role in the process of developing and evaluating sound strategies (Colasanti, Wright, & Reau, 2009). The three-axis accessibility framework (physical, economic and healthful) presented in the study reported here could be used by Extension educators as a basis for discussion among stakeholders in these groups to: determine what the parameters are for physical, economic and healthful accessibility in their study area; identify food deserts at any scale when limited information is available about food carried by retailers; measure their extent from three main aspects of food accessibility; and create a baseline for future evaluation of food policy council success.
References
Algert, S. J., Aditya, A., & Douglas, S. L. (2006). Disparities in access to fresh produce in low-income neighborhoods in Los Angeles. American Journal of Preventive Medicine 30(5): 365-370.
Apparicio, P., Cloutier, M., & Shearmur, R. (2007). The case of Montreal's missing food deserts: evaluation of accessibility to food supermarkets. International Journal of Health Geographics 6(1) 4.
Baker, E. A., Schootman, M, Barnidge, E., Kelly, C. (2006). The role of race and poverty in access to foods that enable individuals to adhere to dietary guidelines. Preventing Chronic Disease: Public Health Research, Practice, and Policy, 3(3).
Basker, E. (2005). Selling a cheaper mousetrap: Wal-mart's effect on retail prices. Journal of Urban Economics, 58: 203-29.
Berg, N. & Murdoch, J. (2008). Access to grocery stores in Dallas. International Journal of Behavioural and Healthcare Research 1(1): 22-37.
Blanchard, T C., & Lyson, T .(2006). Access to low cost groceries in nonmetropolitan counties: large retailers and the creation of food deserts. Paper presented at Measuring Rural Diversity Conference. Retrieved from: http://srdc.msstate.edu/measuring/Blanchard.pdf
Colasanti, K., Wright, W., & Reau, B. (2009). Extension, the land-grant mission, and civic agriculture: Cultivating change. Journal of Extension [On-line], 47(4) Article 4FEA1. Available at: https://www.joe.org/joe/2009august/a1.php
Gallagher, M. (2006). Examining the impact of food deserts on public health in Chicago. Mari Gallagher Research & Consulting Group, Chicago, Il USA. Retrieved from: http://asap.sustainability.uiuc.edu/members/sagra/LaSalleBank_FoodDesert_ExecSummary.pdf
Horowitz, C. R., Colson, K. A., Hebert, P. L., &Lancaster, K. (2004). Barriers to buying healthy foods for people with diabetes: Evidence of environmental disparities. American Journal of Public Health 94(9): 1549-1554.
Kaufman, P. R. (1999). Rural poor have less access to supermarkets, large grocery stores. Rural Development Perspectives 13(3): 19-25.
Ohri-Vachaspati, P., Masi, B., Taggart, M., Konen, J., & Kerrigan, J. (2009). City fresh: a local collaboration for food equity. Journal of Extension [On-line], 47(6) Article 6FEA1. Available at: https://www.joe.org/joe/2009december/a1.php
Rose, J., Bodor, N. Swalm, C., Rice, J., Farley, T., & Hutchinson, P. (2009). Deserts in New Orleans? Illustrations of urban food access and implication for policy. Manuscript prepared for University of Michigan National Poverty Center/USDA Economic Research Service Research "Understanding the economic concepts and characteristics of food access."
Susan, H. B., Allison, L., Theresa, A. H., Stefan, H., Harold, G., Rebecca, F., Rajni, B., Victor, R., & Sarah, T. (2008). Designed for disease: The link between local food environments and obesity and diabetes. California Center for Public Health Advocacy, Policy Link, and UCLA Center for Health Policy Research. Retrieved from: http://www.healthpolicy.ucla.edu/pubs/Publication.aspx?pubID=250
U.S. Department of Agriculture .(2009). Access to affordable and nutritious food—measuring and understanding food deserts and their consequences: Report to Congress, June, 2009. Retrieved from: http://www.ers.usda.gov/Publications/AP/AP036/
Wright-Morton, L. ( 2008). Accessing food resources: rural and urban patterns of giving and getting food. Agriculture and Human Values. 25(1): 107-119
U.S. Department of Agriculture-Food and Nutrition Services. (2008). Supplemental nutrition assistance program: Standard utility allowances. Washington, DC, USDA.
U.S. Department of Agriculture . (2009). Official USDA food plans: cost of food at home at four levels, U.S. average. Retrieved from: www.cnpp.usda.gov/Publications/FoodPlans/2008/CostofFoodJun08.pdf