April 2012
|
April 2012 // Volume 50 // Number 2 // Feature // v50-2a2


Context Matters: The Importance of Local Culture in Community Participation
Abstract
Encouraging members of the public to get engaged in local decision-making is a key role of Extension educators. The study reported here explores whether local context influences which individuals choose to attend public meetings about the community and the environment. The study surveyed meeting attendees and non-meeting attendees in three contextually different counties in Northern Indiana. Findings are that determinants of participation are different in all three of these counties, suggesting that context is much more important in explaining participation than was earlier thought. Therefore, it is critically important that Extension personnel be able to understand the local context.
Introduction
Participation in local community decision-making is declining as people become less connected to the social fabric of their communities (Putnam, 2000). It is difficult to engage people in environmental decision-making due to increasing competition for people's time (school activities, work responsibilities, volunteering, and long commutes) and decreasing dependence on local media (which makes it hard to inform people about participation opportunities). People are also increasingly divided along partisan lines, a condition that makes common cause more difficult to identify. However, a common responsibility of Extension educators is to bring people together to make informed decisions about local environmental and community issues (Jolley, 2007). Understanding what motivates people to participate can help Extension educators better design meetings and public events.
Extension has a rich history in public issues and citizen engagement (Checkoway, 2001; Peters, 2002). There is also an extensive literature that documents the importance of involving the public in community decision-making. One theme in this literature is that involving residents, including marginalized residents, is simply the "right thing to do," especially in a democracy (Alinsky, 1971). Another, more pragmatic, theme focuses on the positive outcomes of public involvement. For environmental issues, these outcomes can include cost-effectiveness, increased quality of decisions, improved environmental outcomes, access to new information, enhanced fairness, improved legitimacy, and capacity-building (Aldrich, 2008; Beierle, 2002; Daley, 2007; Dietz & Stern, 2008; Lauber & Knuth, 2000; McKinney & Harmon, 2002).
The study reported here examined individuals' decisions to attend a variety of meetings related to local environment/community issues, including regional planning, flooding, recycling, and watershed planning. The study explored if the decision to participate differed based on community context by studying counties along a rural/homogeneous to urban/heterogeneous continuum in Northern Indiana. The a priori hypothesis is that determinants of participation will not differ by context.
Earlier work looking at motivations for participation in community involvement or community service assumed that motivations are determined largely by individual characteristics, ignoring the role of local context (see, e.g., Smith, 2005; Batson, Ahmad, & Tsang, 2002). These studies are important because they add to theories about why specific types of people participate, but they do not help guide how to encourage participation in a specific setting. Koehler and Koontz (2008) examined participation in watershed groups in Ohio and found that both individual characteristics and group characteristics were important for explaining active participation. Their study population consisted of people who were members (both active and inactive) in watershed groups. They did not look at who became a member in different contexts. General trends from this body of literature are that older, male, more educated, wealthier individuals with more trust and a sense of political efficacy are more likely to participate (see, e.g., Koelher & Koontz, 2008; Marshall & Jones, 2005).
In McAvoy's (1999) study of local participation in unwanted land use projects, he selected Minnesota because of its local culture of activism and participation, and further investigated two counties within the state—Red Lake and Koochching—because these had been sites where residents regularly interacted with policymakers. That is, individual counties may be more or less active, have fewer or more public hearings, and display more or less involvement in political decision-making, even within the same state. This article builds on these past studies to show the critical nature of local culture in determining participation in public meetings.
Study Area
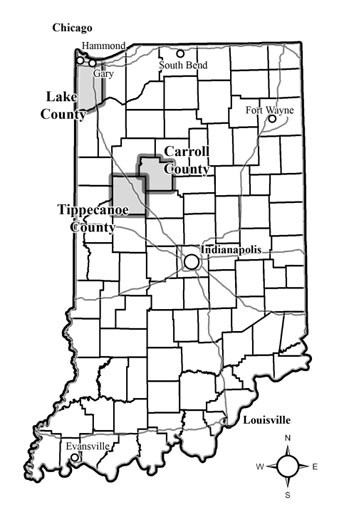
Ideally, it would be possible to sample residents from every county across Indiana to ensure accurate representation of the entire state. However, without the time and financial resources to sample thousands of residents, we maximized available resources through a methodology called "choice-based sampling" (see King, Keohane, & Verba, 1994, sec. 4.4 for an overview). Our surveys focused on areas in the state where both the dependent and independent variables of interest to the study varied. In short, we selected three counties that varied widely in terms of their socioeconomic characteristics, particularly their mix of rural/urban, levels of population density, and amount of racial diversity, education, unemployment, and income, along with levels of citizen involvement. As described below, these three counties—Lake, Carroll, and Tippecanoe—bring with them a spectrum of values on these scales, and we feel that our samples from these locations capture important aspects of Indiana culture and attitudes towards participation (see Figure 1 for county locations). This article does not argue that the sample is representative of the entire state—to the contrary, it argues that such generalizations in the field of Extension education may be misguided.
Lake County stands out as the most urban of the counties under study; it is a rapidly urbanizing area located in the northwestern most corner of Indiana, neighboring Chicago and along Lake Michigan. The county population of 494,211 (2008) is one of the most diverse populations in the state, with nearly 30% being nonwhite. The median household income in 2008 was $50,042. Eighty-one percent of adults 25 years and over have a high school diploma or higher and 16% have a Bachelor's degree or higher. In April 2010, the unemployment rate was 10.6% (U.S. Census Bureau, 2010).
The most rural county in our study is Carroll County, an agricultural community with a population of 19,752. The largest town is Delphi, with a population of 2,862 people. The county is the least diverse county in the study area, with a 96% white population. The county's median household income in 2008 was $50,907. Eighty-three percent of adults 25 years and over have a high school diploma or higher, and only 13% have a Bachelor's degree or higher. The unemployment rate in April 2010 was 9.7% (U.S. Census Bureau, 2010).
Tippecanoe County sits a few counties south of Lake County and to the west of Carroll County and is home to Purdue University. It also sits in the middle of an urban to rural continuum, with both urban (Lafayette and West Lafayette) and rural, agricultural areas. The total population for the county is 167,964. Eleven percent of the population in Tippecanoe County is nonwhite. The median household income in 2008 was $45,330. Eighty-eight percent of adults 25 years and over have a high school diploma or higher; 33% have a Bachelor's degree or higher. In April 2010, the unemployment rate was 8.6% (U.S. Census Bureau, 2010).
Methods
We compared people who attended public meetings to people who did not attend meetings. In order to do this, we surveyed both meeting attendees and non-meeting attendees in the three counties. This is somewhat similar to an approach used by Marshall and Jones (2005) in which they surveyed people who participated in natural resource decision and those who did not. To access meeting attendees, our team attended environmentally related meetings in all three counties in summer-fall of 2009. We identified these meetings through personal contacts and searches of local newspaper listings and local websites.
Meetings covered topics such as storm water management, flooding, recycling, community visioning, regional planning, and watershed management. Some of these meetings were standing public meetings, such as a county council meeting that had an environmental topic on the agenda, while others were meetings organized to address a specific topic. In total, team members attended six meetings in Tippecanoe County, five meetings in Lake County, and one meeting in Carroll County. These were all unique meetings about different topics with different participants.
At these meetings, we handed a short (1/2 page) survey to attendees seeking their phone number and email address for follow up. We then surveyed these meeting attendees by phone or email and asked them to fill out a longer questionnaire. Twenty Carroll County attendees completed the questionnaire (77% response rate), 51 Tippecanoe County attendees completed the questionnaire (82% response rate), and 78 Lake County attendees completed the questionnaire (67% response rate).
Figure 1.
Map of Indiana with Three
Studied Counties Highlighted
In order to reach a more general audience of individuals not attending public meetings, we purchased addresses from Survey Sampling International (SSI) that fulfilled the following criteria: (a) 25% oversample for men and women age 18-34 (an age range most likely to not have a landline and so be unaccounted for in SSI's database); (b) as a random sample, it should match the census data for each county as closely as possible; (c) as many records as possible should have phone numbers attached; and (d) remaining addresses should be supplemented from a database with no phone numbers.
This general audience was surveyed in multiple ways.
- Everyone received an advance letter with a website address linking to the survey. If people filled the survey out online, they received no further contact.
- People with phone numbers were then contacted by phone at least three times. If they did not respond by phone, they received a mailed copy of the survey one time.
- People without phone numbers received multiple mailings: survey, postcard, survey, survey. Each mailing included a website address, and people could elect to take the survey online instead of completing the paper copy.
Once respondents completed the survey, they did not receive further contact. All respondents were entered into a drawing to win a $30 cash prize if the survey was completed before a certain date.
Response rates for the general population surveys ranged from 21-33% by county. Specifically, in Carroll County, the response rate was 30% (182/605 good addresses); in Tippecanoe County, the response rate was 33% (203/617 good addresses); and in Lake County, the response rate was 21% (136/647 good addresses).
The data from all three counties (including both meeting attendees and non-attendees) were merged into one database. The quantity of interest is whether or not individuals participate in public meetings on the environment. Thus the answer to our core survey question is "yes" or "no." The model that best captures this outcome is a logistic or logit equation, where the likelihood of a 0 or 1 outcome is estimated using maximum likelihood regression analysis. Other forms of analysis, such as the standard regression, expect outcomes that have a broader spectrum of answers, ranging, for example, from negative infinity to positive infinity, and thus would be inappropriate for our analysis. To interpret the results from a logistic regression, it is easiest to use odds ratios that are computed from the beta coefficients. When the odds ratio is greater than 1 for an independent variable, it means that the probability of the dependent variable being "yes," i.e., someone participated, is higher the higher the score on the independent variable. We used Stata 11.0 to analyze the data.
Results
Table 1 shows variables that significantly determined meeting attendance in at least one county. (Other variables from the dataset are not presented here for ease of presentation.) One noticeable difference between these models is the difference in R2. This model explains only 13% of the variation in meeting attendance is in Lake County, the most urban and diverse county, compared to 31% in Tippecanoe County and 44% in Carroll County. This is a large distribution of R2 for the same question and indicates that different things are happening in the three counties.
| Survey Question | Lake County: Odds Ratio | Tippecanoe County: Odds Ratio | Carroll County: Odds Ratio |
| My community is a good place to raise a family | 1.03 | 0.31** | 0.19** |
| In my community, I find that people try to look at everybody's side of a disagreement before making decisions | 1.46 | 2.11** | 0.85 |
| In the past year, did you do any volunteer work? | 0.26*** | 0.15*** | 0.026*** |
| Lack of free time limits my involvement in environmental activities. | 1.04 | 2.00 | 2.79** |
| My work schedule limits my involvement in environmental activities. | 1.20 | 0.46** | 0.81 |
| The balance of nature is delicate and easily upset. | 0.54* | 3.1*** | 0.84 |
| How often do you listen to local radio stations for news? | 0.98 | 1.52** | 0.61 |
| What is your gender? (male = 1, female = 2) | 0.61 | 0.37** | 2.71 |
| What is the highest level of formal education you have completed? | 1.20 | 1.20 | 1.81*** |
| Do you have children under the age of 18 living in your household? | 1.42 | 2.5* | 0.99 |
| R squared | 0.13 | 0.31 | 0.44 |
| Note: Variables that are insignificant across
all counties are deleted from this table. p<.1 *, p< .05 **, p< .01 *** |
|||
The only variable that is significant across all three counties is "In the past year, did you do any volunteer work." This is not a surprising finding because the propensity to volunteer in future community activities should strongly correlate with actually attending a public meeting in the past.
Positive attitudes towards the community as measured by agreement with the statements "My community is a good place to raise a family" and "In my community, I find that people try to look at everybody's side of a disagreement before making decisions" are not significant across all three counties. Most notably, these variables are not significant in Lake County.
Agreement with the statement "Lack of free time limits my involvement in environmental activities" is positively associated with increased involvement only in Carroll County. Conversely, agreement with the statement "my work schedule limits my involvement in environmental activities" is significantly (and negatively) associated with participation in only Tippecanoe County.
Only one question from a series of questions on the survey about environmental attitudes, "the balance of nature is delicate and easily upset," was significant, and it has opposite effects in the counties. In Lake County, people who agreed with this statement were less likely to have attended meetings, while in Tippecanoe County they were more likely to have attended meetings.
Listening to local news increases the probably of attending a meeting in Tippecanoe County only. Education is a predicator of participation only in Carroll County. Females are significantly less likely to attend meetings in Tippecanoe County; however, respondents with young children in the household are significantly more likely to go to meetings in this county.
Discussion and Conclusions
The original study hypothesis was that context would not matter in terms of individual motivations for participation. However, this hypothesis was not supported by our data. Context influences who participates in public meetings on the environment. Earlier studies found factors such as education level to be important determinants of participation, but in our case they were not important across all counties. Controlling for other variables, education was only a significant predictor of participation in Carroll County, the most rural county.
The findings about gender and children in the house are especially interesting because they contradict past studies. These results highlight the importance of understanding the local culture. Earlier work in this field has indicated that men are more likely to attend meetings and that young children in the household are a liability. However, our results did not support this finding. It indicates that simple solutions to getting more people out, such as providing child care, may not be sufficient in Tippecanoe County because people with young children are already more likely to attend meetings.
Scott argues that "so many well-intended schemes to improve the condition have gone so tragically awry" (Scott, 1998: 4) precisely because they lack "localness." That is, "a mechanical application of generic rules that ignores these particularities is an invitation to practical failure, social disillusionment, or both" (Scott, 1998: 318). We have uncovered strong evidence through our research that no single solution to the "participation problem" exists and that simply applying any cookie-cutter approaches would likely have only occasional success. Therefore, it is critically important to have local Extension personnel who can understand the local context so Extension can continue to bring people together to make decisions about their communities.
Acknowledgments
Funding for the study reported here was provided by a Mission Oriented Grant from Purdue University's College of Agriculture and a grant from the Purdue Climate Change Research Center. Those interested in seeing the survey can contact the lead author.
References
Aldrich, D. P. (2008). Site fights: Divisive facilities and civil society in Japan and the West. Ithaca, NY and London: Cornell University Press.
Alinsky, S. D. (1971). Rules for radicals: A pragmatic primer for realistic radicals. New York: Vintage Books.
Batson, C. D., Ahmad, N., & Tsang, J. (2002). Four motives for community participation. Journal of Social Issues. 58(3): 429-445.
Beierle, T. C. (2002). The quality of stakeholder-based Decisions. Risk Analysis, 22(4): 739-749.
Checkoway, B. (2001) Renewing the civic mission of the American research university. The Journal of Higher Education, 72(2), 125-147.
Daley, D. M. (2007). Citizen groups and scientific decisionmaking: Does public participation influence environmental outcomes? Journal of Policy Analysis and Management, 26(2): 349-368.
Dietz, T., & Stern, Paul C. (eds) (2008). Public participation in environmental assessment and decision making. Washington, D.C.: The National Academies Press.
Jolley, G. J. (2007). Public involvement tools in environmental decision-making: A primer for practitioners. Journal of Extension, 45(2) [On-line] Article 2TOT3. Available at: https://www.joe.org/joe/2007april/tt3.php
King, G., Keohane, R., & Verba, S. (1994). Designing social inquiry: Scientific inference in qualitative research. Princeton: Princeton University Press.
Koehler, B., & Koontz, T. M. (2008). Citizen participation in collaborative watershed partnerships. Environmental Management. 41: 143-154.
Lauber, T .B., & Knuth, B .A. (2000). Citizen participation in natural resource management: A synthesis of HDRU research. HDRU Series No. 00-7. Cornell University.
Marshall, B. K., & Jones, R. E. (2005). Citizen participation in natural resources management: Does representativeness matter? Sociological Spectrum. 25: 715-737.
McAvoy, Gregory. (1999). Controlling technocracy: Citizen rationality and the NIMBY syndrome. Washington DC: Georgetown Univ. Press.
McKinney, M., & Harmon, W. (2002). Public participation in environmental decision making: Is it working? National Civic Review, 91(2): 149-170.
Peters, S. J. (2002). Rousing the people on the land: The roots of the educational organizing tradition in Extension work. Journal of Extension, 40(3) [On-line] Article 3FEA1. Available at: https://www.joe.org/joe/2002june/a1.php
Putnam, R. D. (2000). Bowling alone: The collapse and revival of American community. New York: Simon and Schuster.
Scott, J. C. (1998). Seeing like a state: How certain schemes to improve the human condition have failed. New Haven: Yale University Press.
Smith, T. J. (2005). Ethnic and gender differences in community service participation among working adults. Journal of Extension, 45(2) [On-line] Article 2RIB1. Available at: https://www.joe.org/joe/2005april/rb1.php
U.S. Census Bureau (2010). State and county QuickFacts. Retrieved from http://quickfacts.census.gov.