April 2012
|
April 2012 // Volume 50 // Number 2 // Feature // v50-2a1


Evidence of Impact: Examination of Evaluation Studies Published in the Journal of Extension
Abstract
Research was conducted to explore the level of evidence of impact collected through program evaluation (outcome studies) by Extension as published in JOE. Articles reviewed were those listed under the headings of "Feature Articles" and "Research in Brief" in 5-year increments (1965-69, 1975-79, 1985-89, 1995-99, and 2005-09). The design used a form of quantitative content analysis. The data indicate that 88.5% of the articles documented evidence above the level of participation and that almost two-thirds were measuring outcomes; however, only 5.6% documented long-term outcomes. The findings have implications for improving Extension's public value through documented evidence of impact.
Introduction
Documenting evidence of impact demonstrates that organizations and programs are making a difference and/or accomplishing something positive. As competition increases and the availability of financial resources decreases, the U.S. Cooperative Extension System must demonstrate that it is worth funding (O'Neill, 1998). Extension must create new as well as improve existing programs so that they continue to make an impact and positively benefit a dynamic society.
A review of the literature in the Journal of Extension (JOE) shows that accountability continues to be very important as funding and resources become increasingly limited (Kelsey, 2008; O'Neill, 1998; Decker & Yerka, 1990). However, accountability should not be the only purpose for evaluation in Extension. It has been reported that evaluations should be 75% useful to the programmer (i.e., improvement/effectiveness) and 25% useful for administrative reporting needs (i.e., accountability) (Decker & Yerka, 1990).
After citing supporting articles published in JOE as evidence, Richard Stup (2003) stated that Extension must increase evaluation efforts in order to generate systematic and convincing evidence of programming value. His intention was to not only show that better documentation of value will help with the continuation of funding, but that additional funding can also be acquired from external sources for programs with documented value. Laura Kalambokidis (2011, 2004) made the point that simply documenting private value can demonstrate impact and justify user fees or private funding; however, Extension must focus on public value due to its public funding structure.
Impact
The results of an evaluation should not just be a review or account of what happened. Funders often want to see measures of program effectiveness in addition to descriptive reports of activities (O'Neill, 1998). In Extension, evaluation should not only determine what resulted from programs, but also determine the impact of programs. Impact represents a higher level of results or accomplishments. Keith Diem (2003) defined impact in Extension "as the positive difference we make in people's lives as a result of the programs we conduct." The results of a program must ultimately change people's attitudes or behavior, or benefit society in other ways (Diem, 1997).
Two models have stood out when documenting impact of Extension programs, historically and currently. These models are Bennett's Hierarchy and the logic model.
Bennett's Hierarchy
Claude Bennett (1975) developed a hierarchy specifically for Extension to document evidence of program impacts. His seven-link "chain of events" is shown in Figure 1. Inputs (level 1) include the resources invested by Extension, such as time, money, and staff. The inputs produce activities (level 2) (e.g., meetings, sessions, workshops, or events) involving people (level 3) who have both good and bad reactions (level 4). In a productive program, participants will likely change their knowledge, attitudes, skills, or aspirations (KASA) (level 5) as a result of the programming. Practice change (level 6) occurs if the KASA are actually applied. End results (level 7) are the broader outcomes, effects, and benefits to the community or society such as increased profits, better health, or cleaner environment. Level 7 demonstrates public value and documents the benefit for people beyond the participants who may not have had direct contact with the program (Kalambokidis, 2011).
Figure 1.
A Hierarchy of Evidence for
Program Evaluation (recreated from Bennett, 1975)
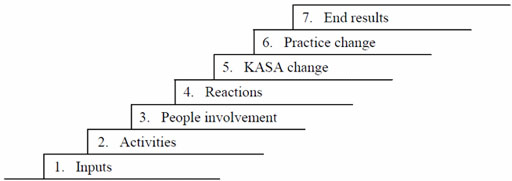
In Bennett's Hierarchy of Evidence, true impact increases as one goes up the hierarchy because the lower levels are important precursors, but are not necessarily evidence of impact (Diem, 2003). Evaluation at any of the seven levels may help in decision-making, but real impact typically occurs above the level of simply involving people. Evidence of more significant impact would be measured at the levels of practice change and end results (Diem, 2003).
Logic Model
The modern logic model, in which Bennett's Hierarchy was a forerunner, has achieved widespread adoption within Extension during the past 15 years (Taylor-Powell & Boyd, 2008). The term "logic model" was first mentioned in the 1960s. The publications produced by the United Way of America in 1996 and the W. K. Kellogg Foundation in 2001 significantly helped to increase its popularity and use worldwide (Knowlton & Phillips, 2009). It is a systematic and visual way to present and share your understanding of the relationship among resources you have to operate your program, the activities you plan, and the changes or results you hope to achieve (W. K. Kellogg Foundation, 2004). The logic model terminology, components, and structure may vary somewhat across organizations and individuals; the University of Wisconsin-Extension (UWEX) logic model format as shown in Figure 2 was used for purposes of the study described in this article.
Figure 2.
Program Action—Logic Model
(Taylor-Powell, Steele, & Douglah, 1996)
The UWEX logic model format has evolved since 1995, when it was originally created for Extension in response to the Government Performance and Results Act (GPRA) of 1993 (Taylor-Powell & Henert, 2008). It includes the following components: situation/priorities (level 1), inputs (level 2), outputs-activities (level 3), outputs-participation (level 4), short-term outcomes (level 5), medium-term outcomes (level 6), long-term outcomes (level7). When documenting impact, outcomes are much more important and provide much stronger evidence than outputs.
The United Way (1996) made the distinction that outputs are about the program, while outcomes are about the participants. Short-term outcomes are considered to be immediate, such as changes in awareness, knowledge, skills, attitudes, opinions, and intent (Taylor-Powell & Henert, 2008). Medium-term outcomes are considered to be intermediate, such as changes in behaviors, decision-making, and actions (Taylor-Powell & Henert, 2008). Long-term outcomes are the final outcomes (synonymous with impact), such as changes in social, economic, civic, and environmental conditions (Taylor-Powell & Henert, 2008).
Much of Bennett's Hierarchy is embedded within the logic model. For example, the UWEX logic model format directly shows inputs, activities, and participation. KASA change would be considered as short-term outcomes, behavior change as medium-term outcomes, and end results as long-term outcomes. Also, similar to level 7 of Bennett's Hierarchy, long-term outcomes in the logic model contribute to the public value of Extension, in which the program can benefit communities and people beyond the program participants (Kalambokidis, 2011).
Reaction is the only aspect of Bennett's Hierarchy that is not directly represented within this logic model format; however, satisfaction is typically included as a part of participation in the logic model and can be considered as a form of reaction. Just as evidence of impact increases as one goes up Bennett's Hierarchy, evidence of impact also increases as one goes from left to right when using the UWEX format.
The recent widespread use and adoption of the logic model in Extension (in place of Bennett's Hierarchy) is likely a result of the logic model's diverse usefulness for program planning and grant writing purposes in addition to evaluation reporting (Taylor-Powell & Boyd, 2008).
Problem Statement, Purpose, and Objectives
Too often, Extension personnel fail to document impact of programs by collecting real evidence of behavior change or greater end results that benefit society. Traditionally, the criticism of evaluation in Extension has been that evaluators have simply reported on the number and demographics of the people who participated (Gentry-Van Laanen & Nies, 1995). Most program evaluation simply stops at the reaction level (reports on inputs, activities, people involvement, and reactions) or learning (KASA change) without measuring higher-level changes (Stup, 2003).
The research reported here was conducted to explore and describe the level of evidence of impact collected through program evaluation (outcome studies) by the Cooperative Extension System as published in the Journal of Extension. Impact was operationally defined as program effectiveness determined by the highest level of evidence collected. The level of evidence was quantified by coding ordinal data according to the components of Bennett's Hierarchy (ranging from 1- inputs to 7 - end results) and the UWEX logic model format (ranging from 1- situation/priorities to 7 - long-term outcomes). The investigation consisted of a thorough review of the articles using program evaluation that were published in JOE under the headings of "Feature Articles" and "Research in Brief" from 1965-2009, consisting of five separate 5-year periods (1965-69, 1975-79, 1985-89, 1995-99, and 2005-09).
The objectives were:
- To determine the number of program evaluations (only those reporting outcome data) published in JOE during the years investigated and the program areas represented in these evaluation studies.
- To review a subset of articles published in JOE from 1965-2009 in order to determine the number and percent of evaluation studies that reached each level of evidence of impact according to both Bennett's Hierarchy and the logic model.
- To identify any trends.
Methods
The research design used a form of quantitative content analysis where data were collected and coded using qualitative methods and analyzed using quantitative methods. Riffe, Lacy, and Fico (1998) defined quantitative content analysis as the systematic and replicable examination of symbols of communication, which have been assigned numeric values according to valid measurement rules. It is the analysis of relationships involving those values using statistical methods, in order to describe the communication, draw inferences about its meaning, or infer from the communication to its context, both of production and consumption (Riffe et al., 1998).
Articles pertaining to program evaluation were selected by adapting similar procedures previously developed and used by Michael Duttweiler (2008). The operational definition used for evaluation was any work that involved "the systematic acquisition and assessment of information to provide useful feedback about some object" (Trochim, 2006). Just like Duttweiler's (2008) investigation, articles selected had to expressly reference the acquisition and use of programmatic information. Consequently, articles not selected were those that were commentaries on evaluation needs or methods without reference to supporting evaluation data, applied research reports in content areas that might inform Extension curricula but that did not specifically address educational processes, and descriptions of evaluation resources or methods without reference to application data (Duttweiler, 2008).
For the study reported here, more restrictive selection procedures were developed to ensure that only outcome studies were selected. The nature of evaluation questions is typically described by the terms "needs assessment," "process or monitoring studies," or "outcome studies." Outcome studies are concerned with describing, exploring, or determining changes that occur in program recipients, secondary audiences, or communities as a result of the program (Fitzpatrick, Sanders, & Worthen, 2003). As a result of outcome studies, evaluators might use findings to create a simple report of what activities occurred or how many people participated, or they might produce a detailed report with hard evidence showing impact and greater benefits to society.
JOE was chosen because it is the official refereed journal of the Cooperative Extension System (Extension Journal, Inc., 2010). The investigation used only those articles contained under the categories of "Feature Articles" and "Research in Brief" (N = 1,246). Articles published under these headings typically contained enough depth and detail necessary to complete the instrument. Furthermore, these articles were double-blind reviewed by multiple (three) reviewers whereas articles published under 'Ideas at Work' were blind reviewed by a single reviewer.
Instrumentation
The instrumentation procedures were best described as using a researcher-completed observation form or tally sheet (Fraenkel & Wallen, 2006). A rubric was created to help ensure that data were collected accurately and consistently.
The instrument had three sections (organizational information, Stage I, Stage II). The first portion consisted of organizational data (similar to demographic data). This section included the publication year, volume, number, lead author's last name, and the category of JOE in which the article was listed. The second portion of the questionnaire was completed during Stage I by screening the abstracts/articles to determine if the article should be selected for formal data collection. The third portion consisted of the actual data collection (Stage II), which involved coding and completing the questionnaire.
Completion of the entire instrument required reading and reviewing both the abstracts and articles. Portions of the data-recording process were somewhat subjective because the researcher had to make a judgment during the screening process as to whether the abstract pertained to the evaluation of existing Extension programming. Furthermore, the researcher had to make some judgments in determining the level of evidence of impact collected. Due to the subjective nature of the data collection, the instrument was initially field tested for face and content validity and pilot tested for reliability. Furthermore, to ensure consistency over this very time-consuming and repetitive process, various estimates of inter-coder agreement (inter-rater reliability) and intra-coder agreement (intra-rater reliability) were calculated. Percent agreement for Stage I was 87.9% and 72.6% (inter-coder) and 100% (intra-coder). Percent agreement for Stage II was 83.8% and 66.3% (inter-coder) and 100% (intra-coder).
Data Collection and Analysis
All data used were manually collected and entered into the instrument by a single individual. Prior to beginning the formal data collection process, the researcher conducted numerous field tests with volumes published during various decades to help work out any problems and inadequacies of the instrumentation procedures and to create the rubric. This trial-and-error practice was considered to be a normal and required part of the process when using content analysis and coding data.
Data were analyzed to satisfy each objective using SPSS 18.0. Frequencies and percentages were calculated to report descriptive information for the articles that were reviewed. In addition, the nonparametric Kruskal-Wallis test was used to calculate mean ranks.
Results
Objective 1 was to determine the number of program evaluations (outcome studies) published and the program areas represented. Three hundred two (24.2%) articles were selected (out of 1,246 total articles) that met the established criteria as "evaluation" studies with outcome data. These were limited to articles published in JOE under the headings of "Feature Articles" and "Research in Brief" during 1965-69, 1975-79, 1985-89, 1995-99, and 2005-09.
As shown in Table 1, the program area of Family and Consumer Sciences was represented the most, with 41.1% of all evaluative articles. Agriculture and Natural Resources followed closely at 39.7% of the articles. The program area of 4-H Youth Development was represented in 31.1% of the articles, and Community and Economic Development comprised 15.6% of the articles.
| Frequency | Percent | |
| Family and Consumer Sciences | 124 | 41.1 |
| Agriculture and Natural Resources | 120 | 39.7 |
| 4-H Youth Development | 94 | 31.1 |
| Community and Economic Development | 47 | 15.6 |
Objective 2 was to review the selected articles (302) in order to determine the number and percentage of studies that reached each level. The most frequently reported level of evidence measured for Bennett's Hierarchy and the UWEX logic model was KASA change and short-term outcomes (level 5), respectively, for 29.8% of the articles. Bennett's reaction level data (level 4) corresponds with both level 3 and level 4 of the UWEX logic model; therefore, the percents reported in Table 3 were lower than those seen in Table 2. The majority of articles (62.6%) were measuring outcomes (levels 5-7).
| Frequency | Percent | |
| 1) Inputs | 8 | 2.6 |
| 2) Activities | 10 | 3.3 |
| 3) People Involvement | 17 | 5.6 |
| 4) Reactions | 78 | 25.9 |
| 5) KASA Change | 90 | 29.8 |
| 6) Practice Change | 82 | 27.2 |
| 7) End Results | 17 | 5.6 |
| Total | 302 | 100.0 |
| Frequency | Percent | |
| 1) Situation/Priorities | 2 | 0.7 |
| 2) Inputs | 6 | 2.0 |
| 3) Outputs-Activities | 55 | 18.2 |
| 4) Outputs-Participation | 50 | 16.6 |
| 5) Short-Term Outcomes | 90 | 29.8 |
| 6) Medium-Term Outcomes | 82 | 27.2 |
| 7) Long-Term Outcomes | 17 | 5.6 |
| Total | 302 | 100.1 |
Objective 3 was to identify any trends. As reported in Tables 4 and 5, the number of outcome evaluation articles has increased over the years, going from 16 articles in the 1960s to 150 articles in the 2000s. A higher percentage of evaluative studies collected lower levels of evidence in the 1960s and 1970s. However, for KASA change and short-term outcomes, percentages have remained fairly consistent over time, with a dip in the 1980s. Practice change and medium-term outcomes were most frequently reported in the 2000s. Documentation of end results and long-term outcomes has remained relatively low throughout the years.
| Inputs | Activities | People Involvement | Reactions | KASA Change | Practice Change | End Results | Total | |
| 1960s | 2 (12.5) | 2 (12.5) | 3 (18.8) | 3 (18.8) | 5 (31.3) | 0 (0.0) | 1 (6.3) | 16 |
| 1970s | 1 (6.3) | 3 (18.8) | 0 (0.0) | 3 (18.8) | 5 (31.3) | 4 (25.5) | 0 (0.0) | 16 |
| 1980s | 2 (4.9) | 2 (4.9) | 2 (4.9) | 14 (34.2) | 5 (12.2) | 14 (12.2) | 2 (4.9) | 41 |
| 1990s | 1 (1.3) | 3 (3.8) | 2 (2.5) | 24 (30.4) | 27 (34.2) | 18 (22.8) | 4 (5.1) | 79 |
| 2000s | 2 (1.3) | 0 (0.0) | 10 (6.7) | 34 (22.7) | 48 (32.0) | 46 (30.0) | 10 (6.7) | 150 |
| Total | 8 (2.6) | 10 (3.3) | 17 (5.6) | 78 (25.9) | 90 (29.8) | 82 (27.2) | 17 (5.6) | 302 |
| Situation/ Priorities | Inputs | Outputs-Activities | Outputs-Participation | Short-Term Outcomes | Medium-Term Outcomes | Long-Term Outcomes | Total | |
| 1960s | 1 (6.3) | 1 (6.3) | 2 (12.5) | 5 (31.3) | 5 (31.3) | 0 (0.0) | 1 (6.3) | 16 |
| 1970s | 0 (0.0) | 1 (6.3) | 5 (31.3) | 1 (6.3) | 5 (31.3) | 4 (25.5) | 0 (0.0) | 16 |
| 1980s | 0 (0.0) | 2 (4.9) | 10 (24.4) | 8 (19.5) | 5 (12.2) | 14 (12.2) | 2 (4.9) | 41 |
| 1990s | 0 (0.0) | 1 (1.3) | 16 (20.3) | 13 (16.5) | 27 (34.2) | 18 (22.8) | 4 (5.1) | 79 |
| 2000s | 1 (0.7) | 1 (0.7) | 22 (14.7) | 22 (14.7) | 48 (32.0) | 46 (30.0) | 10 (6.7) | 150 |
| Total | 2 (0.7) | 6 (2.0) | 55 (18.2) | 50 (16.6) | 90 (29.8) | 82 (27.2) | 17 (5.6) | 302 |
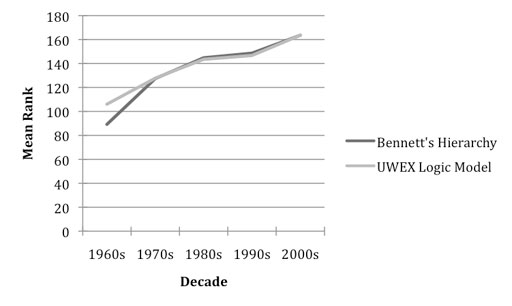
The Kruskal-Wallis test was used to calculate mean ranks for each of the decades. Figure 3 displays the differences between the decades and illustrates the trend as well as the leveling that occurred during the 1980s. In addition, Figure 3 shows more separation between the models during the early decades as lower levels of evidence were more frequently documented.
Figure 3.
Trend of Mean Ranks
Conclusions/Implications
The research reported here was initiated to explore the use of outcome program evaluation as published in JOE and the documentation of evidence of impact in Extension programming. About one-fourth (302/1,446) of the articles, during the applicable years (1965-69, 1975-79, 1985-89, 1995-99, & 2005-09) addressed programmatic outcome data.
The number of outcome evaluative studies during the applicable years has increased from 16 articles in the 1960s to 150 articles in the 2000s. The findings showed that 88.5% of the articles documented evidence above the level of participation (levels 4-7), almost two-thirds (62.6%) measured outcomes (levels 5-7), about one-third (32.8%) measured evidence of "substantial" impact (levels 6-7), and 5.6% documented "true" impact (level 7). The terms "substantial" and "true" were adapted from Diem's (2003) description of Bennett's Hierarchy.
The implications for Extension are that more higher-level evidence of impact is needed. Findings suggest that Extension does document more than number of participants. Findings also suggest that Extension usually documents outcomes; however, the higher-level outcomes are much less common. The ultimate goal of Extension should be "true" impact. Extension faces challenges of relevancy and public value in addition to competition for funding. The ultimate goal is to remain relevant and of value to the public. The strongest method to demonstrate relevancy and public value is to document "true impact" (end results/long-term outcomes).
It is likely that Extension programs make a positive difference in the lives of individuals and their communities and that Extension greatly benefits society as a whole; however, more program evaluation with evidence of higher-level impact showing public value is needed to support this argument. When Extension programs benefit others beyond program participants, Extension is able to have a larger impact that is not only important for the community, but also essential to sustain funding and positive political implications (Kalambokidis, 2004; 2011). As funding becomes more limited and much more competitive, the need for impact evaluations will increase. Organizations that have documented evidence of their worth/merit will be the ones that receive funding and continue to exist.
Recommendations
Conducting evaluations using the logic model in tandem with Bennett's Hierarchy is a way to ensure useful program evaluation and accountability. Bennett's terminology was specifically created to describe different levels of evidence of impact. The components of the logic model were designed to help with program planning, development, and evaluation. The components (levels) of Bennett's Hierarchy reinforce the strengths of the logic model.
Bennett's seven levels are ideal to articulate and ensure that evidence of impact is documented. The first three levels (inputs, activities, and people involvement) are about the program. This information can be gathered as the program is conducted from the Extension professional or evaluator as they determine what resources were used, what occurred, and who or how many attended. The fourth level is reactions, which can be documented by simply asking the participants. A more sophisticated version of the "smile sheet" passed out at the end of a session or program can be used to collect reactionary data. The fifth level is KASA change. This level of evidence can be documented by using a pretest/posttest or some form of testing (i.e., post-then-pre), which goes beyond collecting satisfaction or reactionary data. The sixth level is practice change. Practice change can be measured by using survey methods after sufficient time has passed following program completion. Participants must have adequate time to apply and practice their new knowledge before one can determine if adoption or behavior change has actually occurred. The seventh and final level is end results. This requires a change in social, economic, civic, or environmental conditions. To demonstrate public value, the evaluator must wait until ample time has passed following practice change in order to determine the effect on society.
A potential rule of thumb for evaluating Extension programming is as follows: (1) collect reaction data at the end of each session or program; (2) collect KASA change data with a pretest at the beginning and posttest at the end of each session or program; (3) collect practice change data 6 months to 2 years following program completion; and (4) collect data regarding the end results 3 to 5 years following program completion. Time frame may vary depending on program content and context. This might be regarded as difficult, time consuming, and requiring too many years, but it should also be regarded as necessary in documenting the best possible evidence of impact and value.
References
Bennett, C. (1975). Up the hierarchy. Journal of Extension [On-line], 13(2). Available at: https://www.joe.org/joe/1975march/1975-2-a1.pdf
Decker, D. J., & Yerka, B. L. (1990). Organizational philosophy for program evaluation. Journal of Extension [On-line], 28(2) Article 2FRM1. Available at: https://www.joe.org/joe/1990summer/f1.php
Diem, K. G. (1997). Measuring impact of educational programs. Rutgers Cooperative Extension fact sheet #869. New Brunswick, NJ: Rutgers University.
Diem, K. G. (2003). Program development in a political world—It's all about impact! Journal of Extension [On-line], 41(1) Article 1FEA6. Available at: https://www.joe.org/joe/2003february/a6.shtml
Duttweiler, M. W. (2008). The value of evaluation in Cooperative Extension. In M. T. Braverman, M. Engle, M. E. Arnold, & R. A. Rennekamp (Eds.), Program evaluation in a complex organizational system: Lessons from Cooperative Extension. New Directions for Evaluation, 120, 87-100.
Extension Journal, Inc. (2010). About the Journal of Extension (JOE). Available at: https://www.joe.org/about-joe.php
Fitzpatrick, J. L., Sanders, J. R., & Worthen, B. R. (2004). Program evaluation: Alternative approaches and practical guidelines (3rd ed.). Boston MA: Pearson.
Fraenkel, J. R., & Wallen, N. E. (2006). How to design and evaluation research in education (6th ed.). Boston, MA: McGraw-Hill.
Gentry-Van Laanen, P., & Nies, J. I. (1995). Evaluating Extension program effectiveness: Food safety education in Texas. Journal of Extension [On-line], 33(5) Article 5FEA4. Available at: https://www.joe.org/joe/1995october/a4.php
Kalambokidis, L. (2004). Identifying the public value in Extension programs. Journal of Extension [On-line], 42(2) Article 2FEA1. Available at: https://www.joe.org/joe/2004april/a1.php
Kalambokidis, L. (2011). Spreading the word about Extension's public value. Journal of Extension [On-line], 49(2) Article 2FEA1. Available at: https://www.joe.org/joe/2011april/a1.php
Kelsey, K. D. (2008). Do workshops work for building evaluation capacity among Cooperative Extension Service faculty? Journal of Extension [On-line], 46(6) Article 6RIB4. Available at: https://www.joe.org/joe/2008december/rb4.shtml
Knowlton, L. W., & Phillips, C. C. (2009). The logic model guidebook: Better strategies for great results. Los Angeles, CA: Sage Publications Inc.
O'Neill, B. (1998). Money talks: Documenting the economic impact of Extension personal finance programs. Journal of Extension [On-line], 36(5) Article 5FEA2. Available at: https://www.joe.org/joe/1998october/a2.php
Riffe, D., Lacy, S., & Fico, F. G. (1998). Analyzing media messages: Using quantitative content analysis in research. Mahwah, NJ: Lawrence Erlbaum Associates, Inc.
Stup, R. (2003). Program evaluation: Use it to demonstrate value to potential clients. Journal of Extension [On-line], 41(4) Article 4COM1. Available at: https://www.joe.org/joe/2003august/comm1.php
Taylor-Powell, E., & Boyd, H. H. (2008). Evaluation capacity building in complex organizations. In M. T. Braverman, M. Engle, M. E. Arnold, & R. A. Rennekamp (Eds.), Program evaluation in a complex organizational system: Lessons from Cooperative Extension. New Directions for Evaluation, 120, 55-69.
Taylor-Powell, E., & Henert, E. (2008). Developing a logic model: Teaching and training guide. Madison, WI: University of Wisconsin-Extension, Cooperative Extension, Program Development and Evaluation. Retrieved from: http://www.uwex.edu/ces/pdande/evaluation/pdf/lmguidecomplete.pdf
Taylor-Powell, E., Steele, S., & Douglah, M. (1996). Planning a program evaluation. University of Wisconsin-Extension-Cooperative Extension, Program Development and Evaluation Unit Web site. Retrieved from: http://www.uwex.edu/ces/pdande/evaluation/evaldocs.html
Trochim, W. M. (2006, October 20). The research methods knowledge base (2nd ed.). Retrieved from: http://www.socialresearchmethods.net/kb/intreval.php
United Way of America. (1996). Measuring program outcomes: A practical approach. Arlington, VA: United Way of America.
W. K. Kellogg Foundation. (2004). Logic model development guide. Battle Creek, MI: W. K. Kellogg Foundation.