December 2011
|
December 2011 // Volume 49 // Number 6 // Research In Brief // v49-6rb9


An Assessment of Current Feeding Practices in Louisiana Dairy Farms
Abstract
A survey of producers was conducted to determine feeding practices on Louisiana dairy farms. A 38.5% response rate among dairy farmers was obtained. Declared herd size averaged 108 Holstein milking cows producing 15,613 lbs/cow/year. Most producers relied on pastures as primary forage source for the cows. Pastures were supplemented with concentrates offered twice daily. Most farmers formulated rations and reported knowing dietary protein, but less than 20% of the respondents acknowledged dietary P content. Producers and company nutritionists should be targeted by Extension programs intended to inform about P feeding recommendations and environmental effects of excess P.
Introduction
Noxious algae blooms and loss of biodiversity can be a result of water eutrophication and acidification following nitrogen (N) and phosphorus (P) enrichment (Conley et al., 2009). Livestock operations contribute to N and P enrichment in manure and fertilizer runoff. The most efficient approach to reduce the amount of N lost from animal manure to the environment is to reduce inputs, i.e., reduce protein content in the feed while maintaining production levels (Monteny & Erisman, 1998). In dairy cattle, excess N and P are excreted primarily in urine and feces, respectively. The proportion of N that is excreted in dairy cows urine increases with protein intake (NRC, 2001).
Reduction in N excretion can be achieved by adjusting protein degradability and amino acid supplies to the small intestine that allow for dietary crude protein (CP) concentration reduction (NRC, 2001). Nitrogen loss decreased by 63% when dietary protein fed to lactating cows was reduced from 20% to 14.7% in one study (Smits, Valk, Elzing, & Keen, 1995). For P, farm mass balance was reduced 49% by feeding low P diets when precision feeding was implemented in two herds in the Northeast United States (Cerosaletti, Fox, & Chase, 2004). Therefore, by reducing the total amount of CP and P fed and/or closely matching the amount of CP and P fed with the amount required by the animal, it will be possible to reduce N and P excreted and lost to the environment.
The next logical step would be to share the information with farmers so that N and P output reductions can be accomplished. However, current practices need to be routinely assessed before appropriate corrective recommendations can be made to dairy producers. A number of surveys have been conducted in the Unites States with the goal to report on the P feeding practices of commercial dairy farms (Dou et al., 2003; Downing, French, Peters, & Higgs, 2007; Sansinena, Bunting, Stokes, & Jordan, 1999). In the Northeast and Mid-Atlantic regions, 612 farms reported feeding an average dietary P of 0.44% and ranged from 0.36 to 0.70% of feed DM (Dou et al., 2003). A slightly lower P level (0.40%) was fed to lactating cows in a survey of 37 dairy farms in Oregon (Downing et al., 2007). In the Mid-South region, Sansinena et al. (1999) suggested dairy nutritionists were recommending P levels well above cow needs.
Very little information assessing producers' knowledge about feeding practices in their dairy operations has been gathered at the present time, especially in the Southeast United States. Without a specific account of the current situation, it is and will continue to be very difficult to make recommendations on a realistic target CP and P dietary level. The primary objective of the present study was to determine feeding practices on Louisiana dairy farms.
Material and Method
Survey
A survey was conducted according to Dillman (2000) and in compliance with the Louisiana State University Institutional Board Review. Suggestions were incorporated into the survey after a draft was reviewed by local dairyman and Extension and research personnel.
The targeted population of interest was dairy farms producing milk for sale in Louisiana. In 2007, the Louisiana lactating cow population (29,000 cows) produced 349 million lbs of milk (USDA-NASS, 2007). A list of 210 dairy farms shipping milk was obtained in October, 2007. The entire farm population was sent a survey. Two mailings were conducted. The first mailing took place in December, 2007, and the second in March, 2008. The second mailing was sent to farmers who had not returned the initial questionnaire. Each mailing contained a survey, a cover letter, and a labeled and stamped envelope for survey return. The cover letter described the study's objective and informed recipients that their participation was voluntary and anonymous. Data collected were presented exclusively on a summarized form, so that information on individual producers is protected.
The survey consisted of 18 multiple choice and open- or closed-ended questions. Eight fill-in-the-blank questions were included. The survey included questions about farmer demographics, herd characteristics, and feeding management practices. Production and animal count data were collected for year 2006. A total of 83 surveys were returned by May 2008. Two surveys were returned because of non-existing addresses and another was returned unanswered. Therefore 80 of the 208 valid surveys were included in the analysis for a 38.5% response rate. Not every question was answered by survey participants; therefore, percentages are calculated for each individual question using the total number of respondents for that specific question. In addition, respondents could choose more than one answer for a number of questions; therefore, totals may not always equal to 100%.
Statistical Analysis
Data were analyzed using SAS (SAS Institute, 2006). For categorical variables, such as primary breed, the surveyfreq procedure was used to obtain the number of observations, the relative frequency of the event, and the standard error. For continuous variables, such as milk production, both the means and surveymeans procedures were used. The surveymeans procedure was used to get the number of observations, the mean, and the standard error of the mean (SEM). The means procedure was used to obtain the median, minimum value, and maximum value. A population correction factor of 208 was included in the surveymean and surveyfreq procedures. The population used was 208 farms taking into account that two surveys were returned because of incorrect addresses.
Results and Discussion
The average declared herd size was 108 lactating cows producing 15,613 lbs/cow/year (Table 1). According to the 2007 Census of Agriculture (NASS, 2007), Louisiana dairy farms averaged 95 lactating cows/farm in December 31, 2007, with approximately 69% of the herds sized between 50 and 499 head. In our survey approximately 80% of the herds fit that category. The average number of cows and production for 2006 reported in the AgSummary conducted by the Louisiana State University Agricultural Center was 122 head/producer and 13,416 lbs/head/year. The average number of cows/farm for returned surveys was intermediate, suggesting a representative population sample. The 95% confidence interval for the average declared production in the present survey (14,819 - 16,406 lbs/head/year) suggested the declared production was greater than LSU AgCenter's AgSummary report.
| Item | n1 | Mean | SEM2 | Median | Minimum | Maximum |
| Herd size | ||||||
| Milking Cows | 77 | 108.3 | 6.0 | 90.0 | 15.0 | 350.0 |
| Dry Cows | 71 | 27.0 | 3.1 | 27.0 | 2.0 | 200.0 |
| Heifers > 1 yr old | 71 | 39.8 | 3.4 | 30.0 | 0.0 | 200.0 |
| Heifers < 1 yr old | 69 | 37.8 | 3.1 | 30.0 | 0.0 | 125.0 |
| Milk per cow (lbs/year) | 53 | 15,613 | 405 | 15,943 | 2,400 | 28,327 |
| 1n = number of surveys with the question answered. 2SEM = standard error of the mean | ||||||
Holstein was the primary breed in over 81% of returned surveys. A small fraction of respondents (10%) reported use of Holstein x Jersey crosses. Jersey and other breeds accounted for the remaining 9% of surveys.
Most respondents (87% ± 3%) indicated that cows were maintained on pasture for most of the year (Figure 1). That proportion approximately coincides with the number of producers using pasture as one of their primary forage sources (90% ± 3%).
Figure 1.
Primary Housing Type Distribution (%) for Milking Dairy Cows Reported by Survey Respondents (n = 79)
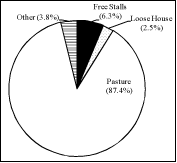
Most cattle consumed forage primarily by grazing (68%). One farmer reported no supplementation to pasture, while approximately 67% of the respondents supplemented pastures with concentrates (Table 2). Total Mixed Ration (TMR) was used in 27% of the herds (Table 2) but only 14.7% used TMR as primary feeding method. This apparent contradiction was probably a result of terminology confusion. A TMR should include all feeds and nutrients offered to cows while the term Partial Mixed Ration (PMR) is often used for a mix of concentrates and forages offered to supplement pasture. An alternative explanation could be that farmers indicated that TMR was fed part of the year, but was not representative of the year as the primary feeding method. Approximately 70% of the respondents offered TMR/PMR/concentrate twice daily.
| Item | n1 | Yes2 | SE3 |
| Primary Feeding Method | ·······%······· | ||
| TMR4 | 11 | 14.7 | 3.2 |
| Grazing | 1 | 1.3 | 1.1 |
| PMR5 | 9 | 12.0 | 3.0 |
| Grazing + grain | 50 | 66.7 | 4.3 |
| Other | 4 | 5.3 | 2.0 |
| Feeding Frequency of TMR/PMR/concentrate | |||
| Never | 10 | 13.7 | 3.2 |
| Every other day | 1 | 1.4 | 1.1 |
| Once per day | 9 | 12.3 | 3.0 |
| Twice per day | 51 | 69.9 | 4.2 |
| More than twice per day | 2 | 2.7 | 1.5 |
| Diet Formulator | |||
| Self | 38 | 50.0 | 4.5 |
| University Extension Specialist | 3 | 4.0 | 1.8 |
| Company Nutritionist | 26 | 34.2 | 4.3 |
| Independent Nutritionist Consultant | 8 | 10.5 | 2.8 |
| Veterinarian | 0 | 0.0 | n/a |
| Other | 1 | 1.3 | 1.0 |
| Number of Diets | |||
| One | 66 | 88.0 | 3.0 |
| Two | 7 | 9.3 | 2.7 |
| Three | 2 | 2.7 | 1.5 |
| Other | 0 | 0.0 | n/a |
| Production Level used in Diet Formulation | |||
| Average of all cows in the group | 45 | 71.4 | 4.5 |
| Average top 10% in the group | 1 | 1.6 | 1.3 |
| Average top 20% in the group | 4 | 6.3 | 2.4 |
| Top Cow | 1 | 1.6 | 1.3 |
| Don't Know | 10 | 15.9 | 3.7 |
| 5 lbs above the group average | 2 | 3.2 | 1.8 |
| 1n = number of surveys who reported an answer. 2YES = percentage of respondents who answered yes. 3SE = standard error. 4 TMR = Total Mixed Ration. 5 PMR = Partial Mixed Ration. | |||
A single ration was formulated for all milking cows on 88% of the farms. The average milk production was used as the goal in 71% of ration balances. Diets were most commonly formulated by the farmer (50.6%) or by a company nutritionist (32.5%).
Pasture was a major feed source, but 21% of those surveyed regularly tested forages (Table 3) and 10 surveys reported forage CP. More than half of respondents reported knowing CP content in the TMR/PMR/concentrate fed. Average reported CP content was 18.3% for concentrate and 16.1% for TMR (Table 4). Farmers fed more similar CP in concentrates (smaller SEM) than in TMR, indicating declared forage CP varied more widely (15% ± 1%).
| Item | n1 | Yes2 | SE3 |
| % | |||
| Do you feed TMR | 73 | 26.0 | 4.1 |
| Do you formulate the same TMR/PMR/concentrate | 75 | 92.0 | 2.5 |
| Do you know the CP content of TMR/PMR/concentrate | 75 | 65.3 | 4.3 |
| Do you know the P content of TMR/PMR/concentrate | 67 | 17.9 | 3.7 |
| Is your forage tested regularly | 75 | 21.3 | 3.7 |
| 1n = number of surveys who reported an answer. 2YES = percentage of respondents who answered yes. 3SE = standard error. | |||
| Item | n1 | Mean | SEM |
| Protein Source | |||
| TMR | 7 | 16.1 | 0.62 |
| Concentrate | 30 | 18.3 | 0.22 |
| Not declared | 11 | 17.5 | 0.48 |
| Forages | 10 | 15.0 | 1.08 |
| 1n= number of surveys who reported an answer. | |||
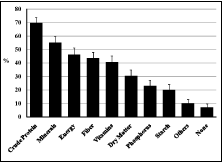
Diets were balanced for at least one nutrient according to 93% of surveys. A breakdown of balanced nutrients is provided in Figure 2. Generally, more than 50% of farmers balanced cows' diets for CP and minerals. Between 40% and 50% of the farmers also balanced for energy, fiber and vitamins. Only 23% of the respondent balanced diets for P.
Figure 2.
Percentage of Survey Respondents Balancing the Milking Dairy Cows Diet For Each One of the Listed Nutrients (n = 69)
Twelve producers (17.9%) reported to know P content in the TMR/PMR/concentrate fed (Table 3). However, only 10 reported an actual value and 4 out of those did not specify if it referred to TMR, PMR, concentrate, or free-choice mineral. Low response rate suggests knowledge of P feeding levels was almost negligible. Similar results were observed in the Northeast and Mid-Atlantic U.S. regions where approximately 15% of surveyed farms reported a dietary P concentration when provided with multiple range type of question (Dou et al., 2003). The discrepancy in CP content vs. P content knowledge could be attributed to several factors. Dietary CP deficiency results in more immediate decrease in milk production while production response to marginal P deficiency is delayed. Milking cows can utilize P more efficiently through gut recycling and bone mobilization, while body CP storage is limited. Concurrently, respondents/ration formulators appeared to be aware that little benefit is obtained from feeding excess dietary CP, given current prices of protein supplements. On the other hand, cost of phosphorus supplements represents only a small fraction of the whole diet. Ration formulators often allow wider safety margins to minimize the risk of P deficiency associated with uncertainties of P contents and of P availability in pasture forages. In fact, Sansinena et al. (1999) indicated that Mid-South dairy nutritionists recommended between 0.45% and 0.50% dietary P for lactating cows. Current NRC (2001) recommendation for dietary P concentration ranges between 0.30% and 0.42% of the diet dry matter.
Summary
Farmers and company nutritionists should be the focus of Extension programs intended to provide information about the effects of excess P on environment if farmers are expected to feed near recommended levels. Educational efforts should include recommendations for ration balancing to include P as well as routine forage analysis to help producers establish a seasonal pattern of P contents in pastures, thus allowing for a more accurate P feeding program.
Acknowledgments
The authors thank all farmers for the responses. The study reported here was funded by the College of Agriculture through an Undergraduate Research grant.
References
Cerosaletti, P. E., Fox, D. G., & Chase, L. E. (2004). Phosphorus reduction through precision feeding of dairy cattle. Journal of Dairy Science, 87, 2314-2323.
Conley, D. J., Paerl, H. W., Howarth, R. W., Boesch, D. F., Seitzinger, S. P., Havens, K. E., Lancelot, C., & Likens, G. E. (2009). Controlling eutrophication: nitrogen and phosphorus. Science, 323, 1014-1015.
Dillman, D. A. (2000). Mail and Internet surveys: the Tailored Design Method. 2nd ed. John Wiley & Sons, New York.
Dou, Z., Ferguson, J. D., Fiorini, J., Toth, J. D., Alexander, S. M., Chase, L. E., Ryan, C. M., Knowlton, K. F., Kohn, R. A., Peterson, A. B., Sims, J. T., & Wu, Z.. (2003). Phosphorus Feeding Levels and Critical Control Points on Dairy Farms. Journal of Dairy Science, 86, 3787-3795.
Downing, T., French, P., Peters, A., & Higgs. K. (2007). Convincing Oregon's Dairy Industry They Have a Problem with Phosphorus. Journal of Extension [On-line] 45(3). Article 3RIB4. Available at: http://www.joe.org/joe/2007june/rb4.php
Monteny, G. J., & Erisman, J. W. (1998). Ammonia emission from dairy cow buildings: a review of measurement techniques, influencing factors and possibilities for reduction. Netherlands Journal Agricultural Science, 46, 227-247.
NRC. (2001). Nutrient requirements of dairy cattle. Natl. Acad. Sci., Washington, DC.
Sansinena, M., Bunting, L. D., Stokes, S. R., & Jordan, E. R. (1999). A survey of trends and rationales for dietary phosphorus recommendations among Mid-South dairy nutritionists. Pages 51-54 in Proceedings Mid-South Ruminant Nutrition Conference, Dallas, TX.
SAS Institute. (2006). SAS 9.1.3 help and documentation. Cary, NC.
Smits, M. C. J., Valk, H., Elzing, A., & Keen, A. (1995). Effect of protein nutrition on ammonia emission from a cubicle house for dairy cattle. Livestock Production Science, 44, 147-156.
USDA-NASS. (2007). Census Publications [On-line]. Retrieved from: http://www.agcensus.usda.gov/Publications/2007/Full_Report/Volume_1,_Chapter_1_State_Level/Louisiana/index.asp.