April 2009
|
April 2009 // Volume 47 // Number 2 // Feature // v47-2a2


A Model of Employee Satisfaction: Gender Differences in Cooperative Extension
Abstract
Employee satisfaction is an
important issue for management and employees in any organizational
setting. We developed a generalized model of employee satisfaction
and tested it for both female and male U.S Extension employees.
Results indicate that there are no differences in the antecedents of
employee satisfaction between genders.
Introduction
There has been a recent interest in exploring factors influencing job satisfaction with a specific focus on gender differences. Clark (1997) used a large-scale survey to test the proposition that men and women in identical jobs should be equally satisfied. Study results reported that the average job for females was lower in stature and income than for males, yet females reported higher levels of job satisfaction. Sousa-Poza and Souza-Poza (2003) report similar findings from a national household panel survey in the Britain. In a study among women working in the private banking sector, Metle (2001) found that job satisfaction declines with increasing levels of education. Metle (2001) argues that higher levels of education tend to increase employee goal and income expectations. Women participating in the study reported gender discrimination in seniority and qualifications.
Men and women working in gender-balanced groups have higher levels of job satisfaction than those who work in homogeneous groups. Employees who work in groups comprised of mostly men tend to show the lowest levels of job satisfaction, and those working in groups of mostly women fall in the middle of the gender-balanced and mostly-men groups (Fields & Blum, 1997).
Pook, Füstös, and Marian (2003) surveyed 932 employees in Eastern Europe to explore the impact of gender bias on job satisfaction. Results suggest that women are less likely to receive help from their managers toward advancement and are less satisfied than men with the work they performed. This may be the result of being assigned less-challenging tasks, non-commensurate with their backgrounds.
Using data from the U.S. National Study of the Changing Workforce, Bender, Donohue, and Heywood (2005) report that overall women have higher job satisfaction than men and have higher job satisfaction in workplaces dominated by women. However, men and women value job flexibility differently, and once this difference is controlled for, gender composition in the workplace plays no role in determining job satisfaction of women.
Although previous research explored differences in job satisfaction due to gender in a number of settings, this study looks at this issue for U.S. Cooperative Extension employees. We propose a model of employee satisfaction and examine differences based on gender. In the following sections, we present the model and associated hypotheses.
A Conceptual Model of Antecedents of Employee Satisfaction: Propositions (P) and Hypotheses (H)
The proposed research model examines relationships between Employee Satisfaction (the dependent variable) and six explanatory variables: (1) Control/Autonomy/Influence, (2) Challenge, (3) Performance Measures, (4) Feedback, (5) Instrumentality, and (6) Stability/Security.
Control/Autonomy/Influence (P1)
Employee satisfaction is related to job expectations. Lawler and Stuttle's (1973) expectancy model proposed that employee motivation is a function of the perceived likelihood of a successful accomplishment and that such accomplishment will result in securing certain outcomes or rewards.
Positive rewards can influence satisfaction. Keller and Szilagyi (1976) provide evidence from data gathered among employees of a large manufacturing company in the U.S. that positive leader rewards have a positive effect in influencing employee satisfaction. Punitive leader rewards are also influential, but to a much lower extent. Szilagyi, Sims, and Keller (1976) report the association of lower levels of job satisfaction across multiple occupational levels with high levels of role ambiguity and role conflict. Teas (1981) reports a positive relationship between employee internal control orientation and job motivation.
Based on a survey of scientists and engineers, Arvey, Dewhirst, and Boling (1976) report that goal clarity, planning, autonomy, and participation in goal setting are factors linearly and positively related to satisfaction. In a survey that included 2,600 American and Canadian employees between the ages of 18 and 65, 81% of respondents rank having the power to make decisions that affect their own work as most important employment attribute (Anonymous, 2001).
- H1: Employeecontrol/autonomy/influence has a positive and significant correlation with employee satisfaction.
Challenge (P2)
Hall and Lawler (1970) consider that employee challenges may be external or internal in nature. External pressures include positional requirements, formally prescribed tasks, and expectations and demands from others. Internal pressures are due to individual values, needs, abilities, past experiences, cognitive style, and other idiosyncratic characteristics. A challenging task generates pressure on an individual to prove her or his competence to do high-quality work and contribute to organizational goals, which ultimately results in job satisfaction.
Lawler and Hackman (1971) warn of the risks of simple, standardized, routine jobs on employee satisfaction. Locke (1968) considers that challenging goals result in a higher level of employee performance than do easy-to-accomplish goals. Furthermore, specific challenging tasks result in a higher level of performance than not having goals or having non-specific, "do your best" goals. Ivancevich and McMahon (1977) consider that difficult tasks that are perceived as challenging-rather than impossible to achieve-are an important element in satisfying employees.
- H2: Job challenge has a positive and significant correlation with employee satisfaction.
Performance Measures (P3)
It is important that employee performance is communicated to them by supervisors. It is easier for employees to accept recommendations for performance improvement if they know management is interested in what they do (Sirota & Mischkind, 2006). Sirota and Mischkind (2006) emphasize that comments concerning improvements should be specific, factual, unemotional, and directed at performance rather than at employees personally.
Performance measures drive actions employees take (Blanchar & Onton, 2005). Performance measures are used to establish standards to define expectations and to track accomplishments (Fago, 2006). Performance measures can also be used to motivate employees to implement, plan, and achieve specific goals (Blanchar & Onton, 2005).
- H3: Performance measures are positively and significantly correlated with employee satisfaction.
Feedback (P4)
Providing employees with feedback on performance can serve two functions from an organization's point of view (Payne & Hauty, 1955). First, feedback can keep task-directed behavior on track, and, second, it can stimulate employees to exert greater effort. From the employee's point of view, feedback fulfills a need for information on the extent to which personal goals are met and as a point of social comparison about an individual's relative performance (Festinger, 1954).
Feedback can have significant and positive effects on performance when it is provided for a familiar task, is directed on goal setting, and does not direct attention to the self (Kluger & DeNisi, 1981). According to Kim (1984), goal setting and feedback results in improved employee performance. Based on a survey of 112 employees of a non-profit service organization, Jawahar (2006b) reports that appraisal feedback is positively related to job satisfaction and organizational commitment. Furthermore, employee satisfaction with feedback is positively related to job satisfaction and also influences future performance (Jawahar, 2006a).
- H4: Feedback on performance from superiors is positively and significantly correlated with employee satisfaction.
Instrumentality (P5)
Employee satisfaction, according to Walker, Churchill and Ford (1977), can be divided into intrinsic and extrinsic dimensions. Intrinsic satisfaction is related to the internal rewards such as satisfaction with work itself and with opportunities for personal growth and accomplishment. Extrinsic satisfaction refers to rewards bestowed on an employee such as pay, organization support, and opportunities for promotion, among others. The importance that the employee's role job plays in society is also another source of personal satisfaction.
Employee motivation, presented in Walker, Churchill and Ford (1977), is a function of expectancy, instrumentality, and valence of rewards. Instrumentality refers to the individual's estimate of the probability that achieving an improved level of performance will lead to increased attainment of a particular reward. Teas (1981) finds that employee job-specific self-esteem and internal control orientation are positively related to instrumentality perceptions.
- H5: Job instrumentality is positively and significantly correlated with employee satisfaction.
Stability/Security (P6)
Bolt (1983) reports that employees who feel secure in their jobs are more productive that those who are not. Sirota and Mischkind (2006) stress the importance of understanding the three sets of goals that the great majority of workers seek from their job: (1) equity, which involves being respected and treated fairly in areas such as pay, benefits, and job security; (2) achievement, which encompasses being proud of one's job, accomplishments, and employer; and (3) camaraderie, which embraces good, productive relationships with fellow employees. Of the three, the most basic goal is to provide employees with a sense of security in an environment in which they do not fear that their jobs will be in jeopardy if their performance is not perfect and where layoffs are considered an extreme last resort, not just another option for dealing with hard times (Sirota & Mischkind, 2006).
- H6: Job stability/security is positively and significantly correlated with employee satisfaction.
Figure 1 summarizes the hypothesized relationships between the six constructs and employee satisfaction.
Figure 1.
Proposed Conceptual Model: Antecedents of Employee Satisfaction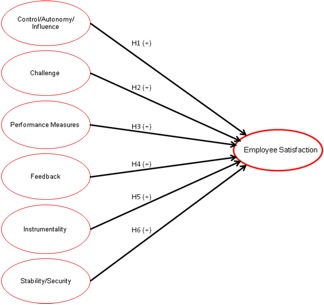
A questionnaire was developed based on existing constructs from the literature using items from tested scales (Table 1). We later show results of model construct validity testing.
| Construct | Sources |
| Control/Autonomy/Influence | Sims, Szilagyi, & Keller (1976), Hall (1968); Rizzo, House, & Lirtzman (1970); Sniznet & Crocker (1985); Lysonski (1985), Ferrell & Skinner (1988) |
| Challenge | Ivanvevich & McMahon (1977); Hall & Lawler (1970); Cummings, Jackson, & Ostrum (1989) |
| Performance Measures | Jaworski & MacInnis (1989); Feldman (1976) |
| Feedback | Schriesheim (1978); Hart, Moncrief, & Parasuraman (1989); Dubinsky, Howell, Ingram, & Bellenger (1986) |
| Instrumentality | Teas (1981); Hart, Moncrief, & Parasuraman (1989) |
| Stability/Security | Dubinsky & Hartley (1986); Snizek & Crocker (1985) |
| Satisfaction | Hunt & Chonko (1984); Hackman & Oldman (1974); Sujan (1986), Lucas, Parasuraman, Davis, & Enis (1987); Teas (1983) |
The Study
More than 18,000 1862-land grant university-based Cooperative Extension Service employees from the United States were sent an e-mail and an invitation to take the survey. The study was conducted in August 2006, using an online Web-based survey. The list of e-mail recipients was obtained from each state's Extension Web site and copied/pasted into a master database. For states that did not have employee e-mails listed on their Web sites, Extension upper administrators were contacted directly. At the end of the process, four states declined to have their employees participate. In addition, all 1890 Extension administrators were contacted via e-mail and invited to have their employees participate. We received no responses from this population. Therefore, the study is limited to 1862 land grant universities.
Two e-mails with a description of the study and the link to complete the questionnaire were sent 3 weeks apart. We received 2,749 useable responses. Accounting for undeliverable e-mails and e-mails sent to non-Extension employees, the adjusted response rate was 20%.
Results
Tests of Non-Response Bias and Variance
Non-response bias is often a common concern in survey research. Non-response is a problem in any survey because it raises the question of whether those who did respond are different in some important way from those who did not respond (Dillman, 2000). Bias due to non-response can be evaluated by comparing those who responded to the initial mailing to those who respond as a result of subsequent mailings and other follow-up efforts (Armstrong & Overton, 1977). Accordingly, second mailing respondents, as a proxy for non-respondents, were compared to first mailing respondents for the 57 questions in the survey instrument. Two-tailed t-test statistics for independent samples resulted in differences at α=0.05 for 10 variables (17%); accordingly non-response bias is not considered to be a significant problem.
Levene's test statistics for equal variances between respondent groups were performed. In the 51 of 57 variables where the significance value of the Levene's test was not significant (p>0.05), then t-test results that assume equal variances were used. If the test statistic was significant (p<0.05), t-test results not assuming equal variance were used.
Demographics
Of the 2,665 respondents who indicated gender, 48% were female (1,279), and 52% male (1,386). Table 2 shows comparative demographic characteristics for female and male respondents. In addition, using two-tailed t-tests, significant differences (p<0.05) are indicated for Age, Education Level, Income, and Area Where Respondent Lives. Pearson Chi-Square was calculated for Race, a categorical variable.
| Female (n=1,279) | Male (n=1,386) | |
| Age ** | ||
| 21-30 | 6% | 9% |
| 31-40 | 15% | 15% |
| 41-50 | 30% | 30% |
| 51-60 | 43% | 36% |
| 61-70 | 7% | 8% |
| 71-80 | 0% | 1% |
| Older than 80 | 6% | 9% |
| Education Level (highest attained)** | ||
| High school graduate | 1% | 0% |
| Some college | 4% | 4% |
| College graduate (B.A./B.S.) | 12% | 16% |
| Graduate degree (M.S./Ph.D.) | 83% | 80% |
| Pre-tax Income (2005)** | ||
| Less than $20,000 | 2% | 2% |
| $20,000-$29,000 | 4% | 4% |
| $30,000-$39,000 | 14% | 17% |
| $40,000-$49,000 | 17% | 25% |
| $50,000-$59,000 | 19% | 18% |
| $60,000-$69,000 | 18% | 11% |
| $70,000-$79,000 | 13% | 7% |
| $80,000-$89,000 | 6% | 5% |
| $90,000-$99,000 | 5% | 3% |
| $100,000 or more | 4% | 6% |
| Race** | ||
| Caucasian | 89% | 97% |
| African American | 1% | 2% |
| Hispanic | 5% | 1% |
| Asian | 5% | 0% |
| Type of Area Where Respondent Lives* | ||
| Very Large City (1,000,000 or more). | 7% | 2% |
| Large City (250,000-999,999) | 14% | 6% |
| Medium-sized City (50,000-250,000) | 26% | 30% |
| Small City (10,000-50,000) | 31% | 24% |
| Very Small City, Town, or Village (2,500-9,999) | 12% | 16% |
| In a Rural area (less than 2,500) | 10% | 23% |
| * Denotes statistical differences at α=0.05, ** Denotes statistical differences at α=0.01 | ||
Cronbach's α was used to measure reliability (internal consistency) of the model antecedent constructs and satisfaction, the dependent variable for female and male respondents. High (≥0.70) Cronbach's alphas indicate that the measures are reliable and that summated scales for each construct can be used in subsequent hypothesis testing. Table 3 shows scale items and results of scale testing for females and males, respectively. Results suggest the appropriateness of the constructs to elicit job satisfaction.
| Control/ Autonomy/ Influence | Challenge | Performance Measures | Feedback | Instrumentality | Stability/ Security | Employee Satisfaction | |
| Female Respondents | |||||||
| Cronbach's α | 0.86 | 0.82 | 0.78 | 0.70 | 0.78 | 0.80 | 0.86 |
| n | 1,262 | 1,249 | 1,273 | 1,278 | 1,271 | 1,269 | 1,246 |
| Number of items | 5 | 4 | 3 | 2 | 4 | 2 | 6 |
| Items mean | 4.0 | 4.4 | 3.5 | 2.8 | 2.8 | 3.0 | 4.1 |
| Male Respondents | |||||||
| Cronbach's α | 0.87 | 0.80 | 0.75 | 0.70 | 0.80 | 0.81 | 0.88 |
| n | 1,371 | 1,358 | 1,380 | 1,377 | 1,366 | 1,372 | 1,361 |
| Number of items | 5 | 4 | 2 | 2 | 4 | 2 | 6 |
| Items mean | 4.1 | 4.4 | 3.4 | 2.9 | 2.9 | 3.4 | 4.2 |
Hypothesis Testing
The following sections convey results of statistical tests that were performed to test the conceptual research model and associated hypotheses. For both females and males, summated scales of construct items were calculated. These summated scales, were used to test antecedents-employee satisfaction relationships using Pearson bivariate correlation, after which multiple regression analysis was conducted to identify the " best-fit" model for each gender.
Table 4 presents correlation coefficients for Employee Satisfaction versus independent variable constructs for female and male respondents. Results indicate highly significant positive correlations (α<0.001) between all summated scale constructs and Employee Satisfaction for both genders.
| Employee Satisfaction Related to... | Antecedent Constructs | |||||
| Control/ Autonomy/ Influence | Challenge | Performance Measures | Feedback | Instrumentality | Stability/ Security | |
| Female respondents | ||||||
| Correlation coefficient | 0.61 | 0.64 | 0.34 | 0.44 | 0.47 | 0.44 |
| Significance (2-tailed) | <0.001 | <0.001 | <0.001 | <0.001 | <0.001 | <0.001 |
| n | 1,221 | 1,209 | 1,231 | 1,235 | 1,229 | 1,229 |
| Male respondents | ||||||
| Correlation coefficient | 0.61 | 0.66 | 0.34 | 0.47 | 0.46 | 0.47 |
| Significance (2-tailed) | <0.001 | <0.001 | <0.001 | <0.001 | <0.001 | <0.001 |
| n | 1,346 | 1,335 | 1,356 | 1,352 | 1,340 | 1,348 |
Regression analysis was performed to examine the variance in the Employee Satisfaction dependent variable uniquely explained by independent variable constructs. The backward multiple regression method was used to test the study hypotheses. The backward elimination process for variable selection identifies the set of variables that explain most of the variability in the dependent variable. Backward elimination starts with the full model (including all variables) and sequentially removes independent variables from the model if the significance level of the partial correlation F value is less than 0.10. The procedure stops when there are no variables in the equation with an F value less than 0.10 (Freund & Wilson, 2003).
Regression results indicate that there are strong relationships between the dependent variable (Employee Satisfaction) and the six independent variables for both females (F(6, 1138)=324.45, p<.001) and males (F(6,1273)=358.86, p<.001). Regression model coefficients for all independent antecedent variables in both models were significant at p<0.001. The predictive equations for Employee Satisfaction are:
Females (R2 = 0.63)
Employee Satisfaction = 11.745+.273*Control+.318*Challenge+.053*Performance Measures+.188*Feedback+.177*Instrumentality+.168*Stability / Security)+ε
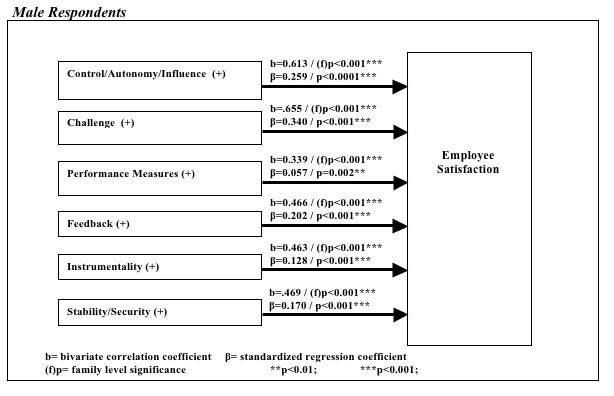
Males(R2 = 0.63)
Employee Satisfaction = 10.303+.273*Control+.340*Challenge+.057*Performance Measures+.202*Feedback+.128*Instrumentality+.170*Stability / Security)+ε
Table 5 summarizes the results for the six hypotheses in the model.
| Hypotheses | Accept | |
| H1 | Employee control/autonomy/influence has a positive correlation with employee satisfaction. | Yes |
| H2 | Job challenge has a positive correlation with employee satisfaction. | Yes |
| H3 | Performance measures are positively correlated with employee satisfaction. | Yes |
| H4 | Feedback on performance from superiors is positively correlated employee satisfaction. | Yes |
| H5 | Job instrumentality is positively correlated with employee satisfaction. | Yes |
| H6 | Job stability/security is positively correlated with employee satisfaction. | Yes |
Finally, Figure 2 presents the empirically tested research models of antecedents for Employee Satisfaction with summaries of bivariate and multiple regression results.
Figure 2.
Empirically Tested Models of Antecedents for Employee Satisfaction 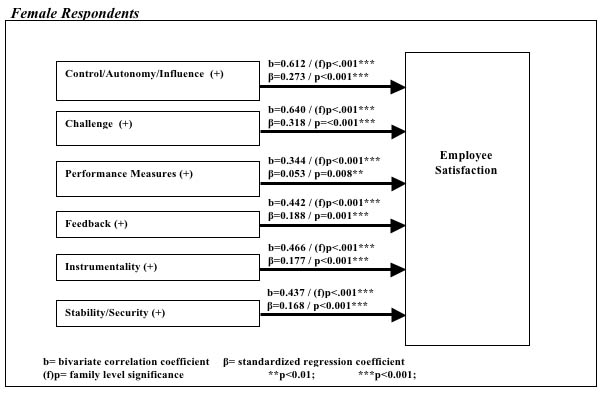
Conclusion
In the study described here, we proposed a model consisting of six key drivers of employee satisfaction and tested the model in the context of U.S. Cooperative Extension employees. We further tested the model for both females and males. Results show that, although there are demographic differences between female and male respondents, all six antecedents were found to be highly significant in positively influencing their satisfaction as Extension employees.
Employee satisfaction results from a myriad of factors and influences that exist in the workplace. Organizational leadership should foster a culture that gives employees a sense of usefulness, dignity, and being valued. It is the role of supervisors to operationalize corporate culture, and thus the responsibility falls on them to implement measures that lead to employee satisfaction. In addition, supervisors should be champions for employees to make sure they are remunerated commensurate with performance.
Employees have responsibilities as well to maximize their satisfaction in the workplace. They need to participate in the goal-setting process to ensure that their duties are challenging, which leads to satisfaction. Employees must also be self-motivated and perform their assigned duties to the levels established during the goal-setting process. Finally, employees must be willing to accept constructive criticism during performance reviews, which will enable them to increase their level of instrumentality to the organization and, in the case of Extension, to society.
This study can help to guide both Extension employees and their organizations in developing a framework that is mutually satisfying and productive. The next step in the process, based on research findings, would be to establish sets of parameters and actionable objectives for each antecedent.
References
Anonymous. (2001). What drives employee satisfaction? Community Banker, 10(7): 42-43.
Arvey, R. D., Dewhirst, H. D. & Boling, J. C. (1976). Relationships between goal clarity, participation in goal setting, and personality characteristics on job satisfaction in a scientific organization. Journal of Applied Psychology, 61(1): 103-105.
Bender, K. A., Donohue, S. M., & Heywood, J. S. (2005). Job satisfaction and gender segregation. Oxford Economic Papers, 57, 479-496.
Blanchar, C., & Onton, J. (2005). Performance measures in times of change. Employment Relations Today , 32(1): 25-34.
Bolt, J. F. (1983). Job security: Its time has come. Harvard Business Review. 61(6): 115-123.
Clark, A. E. (1997). Job satisfaction and gender: Why are women so happy at work? Labour Economics, 4(4): 341-372.
Cummings, W. T., Jackson, D., & Ostrom, L. L. (1989). Examining product managers' job satisfaction and performance using selected organizational behavior variables. Journal of the Academy of Marketing Science, 17 (2): 147-156.
Dillman, D. (2000). Mail and Internet surveys: The tailored design method. Second Edition. John Wiley & Sons, Inc. New York, NJ.
Dubinsky, A. J., & Hartley, S. W. (1986). A path-analytic study of a model of salesperson performance. Journal of the Academy of Marketing Science, 14, 36-46.
Dubinsky, A. J., Howell, R. D., Ingram, T. N., & Bellenger, D. (1986). Salesforce socialization. Journal of Marketing, 50 (October), 192-207.
Fago, J. (2006). Frequently asked human resources questions. Illinois Banker, 91(4): 8-9.
Feldman, D. C. (1976). A contingency theory of socialization. Administrative Science Quarterly, 21: 433-452.
Festinger, L. (1954). A theory of social comparison. Human Relations, 7,117-140.
Fields, D., & Blum, T. C. (1997). Employee satisfaction in work groups with different gender composition. Journal of Organizational Behavior, 18, 181-196.
Ferrell, O. C., & Skinner, S. J. (1988). Ethical behavior and bureaucratic structure in marketing research organizations. Journal of Marketing Research, 25, 103-109.
Hall, R. H. (1968). Professionalism and bureaucratization. American Sociological Review, 33, 92-104.
Hall, D. T., & Lawler, E. E. (1970). Job characteristics and pressures and the organizational integration of professionals. Administrative Science Quarterly, 15, 271-281.
Hart, S. H., Moncrief, W. C., & Parasuraman, A. (1989). An empirical investigation of salespeople's performance, effort and selling method during a sales contest. Journal of the Academy of Marketing Science, 17, 29-39.
Hunt, S. D., & Chonko, L. B. (1984). Marketing and Machiavellianism. Journal of Marketing, 48: 30-42.
Ivancevich, J. M., & McMahon, J. T. (1977). A study of task-goal attributes, higher order need strength, and performance. The Academy of Management Journal, 20(4): 552-563.
Jawahar, I. M. (2006). An investigation of potential consequences of satisfaction with appraisal feedback. Journal of Leadership & Organizational, 13(2):14-28.
Jawahar, I. M. (2006). Correlates of satisfaction with performance appraisal feedback. Journal of Labor Research, 27(2): 213-236.
Jaworski, B. J., & Maclnnis, D. J. (1989). Marketing jobs and management controls: Toward a framework. Journal of Marketing Research, 26, 406-419.
Kim, J. S. (1984). Effect of behavior plus outcome goal setting and feedback on employee satisfaction and performance. The Academy of Management Journal, 27(1): 139-149.
Kluger, A. N., & DeNisi, A. (1981). The effects of feedback interventions on performance: A historical review, a meta-analysis, and a preliminary feedback intervention theory. Psychological Bulletin, 119(2):254-284.
Lawler L., & Hackman, J. R. (1971). Corporate profits and employee satisfaction: Must they be in conflict? California Management Review, 14(1): 46.
Lucas Jr., G. H., Parasuraman, A., Davis, R. A., & Enis, B. M. (1987), An empirical study of salesforce turnover. Journal of Marketing, 51, 34-59.
Lysonski, S. (1985). A boundary theory investigation of the product manager's role. Journal of Marketing, 49, 26-40.
Metle, M. K. (2001). Education, job satisfaction and gender in Kuwait. International Journal of Human Resource Management, 12: 311-332.
Payne, R. B., & Hauty, G. T. (1955). Effect of psychological feedback upon work decrement. Journal of Experimental Psychology, 50(6):343-51.
Pook, L. A., Füstös, J., & Marian, L. (2003). The impact of gender bias on job satisfaction Components of job satisfaction and advancement in post-liberation Hungary, Poland, and Romania. Human Systems Management, 22(1): 37-50.
Rizzo, J. R., House, R. J., & Lirtzman, S. I. (1970). Role conflict and ambiguity in complex organizations. Administrative Science Quarterly, 15, 150-163.
Schriesheim, C. A. (1978). Development, validation and application of new leadership behavior and expectancy research instruments, unpublished doctoral dissertation, The Ohio State University.
Sims, H. P., Jr., Szilagyi, A. D., & Keller, R. T. (1976). The measurement of job characteristics. Academy of Management Journal, 19, 195-212.
Sirota, D., & Mischkind, L. A. (2006). Stop demotivating your employees! Harvard Management Update, 11(1): 3-6.
Snizek W. E., & Crocker, K. E. (1985). Professionalism and attorney attitudes toward legal service advertising. Journal of the Academy of Marketing Science, 13, 101-108.
Sousa-Poza, A., & Sousa-Poza, A. A. (2003). Gender differences in job satisfaction in Great Britain, 1991-2000: Permanent or transitory? Applied Economics Letters, 10(11): 691-694.
Sujan, H. (1986). Smarter versus harder: An exploratory attributional analysis of salespeople's motivation. Journal of Marketing Research, 23, 41-49.
Szilagyi, A. D., Jr, Sims, Jr., H. P., & Keller, R. (1976). Role dynamics, locus of control, and employee attitudes and behavior. The Academy of Management Journal, 19(2): 259-276.
Teas, R. K. (1981). An empirical test of models of salespersons' job expectancy and instrumentality perceptions. Journal of Marketing Research, 18(2): 209-226.
Teas, R. K. (1983). Supervisory behavior, role stress, and the job satisfaction of industrial salespeople. Journal of Marketing Research, 20, 84-91.
Walker, O. C., Jr., Churchill, Jr., G. A., & Ford, N. M. (1977). Motivation and performance in industrial selling: Present knowledge and needed research. Journal of Marketing Research 14(2): 156-168.