April 2009
|
April 2009 // Volume 47 // Number 2 // Feature // v47-2a1


Designing a Regional System of Social Indicators to Evaluate Nonpoint Source Water Projects
Abstract
A collaborative team has developed a system
to measure the social outcomes of nonpoint source water projects as
indicators of progress towards environmental goals. The system
involves a set of core indicators, additional supplemental
indicators, and a process for collecting and using the indicators.
This process is supported by methodologies and instruments for data
collection, analysis, and reporting that are coordinated and
supported through detailed written guidance and an on-line data
management tool. Its multi-state scope and application offer a unique
opportunity to target, measure, and report interim resource
management accomplishments consistently at multiple levels.
Introduction
Non point source (NPS) pollution is the primary source of water quality impairments in the United States (USEPA, 2000). Addressing NPS pollution in both urban and rural watersheds requires understanding and influencing the behaviors of the people who manage these lands. Frequently, when evaluation of the effectiveness of watershed projects occurs, the assessment is based solely on water quality indicators. This approach ignores the fact that water quality problems have taken decades to develop and may take decades to amend. Even when appropriate management practices are put into place, there is usually a lag before off-site water quality actually improves. This can make it very difficult to demonstrate success from funded projects.
Interim measures of progress toward water quality goals are needed. Because many NPS management projects frequently involve outreach and education activities to encourage adoption and maintenance of management practices to address NPS pollution sources, one way to measure progress toward long-term water quality goals in the short- and medium-terms is to assess the success of outreach and education programs. That is, if outreach and education programs are shown to increase the likelihood that target audiences will adopt more appropriate management practices within critical areas, one could reasonably conclude that progress was being made toward achieving water quality goals.
Through an innovative partnership, we have developed the Social Indicators Planning and Evaluation System (SIPES) to measure these social dimensions of watershed projects. Through the USDA-CSREES Great Lakes Regional Water Program, Extension is leading this partnership between USEPA, the six state NPS programs in USEPA Region 5, and land-grant universities in the region to develop SIPES to measure progress toward the adoption of appropriate management practices among various target audiences. SIPES involves measuring short- and medium-term impacts of outreach and education projects on target audiences, and it includes a set of core indicators, additional supplemental indicators, methodologies and instruments for data collection, analysis, and reporting. It is coordinated and supported through an on-line data management tool.
We believe that the system developed through this initiative can serve as a model for other states and regions seeking consistent metrics for evaluation. We further think that active partnerships between Extension programs and state NPS programs will help integrate the system into project evaluation. Extension educators have historically supported outreach and education efforts associated with local NPS projects. In this capacity, Extension can serve as convener and as a foundation of expertise on audience identification, outreach and education, and program evaluation.
Frequently state agencies addressing NPS issues do not have the capacity to develop these types of systems or the substantive expertise in social science to develop valid and reliable measures. Interdisciplinary groups of Extension specialists can provide social science expertise to state agencies to help build capacity to evaluate and improve natural resources programs. This type of system may also be used to evaluate other types of Extension activities that promote behavior change, such as dietary change and nutrition and youth development.
While undergoing pilot testing and refinement for use with state NPS programs in the Great Lakes Region (USEPA Region 5), SIPES offers a model for other states and regions addressing social dimensions and developing interim measures of progress for their NPS programs. This article explains the rationale for a set of consistent social indicators in NPS management and describes the indicators and associated support mechanisms developed for this initiative.
Background
Recognizing the importance of incorporating measures of social change into their management efforts, program leaders overseeing NPS initiatives in USEPA Region 5 approached the USDA-CSREES Great Lakes Regional Water Leadership Team for assistance developing social indicators to measure the effectiveness of NPS projects funded through their programs in this region (Illinois, Indiana, Michigan, Minnesota, Ohio, and Wisconsin). Prior to the initiative, each state NPS program in the region had outlined an evaluation framework describing an outcome-based evaluation approach that included provisions for tracking program performance through the ongoing use of administrative indicators (e.g., funds utilized, activities completed) environmental indicators (e.g., water quality, habitat, and related physical environmental conditions), and social indicators.
The use of social indicators was a new concept that was not initially well accepted, understood, or defined. A multi-state social indicators team (SI Team) was created to clarify options for using social indicators and develop a set of social indicators that could be collected for all funded projects, could be aggregated to evaluate state and regional-level impacts, and could support program-level evaluation.
One of the many challenges of indicator projects lies in distilling the universe of potential indicators into a usable set with relevance for program implementation and management decisions. For NPS, the most relevant indicators relate to behaviors that reduce NPS pollution and factors influencing those behaviors. Much of the literature related to those and other environmental behaviors draws from social psychological models, adoption-diffusion, and stages of change. In particular, the Theory of Planned Behavior (Ajzen, 1988, 1991), linking attitudes, subjective norms, perceived behavioral control, behavioral intentions, and actual behavior, has received considerable attention in recent years and has been used to better understand a wide array of behaviors in the natural resources arena (e.g., Corbett, 2002).
Complementary theories related to stages of change build upon diffusion of innovations models (Rogers, 1995), linking adoption of particular technologies and practices with specific factors. Such factors include knowledge of, risks associated with, and peer group perceptions of those technologies and practices. Additionally, literature related to environmental education and outreach programs suggests similar influences and the importance of understanding underlying interests, constraints, and situational factors when seeking to influence specific audiences (Stevens & Andrews, 2006).
In summary, previous research suggests that there are many potential factors that can influence an individual's decision to adopt a given environmental and conservation practice, and which of those factors are most salient will depend on the nature of the practices being promoted, individual characteristics, and local context. Effective planning and management must take these factors into account and develop programs based on knowledge of environmental conditions as well as knowledge of target audiences and other contextual factors that influence their behavior.
Broadly then, social indicators are measures that describe the capacity, skills, awareness, knowledge, values, beliefs, and behaviors of individuals, households, organizations, and communities. For the purposes of SIPES, social indicators for NPS management provide information about awareness, attitudes, constraints, capacity, and behaviors that are tied to water quality improvement and protection. By measuring these indicators over time, water quality managers can develop incentive and educational programs, target their activities, and assess whether their efforts are accomplishing changes expected to improve and protect water quality within the project area.
Social Indicator Framework
To develop the indicators, the SI Team followed an intensive stakeholder involvement process to ensure that the final indicators met users' needs and to generate buy-in and support from program staff (Genskow & Prokopy, In Press). The SI Team conducted workshops in all six states in the region to solicit ideas about potential indicators from stakeholders. These workshops, along with a literature review, led to an extensive list of possible social indicators. This list of indicators was again vetted by stakeholders through a Web survey. Through this process, and consistent with others exploring similar approaches (e.g., Morton & Padgit, 2005; Hibbard & Dority, 2005), the team developed an initial set of "core" indicators that would apply to all projects using SIPES. The SI Team also identified an additional set of supplemental indicators that individual projects could use selectively to augment core indicators with a broader set of measures; the supplemental indicators will be further developed and tested over time.
The indicators are intended to be measured at two points in time-pre- and post-project-with the potential for long-term monitoring and assessment, depending on available local and state resources. The fact that core indicators will largely be collected as primary data in SIPES is a notable departure from other indicator projects that have used "readily accessible" secondary data to provide measures for their indicators (Cobb & Rixford, 2005; Rossi & Gilmartin, 1980). All indicators had to meet criteria for selection. The criteria were drawn from previous indicator efforts that have focused on natural resources (e.g., CCFM, 2004; Cole et al., 1998; Bright et al., 2003) and required indicators to be clear and understandable, measurable, practical in terms of accessibility and cost, valid, aggregatible, and reflective of stakeholder ownership.
The SI Team's final conceptualization for indicators included those that could provide information about awareness, attitudes, constraints, capacity, and behavior change that would be expected to lead to water quality improvement and protection. These indicators measure the use of practices known to be beneficial to water quality or the abandonment of actions known to be detrimental.
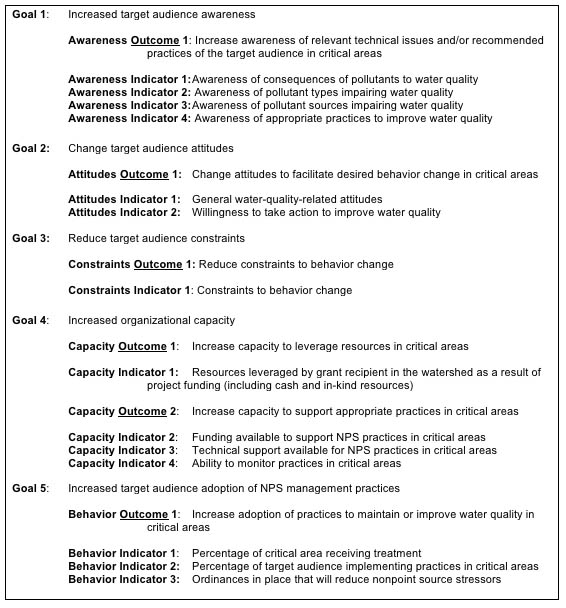
The awareness, attitude, and constraints indicators measure aspects of an individual's reasoning process that are precursors to behavior change. These are important because they represent different dimensions of the reasoning process, all of which are critical to motivating and initiating behavior change. Awareness indicators assume a continuum of knowledge that progresses from a person's awareness of the existence of the problem, through awareness of consequences associated with the problem, to awareness of appropriate actions to address the problem. Attitude indicators measure the relative value individuals place on the relevant water-resource issues. Indicators related to constraints reflect influences such as limited access to equipment and technology, existing social norms, and other factors constraining action. Capacity indicators address the availability (to the community) of resources needed to respond to water quality problems. Specific project goals and intended outcomes for each category of indicators are included in Figure 1.
Figure 1.
Goals, Intended Outcomes, and Core Social Indicators for NPS Management
The Support Structure
Along with the indicators, SIPES consists of a data collection and management process that is supported by survey instruments, a support network, and a handbook as well as an on-line support tool for instruction, instrument development, data entry, analysis, and reporting. Data collection instruments include pre-project and post-project survey questionnaires for various audiences that use consistent question formats to capture social indicator data while enabling project-specific customization of pollution sources, management practices, constraints, and communication channels.
The questionnaires reflect principles of sound instrument design (e.g., Dillman, 2007) and are structured to collect information about attitudes, knowledge regarding local sources of water quality impairments and their consequences, awareness of potential measures to address problems, current behaviors, motivations, and factors that influence decisions. Projects can also add locally relevant questions. Currently questionnaires have been developed for the two most common types of audiences in NPS projects-farmers and non-farm households. Over the next 3 years additional questionnaires will be developed and tested for other target audiences identified through an initial piloting effort and by state NPS program managers.
Other instruments within SIPES provide tools for evaluating specific implementation activities (e.g., landowner workshops and newsletters) and for collecting contextual information that influences project development and implementation. For example, there is a set of structured questions project staff and other key stakeholders can use to identify external factors influencing their project.
A central component of support for state programs and NPS projects in the Great Lakes Region (Region 5) is the Web-based Social Indicators Data Management and Analysis (SIDMA) tool (see Table 1). SIDMA will be used to help project coordinators organize, analyze, report, and visualize social indicators related to water quality improvements through spatial relationships. SIDMA can be accessed by project coordinators and staff through an interactive Web site and will integrate with existing systems already in use for tracking and reporting NPS data.
SIDMA includes a survey-builder feature that allows project staff to construct pre-project and post-project questionnaires using question structure and phrasing consistent with other projects across the region; the survey will be generated in a format that project staff can mail or use as the basis for a telephone, in-person, or email survey. SIDMA also allows projects to enter survey responses directly on-line and provides data analysis and data export functions. Projects can also record interim data and "success stories" during implementation. Eventually, SIDMA will support Web-based responses to mailed surveys, and in those cases where e-mail is an effective option for reaching an audience, it will support an e-mail survey.
| Tools | Features |
| Survey builder | Provides survey questions to be selected and adapted for use by a watershed project |
| Geographic information and mapping tools | Provides watershed boundaries and population data |
| Data input screens and database | Use to input and store responses from questionnaires and other social indicator data |
| Data analysis tools | Use to generate descriptive and inferential statistics from survey data |
| Mechanism for reporting social indicator data | Use to report required social indicator data to USEPA Region 5 |
| Report writing tools | Provides assistance for communicating social indicator data |
As noted, we are currently entering into an initial 3-year pilot test phase that will involve multiple NPS projects in each of the region's six states. Pilot projects will use detailed protocols for documenting issues related to staff capacity, level of assistance provided during implementation, costs, and other questions of interest. NPS projects involved in the testing and refinement phase will also have access to support and technical assistance from the SI Team. Long-term support needs will be identified and documented through this pilot phase.
Conclusions
The SI Team has developed an innovative system for collecting social data to evaluate the effectiveness of nonpoint source pollution projects across a six-state region. This system, SIPES, is being used in support of NPS management efforts through several programs and project areas (including Section 319 and Total Maximum Daily Loads [TMDLs]) and can serve as a model for application in other areas. Consistent information will be collected from a diverse set of projects using rigorous and tested methodologies.
As with any project of this nature, there are some limitations. While SIPES was designed for a majority of NPS projects in these six states, it will not work for projects that do not have an education and outreach component or projects that cover a diffuse area and do not have a clearly defined target audience whose behaviors are affecting water quality. The survey instruments have been pre-tested with their intended audiences but would have limited use for unique cultural groups, such as the Amish, or non-English-speaking populations. In its current state, SIPES requires projects to interact with university Extension faculty or other knowledgeable outreach professionals to ensure its success. Additional testing and training will need to be completed before projects can be expected to collect their own high-quality data, and questions still remain about whether a "Do-It-Yourself" approach to collecting this type of information will work given staff turnover and other constraints facing NPS projects.
Despite those concerns, we feel that SIPES offers a solid starting point for addressing the challenges facing NPS programs. Although SIDMA is a unifying tool for NPS programs in the Great Lakes Region, much of the system for collecting and using social indicators could be reproduced for other areas through development of common instruments, protocols, and reporting formats. We hope that SIPES can serve as an example and prompt Extension programs to initiate discussions with their NPS agency partners.
Acknowledgements
We thank USEPA Region 5, the state agency NPS Program coordinators in the Great Lakes Region, and the USDA-CSREES Great Lakes Regional Water Program. USDA-CSREES regional programs were established to coincide with EPA regions to promote multi-state collaboration. We also thank others who have contributed to the development of this system: Karlyn Eckman, Jerry Long, Mark Stevens, Rachel Walker, and David White. For more information about the CSREES Great Lakes Regional Water Program, please visit http://www.uwex.edu/ces/regionalwaterquality/.
References
Ajzen, I. (1988). Attitudes, personality, and behavior. Chicago: Dorsey Press.
Ajzen, I. (1991). The theory of planned behavior. Organizational Behavior and Human Decision Processes, 52, 27-58.
Bright, A. D., Cordell, H. K., Hoover, A. P., & Tarrant, M. A. (2003). A human dimensions framework: Guidelines for conducting social assessments. General Technical Report SRS-65. Asheville, NC: United Stated Department of Agriculture, Forest Service.
Canadian Council of Forestry Ministries (CCFM). (2004). Defining sustainable forest management in Canada: Criteria and indicators 2003-Technical Supplement 1, Detailed Indicator Descriptions.
Cobb, C., & Rixford, C. (2005). Historical background of community indicators. In R. Phillips, Community indicators measuring systems. Burlington, VT: Ashgate Publishing.
Cole, D. C., Eyles, J., & Gibson, B. L. (1998). Indicators of human health in ecosystems: What do we measure? The Science of Total Environment, 224(1), 201-213.
Corbett, J. B. (2002). Motivations to participate in riparian improvement programs- applying the theory of planned behavior. Science Communication, 23, 243-263.
Dillman, D. A. (2007). Mail and Internet surveys: The tailored design method (2nd ed.). New York: Whey and Sons, Inc.
Genskow, K., & Prokopy, L. S. (in press). Lessons learned in developing social indicators for regional water quality management. Society and Natural Resources.
Hibbard, M., & Dority, A. (2005). Evaluating environmental, social, and economic impacts of watershed enhancement activities. University of Oregon Institute for Policy Research and Innovation, Paper 05-004.
Morton, L. W., & Padgitt, S. (2005). Selecting socio-economic metrics for watershed management. Environmental Monitoring and Assessment, 103:83-98.
Rogers, E. M. (1995). Diffusion of innovations (5th ed.). New York: Free Press.
Rossi, R. J., & Gilmartin, K. J. (1980). The handbook of social indicators. New York: Garland STPM Press.
Stevens, M., & Andrews, E. (2006). Outreach that makes a difference! Unpublished draft report, University of Wisconsin Cooperative Extension.
US Environmental Protection Agency (USEPA). (2000). National Water Quality Inventory, 1998: Report to Congress. EPA-841-R-00-001.