February 2020
|
February 2020 // Volume 58 // Number 1 // Ideas at Work // v58-1iw6


Novel Method for Determining Sale Eligibility in Station-Tested Beef Bulls
Abstract
Operators of central bull test stations often determine sale eligibility using a selection index, whereas coordinators of the Wardensville Bull Test use independent culling levels derived according to deviation from contemporary group mean. Data from the 2013–2015 Wardensville Bull Test program were used for determining mean numbers of bulls culled for six eligibility criteria for three variation-based culling levels. Then comparison of these methods was used for determining the most appropriate method relative to program goals and producer needs. Suggested sale eligibility criteria are provided. Extension professionals can educate relevant audiences regarding the value and correct application of the variation-based method.
Introduction
The predominant method used by central bull test stations to determine sale eligibility is application of a selection index, which is a linear combination of phenotypic information and weighting factors used to predict genetic merit (Bourdon, 2000). Although this is the most effective method of multiple-trait selection (Field, 2018), weaknesses do exist. For example, bulls exhibiting superior performance for traits receiving greater emphasis in the index may qualify for sale while exhibiting inferior performance in traits receiving less emphasis and/or traits omitted from the index. Bourdon (2000) stated that selection indexes are most useful when utilized within a herd and not across populations because selection bias can exist when the phenotypic data used in the index come from contemporary groups that are not genetically similar. Because central bull test stations evaluate bulls from multiple breeders and multiple breeds, selection methodologies that minimize selection bias should be used.
An alternative method is application of independent culling levels. These are minimum standards for traits used in multiple-trait selection, meaning that animals failing to meet any one standard are culled regardless of merit in other traits (Bourdon, 2000). Because bulls must be acceptable in all traits evaluated, independent culling levels should generate a more balanced and complete sale offering when compared to a selection index; however, the environment and the genetic potential of the animals evaluated vary from year to year. Therefore, static independent culling levels are likely to be ineffective over the long term because they may be too harsh or too lax depending on the year. Ideally, individuals coordinating central bull tests should establish independent culling levels that adjust with each test population while continuing to meet program goals. Extension professionals involved with central bull tests can take such action or educate others on doing so, as applicable.
Objective
My objective with the work described herein was to develop and implement an objective method of determining sale eligibility in station-tested beef bulls that would
- result in an offering of complete bulls without major performance weaknesses in measured traits and
- allow prospective buyers to make selection decisions based on evaluation of available data relative to individual selection goals.
Methods
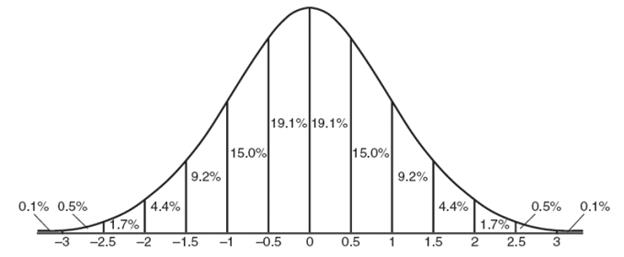
Performance data from the 2013, 2014, and 2015 West Virginia Young Sire Evaluation Program Wardensville Bull Test were used. Because of small sample sizes in non-Angus breed bulls, only data on Angus bulls were included in the analysis. Breed mean and standard deviation were calculated for each trait used in determining sale eligibility for each test year. Then potential sale eligibility of the bulls for each trait was determined through the use of established static independent culling levels (Table 1) and independent culling levels based on the deviation (Figure 1) from the mean (1.0, 1.5, and 2.0 SDs). The mean numbers of bulls failing to meet sale eligibility criteria for each method were then compared to previously established static culling levels through use of the Student's t-test. Significance was indicated by p < .05.
| Trait | Static independent culling level |
|---|---|
| Average daily gain ratio | 88 |
| Adjusted yearling weight ratio | 90 |
| Residual feed intake (RFI), lbs DM/day | 3.7 |
| Ribeye area/hundredweight, in2/cwt | 1.00 |
| Adjusted intramuscular fat, % | 2.75 |
| Adjusted scrotal circumference, cm | 31.0 |
| Note. DM = dry matter. | |
Figure 1.
Normal Distribution Curve and Standard Deviations
Results
The numbers of bulls failing to meet both static and variation-based sale eligibility criteria for the applicable traits are shown in Figures 2–8. Statistical comparisons of the two methods across years are shown in Table 2.
Figure 2.
Number of Bulls Failing to Meet Average Daily Gain Ratio Eligibility Requirements
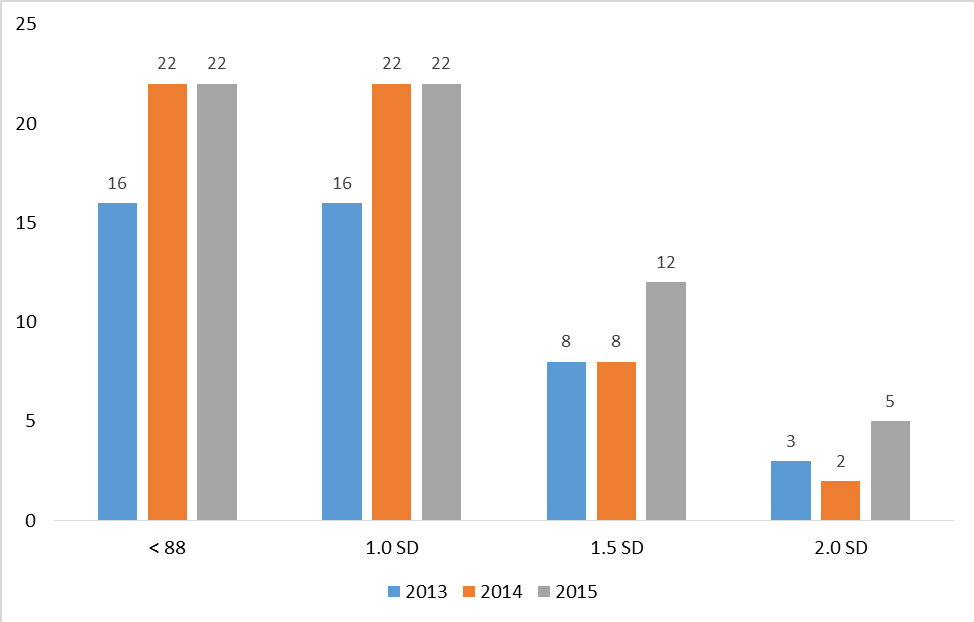
Figure 3.
Number of Bulls Failing to Meet Yearling Weight Ratio Eligibility Requirements
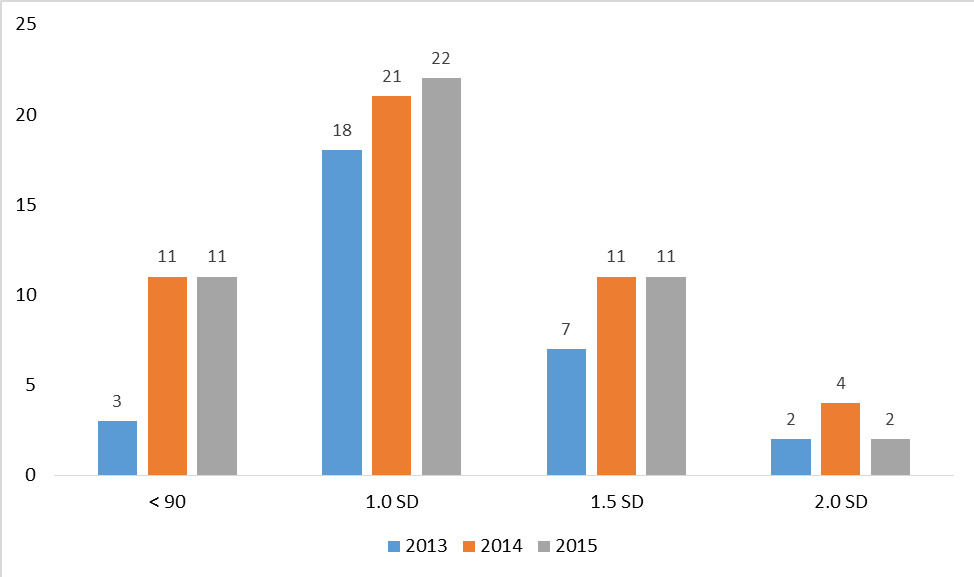
Figure 4.
Number of Bulls Failing to Meet Residual Feed Intake Eligibility Requirements
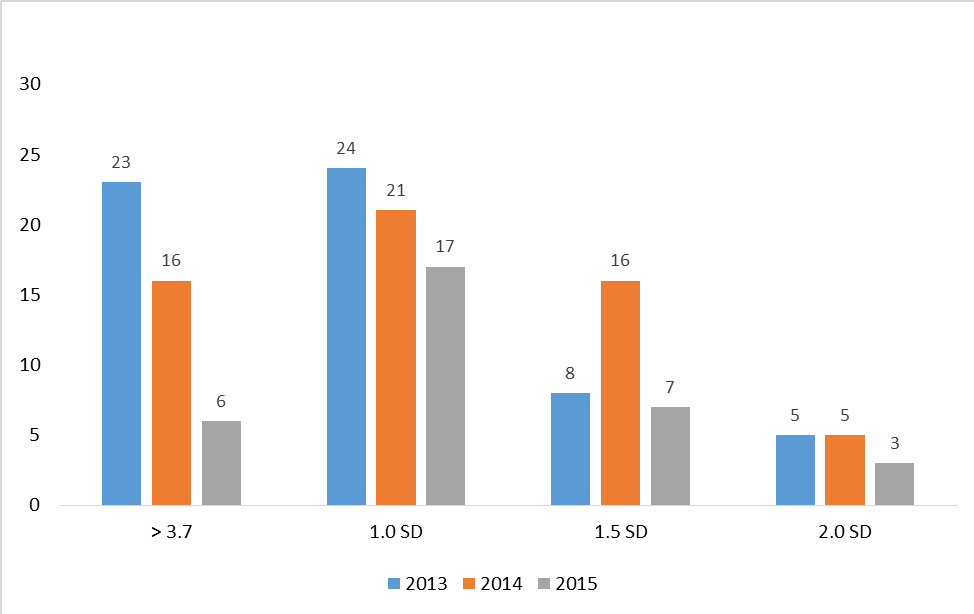
Figure 5.
Number of Bulls Failing to Meet Ribeye Area/Hundredweight Eligibility Requirements
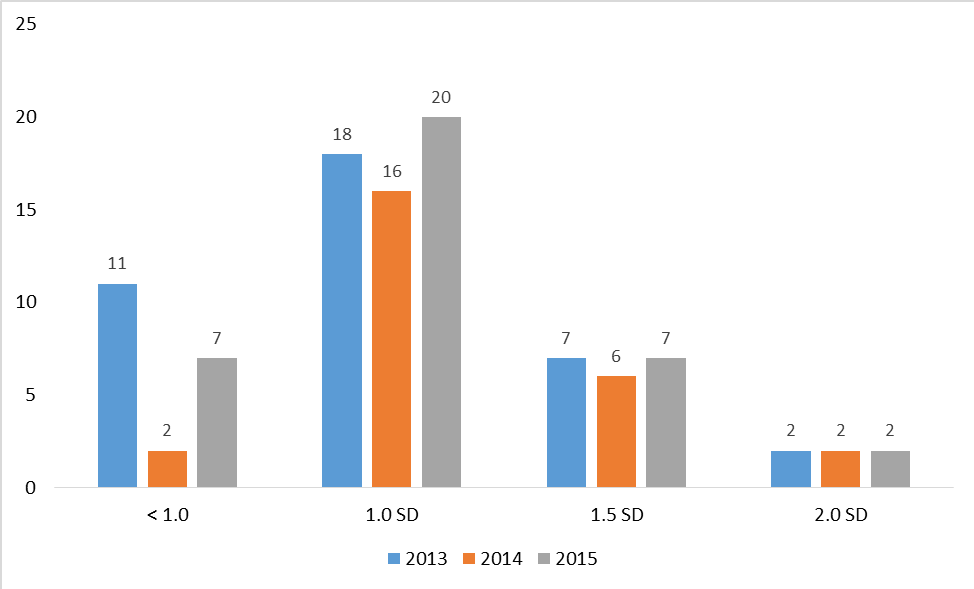
Figure 6.
Number of Bulls Failing to Meet Intramuscular Fat Eligibility Requirements
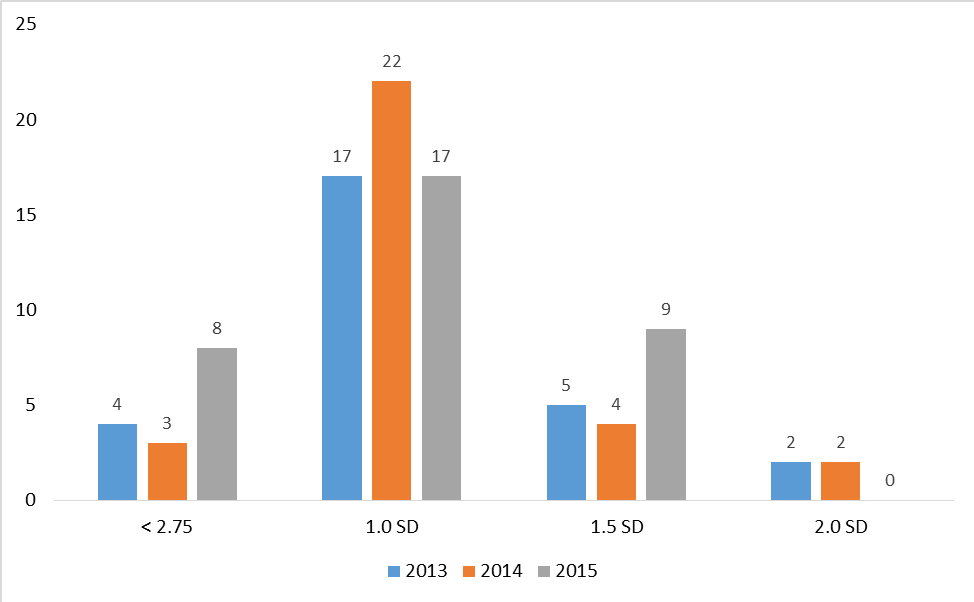
Figure 7.
Number of Bulls Failing to Meet Scrotal Circumference Eligibility Requirements
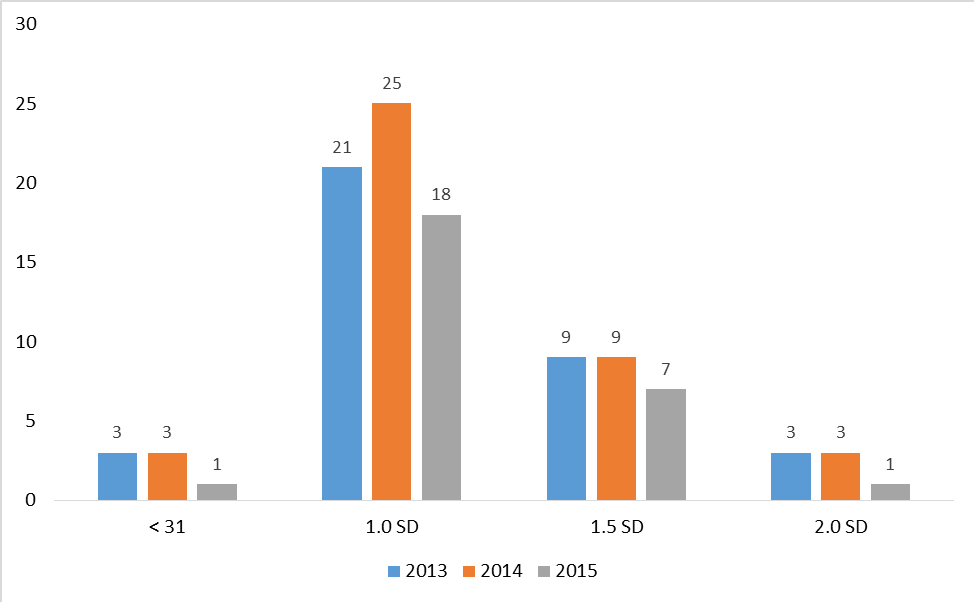
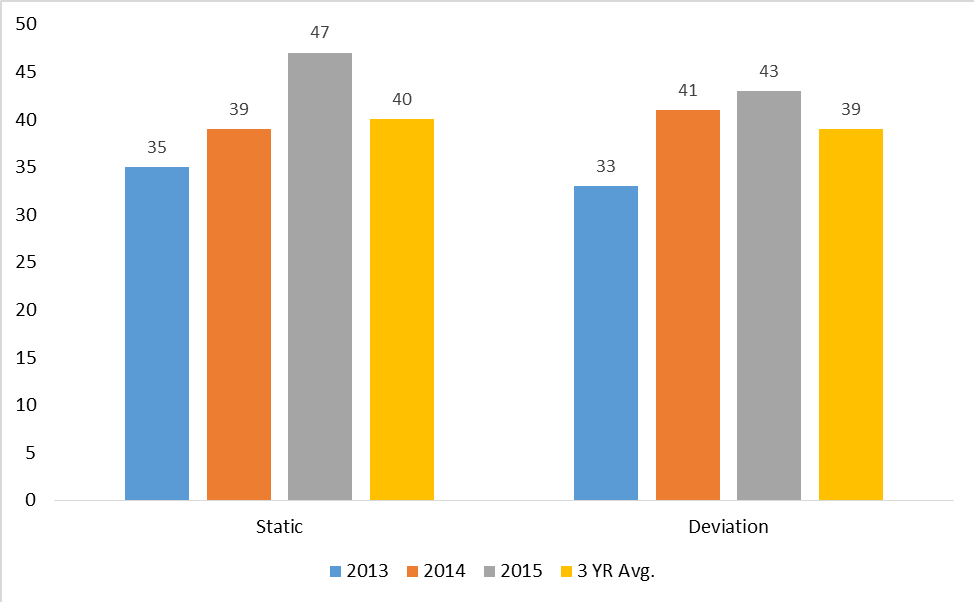
Figure 8.
Total Number of Bulls Failing to Meet All Sale Eligibility Requirements
| Trait |
Static requirement |
1.0 SD | 1.5 SD | 2.0 SD | |||
|---|---|---|---|---|---|---|---|
| Metric |
p |
Metric |
p |
Metric |
p |
||
| Average daily gain ratio | 20.00 | 20.00 | 1.00 | 9.33 | .02 | 3.33 | .01 |
| Adjusted yearling weight ratio | 9.33 | 20.33 | .03 | 9.67 | .69 | 2.67 | .16 |
| Residual feed intake (RFI), lbs DM/day | 15.00 | 20.67 | .37 | 10.33 | .47 | 4.33 | .16 |
| Ribeye area/hundredweight, in2/cwt | 6.67 | 18.00 | .03 | 6.67 | 1.00 | 2.00 | .21 |
| Adjusted intramuscular fat, % | 5.00 | 18.67 | < .01 | 6.00 | .67 | 1.33 | .12 |
| Adjusted scrotal circumference, cm | 2.33 | 21.33 | < .01 | 8.33 | < .01 | 2.33 | 1.00 |
| Total culled | 40.33 | 77.00 | < .01 | 41.67 | .79 | 15.00 | .01 |
| Note. DM = dry matter. | |||||||
Discussion
The data presented in Table 2 indicate that applying a culling level at 1.5 SD below contemporary group mean is most similar to applying the previously established static culling criteria. Only average daily gain ratio and adjusted scrotal circumference were statistically significantly different from the static requirements (p = .02 and p < .01, respectively) in this category. Additionally, the mean number of total bulls culled in the 1.5 SD category was not statistically significantly different from the static requirements (41.67 vs. 40.33, p = .79). Given that the goal of the effort was to create a more robust method for culling a similar percentage of tested animals, implementing culling criteria for the included traits at 1.5 SD below contemporary group mean is suggested; however, some adjustments should be made for the traits that were statistically significantly different from established criteria. Those adjustments are reflected in the suggested sale eligibility requirements (Table 3) that have been implemented in the Wardensville Bull Test program from 2016 to present.
| Trait | Breed groups (N ≥ 20) | Breed groups (N < 20) | |||||
|---|---|---|---|---|---|---|---|
| Average daily gain ratio | > 1.25 SD below mean | > 88 | |||||
| Adjusted yearling weight ratio | > 1.5 SD below mean | > 90 | |||||
| Residual feed intake (RFI), lbs DM/day | < 1.5 SD above mean | < 1.5 SD above mean | |||||
| Ribeye area/hundredweight, in2/cwt | > 1.5 SD below mean | > 1.00 | |||||
| Adjusted intramuscular fat, % | > 1.5 SD below mean | > 2.50 | |||||
| Adjusted scrotal circumference, cm | > 31.0 | > 31.0 | |||||
| Note. DM = dry matter. | |||||||
Performance evaluation programs are known as sources of unbiased information that can be used to assist commercial and seedstock producers in evaluating and identifying superior genetics (See, 1997); however, determining sale eligibility can be difficult. When station coordinators use the variation in the test population to eliminate the lowest ranking bulls for traits of economic importance, buyers are assured that purchased bulls will contribute to comprehensive genetic improvement, increasing overall sale value. From a station management perspective, whether public or private, increased sale value stimulates program participation and revenue. Nonetheless, the greatest challenge to implementation of this method is consignor understanding of the process because variation-based requirements fail to provide program participants in advance with the benchmarks that their consignments must surpass. As a result, station managers should provide consignors with complete performance data, individual bull rankings, and determined culling levels at the conclusion of the data collection period. Furthermore, due to the year-to-year variation in populations (Figures 2–8), procedures for adjusting sale eligibility criteria must be established. If too many or too few bulls qualify for sale, it is suggested that bulls be ranked from highest to lowest for each qualifying trait and that the eligibility criteria move up or down by one bull for each trait until the desired number is achieved.
Conclusion
These findings indicate that use of variation-based independent culling levels is an effective method of determining sale eligibility in central bull test stations and could be applied to genetic evaluation programs for other species; however, education of participating breeders is critical to successful implementation. By using this method, test station coordinators ensure potential buyers that bulls will contribute to comprehensive genetic improvement, which should increase both demand and value. Extension professionals can play a crucial role in ensuring that test station coordinators and other relevant groups appreciate the value of, understand, and correctly apply the method.
References
Bourdon, R. M. (2000). Understanding animal breeding (2nd ed.). Upper Saddle River, NJ: Prentice-Hall, Inc.
Field, T. G. (2018). Beef production and management decisions (6th ed.). Upper Saddle River, NJ: Prentice-Hall, Inc.
See, M. T. (1997). North Carolina Swine Evaluation Station: Adapting to meet the needs of a rapidly changing industry. Journal of Extension, 35(6), Article 6IAW2. Available at: https://www.joe.org/joe/1997december/iw2.php