August 2020
|
August 2020 // Volume 58 // Number 4 // Feature // v58-4a2


Measuring the Economic Benefit of Extension Leadership Programs: McLeod for Tomorrow
Abstract
Extension-led leadership programs provide economic benefits. Historically, evaluators have struggled to quantify these benefits as compared to costs. Further, leadership programs have both public and private value, which are difficult to quantify. To address gaps in understanding the value of leadership development programs, we quantified the economic benefit of the McLeod for Tomorrow leadership program. Through an alumni survey and a mind-mapping session, we collected data on the program's public and private benefits. Our findings show that each dollar invested creates $5.60 in economic benefit and that public value exceeds private value. Our article provides insights into methods for quantifying benefits of Extension programs, regardless of specialization or location.
Introduction
Leadership programming is a cornerstone of community development efforts in Extension. As leadership programs have evolved, so have evaluation standards. Stakeholders and funders often prioritize outcomes, impacts, accountability, and cost-effectiveness. It remains important for evaluators to document outcomes and impacts; however, evaluation also needs to measure monetary benefits. Extension leadership programs need to demonstrate value.
The goals of this article are to advance the understanding of evaluation techniques in measuring the economic benefit of leadership programs, to measure the value of public versus private benefits, and to address the literature gap in case studies quantifying the value of leadership programs. After a review of the literature, we present our approach to measuring the economic benefits of a community leadership program in Minnesota.
Literature Review
Leadership development program evaluation has a long history in Extension (Apaliyah, Martin, Gasteyer, Keating, & Pigg, 2012; Emery, Fernandez, Gutierrez-Montes, & Flora, 2007; Emery & Flora, 2006; Pigg, 2001) and often involves highly relevant impact frameworks such as the community capitals (Flora, Flora, & Gasteyer, 2018). Yet these evaluations have focused little on monetary benefits. Quantifying the economic benefit of programs "shows the value [of the program] in terms that managers and executives desire and understand" (Phillips & Phillips, 2007, p. 137). The focus is on assigning a dollar value to a program's outcomes and impacts to determine whether the benefits exceeded the cost.
Measuring the monetary value of a leadership development program is a complex process. One of the benefits may be personal growth, which is a private benefit and thus difficult to measure (Mahone & Bokor, 2000). The direct beneficiary of a leadership program is the participant; however, benefits extend beyond the individual. Societal, or public, impacts resulting from participants' strengthened leadership skills often take a significant amount of time to present and may be challenging to attribute exclusively to the program (Leiderman, 2008; Mahone & Bokor, 2000).
The distinction between public and private value is important as the beneficiaries are different: "Public value is created when a service [program] benefits society as a whole" (Kalambokidis, 2004, "Introduction," para. 2). Private value, meanwhile, accrues to an individual. Certain funders, such as governments and nonprofits, may find public benefits of more interest to their stakeholders. Other funders, meanwhile, might place higher emphasis on private benefits.
Phillips and Phillips (2007) identified multiple steps for measuring benefits and costs, which they labeled a return on investment (ROI) analysis (Figure 1). Planning an ROI analysis requires first identifying and documenting the research's inherent assumptions, including the value of training to the individual and the duration of program benefits to both the individual and the community (Leiderman, 2008). Duration of benefits is a critical assumption, as research has indicated that the effect of leadership programs diminishes with time (Stiefelmeyer, Rajcan, & Mussel, 2013).
Figure 1.
Return on Investment Methodology
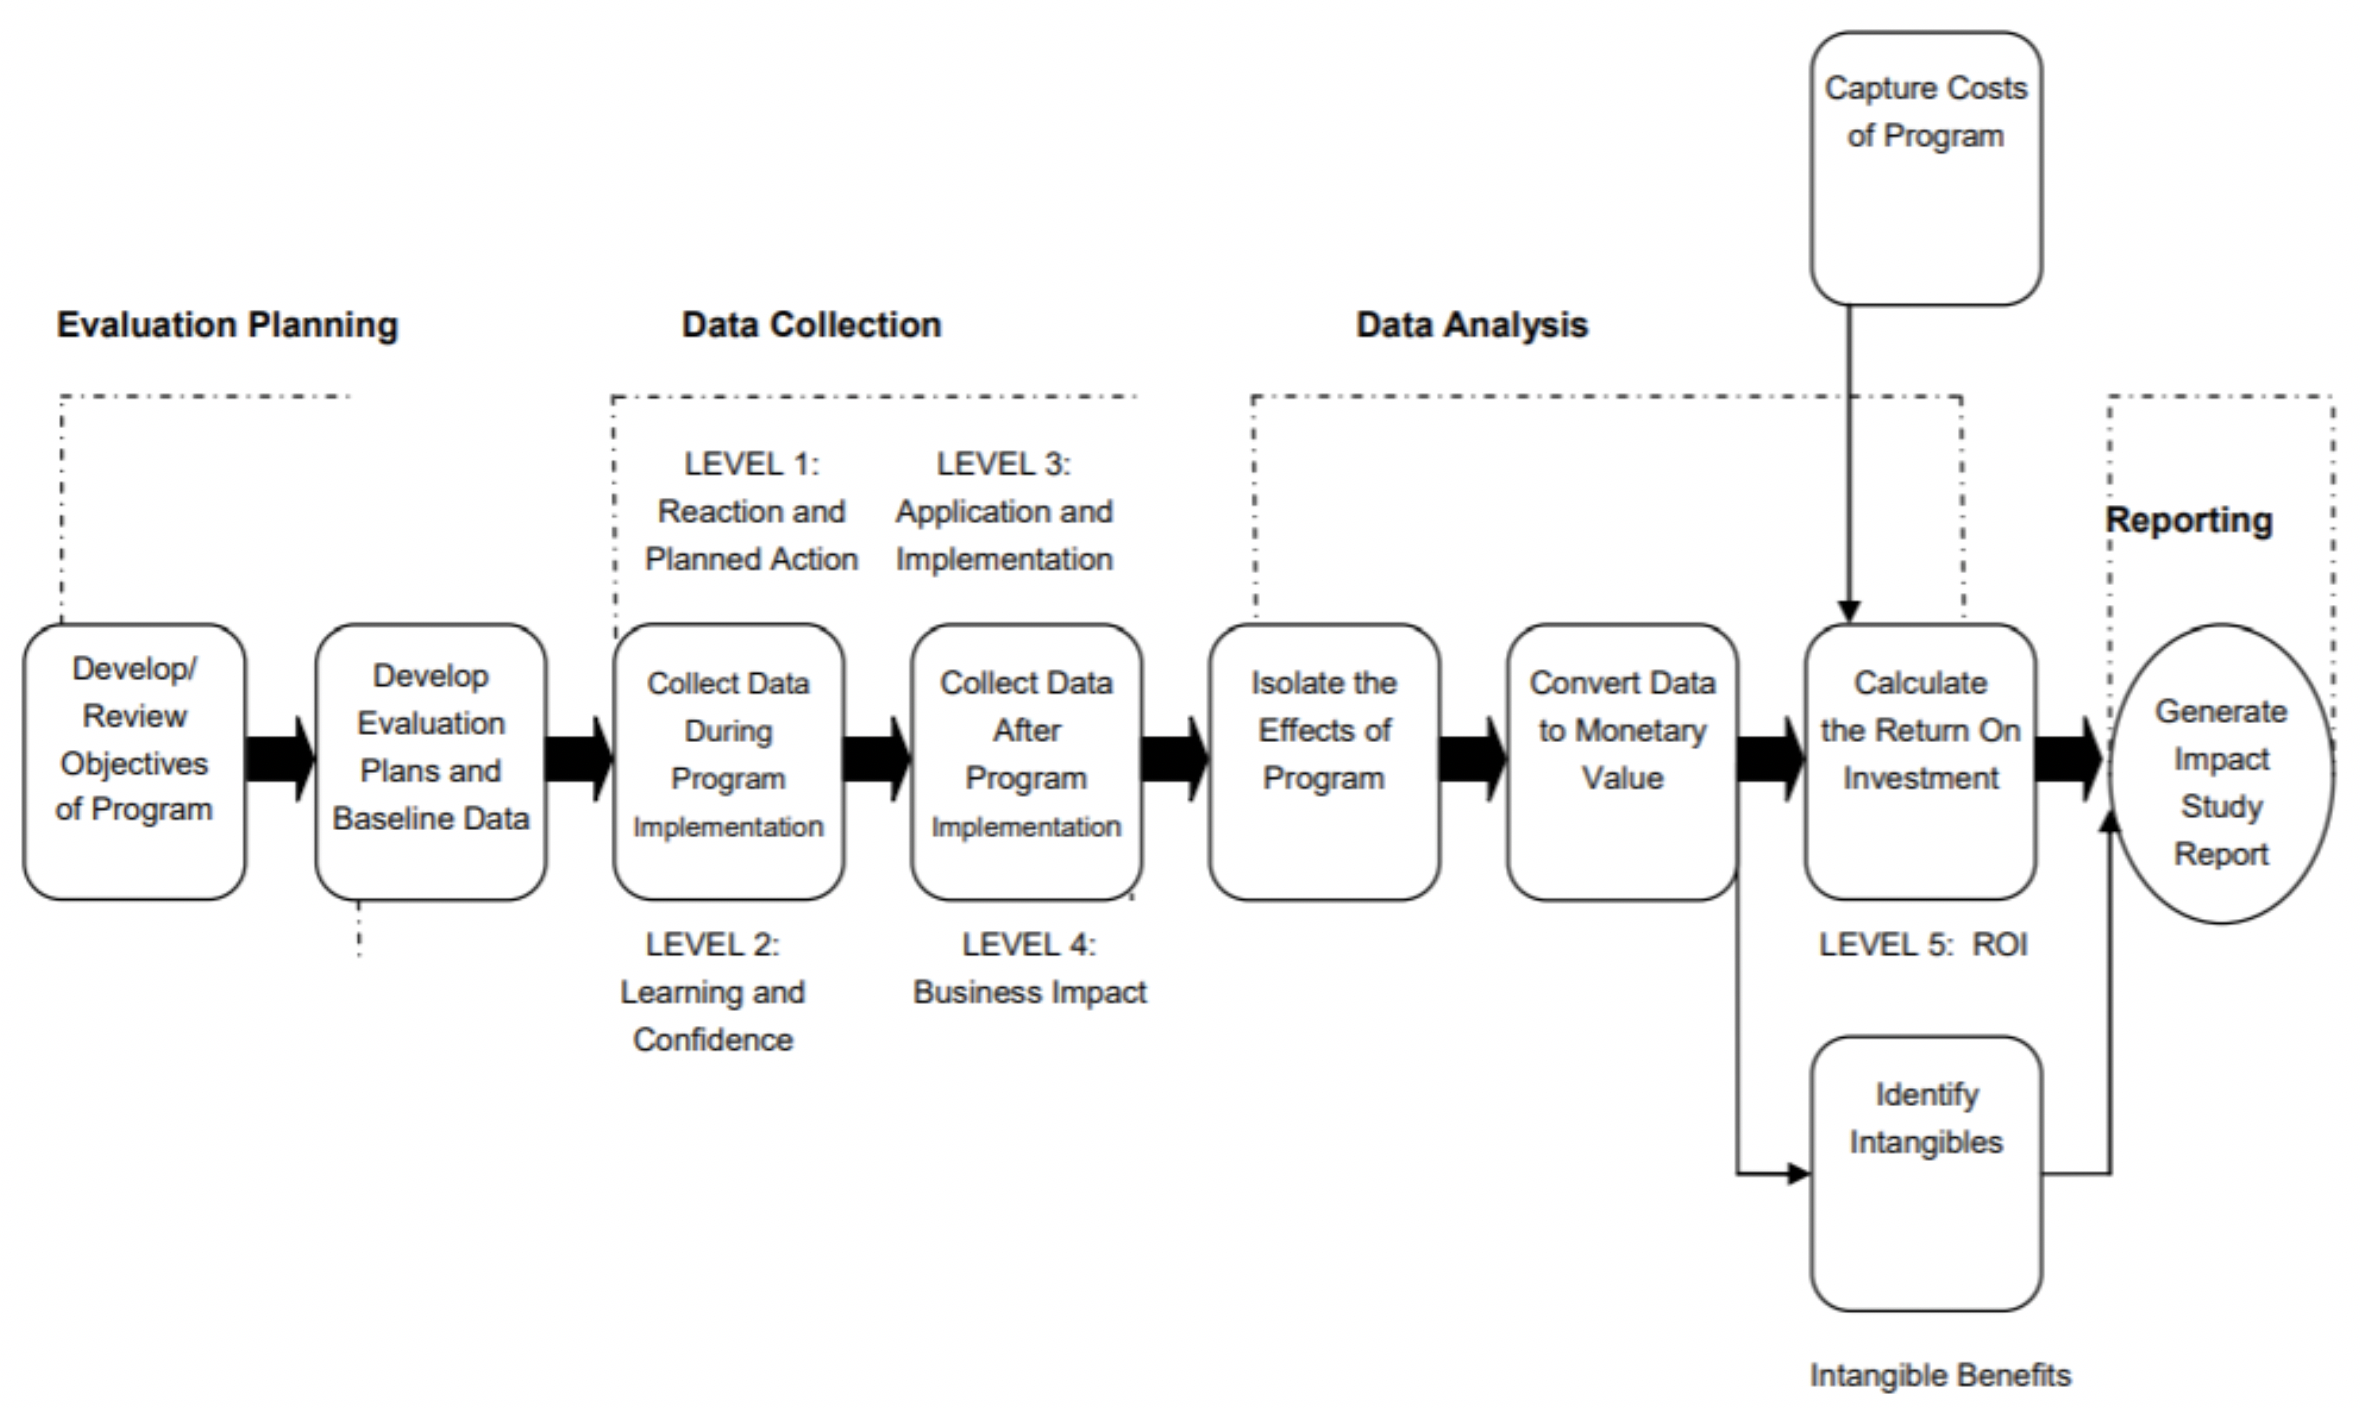
Note. From "Measuring Return on Investment in HR: A Global Initiative for HR Strategy" by J. Phillips and P. Phillips, n.d. (https://roiinstitute.net/download/measuring-roi-in-hr/). Copyright by ROI Institute. Reprinted with permission.
When planning is complete, researchers collect data at the individual, program, and community level via surveys, interviews, and other methods. Once data are collected, researchers analyze the data to "isolate the effects, convert data to money, capture costs, calculate ROI, and identify the intangibles" (Phillips & Phillips, 2007, p. 155). Rohs (2003) and Phillips and Phillips (2007) provided recommended methods for isolating program benefits and converting program data into monetary benefits. A program's costs typically include its design and delivery as well as its opportunity costs to both participants and communities (Rohs, 2003). In addition to those that are public and private, benefits include organizational capacity and effectiveness, policy change, and alumni benefits (Leiderman, 2008; Mahone & Bokor, 2000; Phillips & Phillips, 2007). Rohs (2003) observed that "program benefits, especially for leadership educators, may be harder to measure" than program costs (p. 4).
When calculating ROI, evaluators have recommended erring on the side of caution and taking a conservative approach to measuring benefits. This ensures credibility (Mahone & Bokor, 2000; Phillips & Phillips, 2007; Rohs, 2003). Extension evaluators also urge addressing the "but for" attribution principle. The attribution principle is key when documenting community impacts as it ensures that the benefits were a direct result of the program and would not have occurred "but for" the program (Morse, French, & Chazdon, 2016).
Economists are quick to differentiate between economic benefit and economic impact. The ROI approach we describe measures societal welfare change, which Watson, Wilson, Thilmany, and Winter (2007) labeled as economic benefit. This differs from economic impact and economic contribution, which measure net and gross changes in economic activity, respectively.
The final step of an ROI process is to communicate the results to stakeholders and the public. Following the steps in the ROI approach naturally leads to reporting, as argued by McGrath, Conway, and Johnson (2007). They stated that "a scholarly approach to engagement is required to generate credible evidence and leads naturally to the documentation and communication of impact" (McGrath et al., 2007, "How Do We Connect Our Work to Its Economic Drivers," para. 9).
Although evaluating ROI of leadership development programs is increasing, few case studies have reflected this methodology (Rohs, 2003). Case studies featuring an ROI approach have addressed
- a program for emerging leaders in Ontario's agri-food system (Mahone & Bokor, 2000),
- a community-based rural leadership program (Mahone & Bokor, 2000),
- a program for the development of promoted Extension administrators (Rohs, 2003),
- a fellows program for strengthening leaders of systems serving children (Leiderman, 2008),
- a community leadership program for reducing poverty (Leiderman, 2008),
- an executive leadership fellowship and alumni program for nonprofits (Leiderman, 2008), and
- economic contribution of all Extension programs in a single county (Siro, Hansen, & Hoard, 2017).
Program Background
Organizers launched the leadership development program McLeod for Tomorrow (MFT) in 2007. Its mission is bridging communication, education, and networking among individuals living and working in McLeod County, Minnesota. The program emerged from a 2007 forum held with locally elected officials to identify common economic development issues in the county. The creation of a program to develop local leaders to address these issues was a natural outcome of the discussion.
A design team, comprised of individuals representing communities throughout the county, along with University of Minnesota Extension, created the MFT program. The team designed a bridging cohort program, which brings together people from communities throughout the county to learn about leadership and to consider how their communities might grow stronger together.
The design of MFT focuses on building two types of social capital networks: bonding networks and bridging networks (Vitcenda, 2012). Bonding networks involve connections among people and groups with similar backgrounds and can assist people during times of personal trouble. Bridging networks, however, are networks among people and groups with diverse backgrounds. Bridging networks are essential in helping communities address larger challenges and capitalize on opportunities for improvement and growth (Putnam, 2000).
The first MFT cohort graduated in 2009, and today more than 200 people are alumni of the program. A volunteer board of directors, representing key county stakeholders, in collaboration with a paid program coordinator, ensures the program's sustainability and provides program leadership. Since the leadership program's beginning, the board and program alumni have collaborated to develop additional community initiatives, including events and a student leadership program.
McLeod County was an early supporter of the leadership program, initially providing the full cost of programming and dedicating county staff time to its operations. Since then, however, MFT's leaders have diversified revenue streams to include participant fees, private sponsorships, and fundraising.
Program Design
The design of MFT intentionally builds both human capital (the skills, knowledge, and abilities of individuals) and social capital (the collective power of relationships, connections, and networks) (Flora et al., 2018). A variety of activities embedded in the program's design are intended to build trust, mutual respect, community commitment, and political awareness among program participants and communities to build social capital and enhance leadership development (Day, 2000). Research has suggested that programs designed with these principles can "increase both knowledge and awareness of the community and actual engagement in the community" (Bono, Shen, & Snyder, 2010, p. 324).
The program operates as a cohort model, with 20 to 25 participants meeting for 1-day sessions for 9 months. Specific aspects of the program are intended to strengthen community capital:
- Scheduling sessions in different parts of the county allows participants to learn about each community and meet local leaders.
- Morning session leadership seminars taught in a classroom setting by Extension educators build skills participants can apply in both the workplace and community groups. Each session focuses on a leadership competency derived from University of Minnesota Extension's leadership model (Extension Center for Community Vitality, 2019). The model identifies competencies in four main areas: (a) personal leadership, (b) effective relationships, (c) analytical skills, and (d) strategic thinking.
- Afternoon sessions focus on site visits of local businesses, agricultural industries, government facilities, natural resources, and community assets.
- Panel discussions comprise community members and civic leaders addressing local issues.
- Concluding sessions include reflection and discussion regarding participants' plans for using their new networks in their personal or professional work.
- Inviting past participants to lead the subsequent year's cohort and serve as volunteers for community events encourages alumni engagement.
Evaluation Methods
We used a mixed-methods approach to document economic program benefits at both the individual level (private) and community level (public). To collect data on individual benefits, we invited all alumni of MFT for whom program staff had valid email addresses to participate in a survey. We followed survey best practices, emailing an initial invitation to the survey and then a reminder 10 days later (Salant & Dillman, 1994). A total of 156 alumni received the survey (Appendix A). Of those, 52 completed it, resulting in a 33% response rate.
Survey questions addressed volunteer hours (organizational, community, and mentoring), raises and promotions, new connections developed, and local spending. The survey design included a retrospective "post-then-pre" design. Participants estimated, for example, the time spent engaging in volunteer activities during an average month before and after their participation in MFT. We designed questions based on our own evaluation of program participants and on previous research regarding leadership program benefits (Maltsberger & Majee, 2012). In our survey, we carefully worded questions to adhere to the "but for" attribution principal (Morse et al., 2016). Thus, we measured only benefits directly resulting from program participation.
We also employed a group mind-mapping method, similar to ripple effects mapping (Chazdon, Emery, Hansen, Higgins, & Sero, 2017), to determine benefits at the community level (Appendix B). Several alumni and the program coordinator were invited to the session, which began with a group discussion of community events or activities that would not have occurred "but for" MFT. A major event specifically created by MFT alumni is the county's Winterfest celebration. A second event sponsored by MFT alumni is Glow Run, a 5K race. Also, alumni launched a student leadership program and scholarship.
Each activity identified during the large-group discussion became the focus of small-group discussions exploring the community economic benefits. These discussions were important because they forced participants to come to agreement about which activities, and thus benefits, were attributable to MFT. Following small-group sessions, we conducted follow-up interviews with community contacts to collect data on benefits. Economic benefits, among other things, included the Winterfest budget and hours volunteered for the student leadership program. We specifically focused on gathering information for activities occurring in 2017.
Data Analysis
We calculated the total benefits and costs for the most recent cohort year (2017) and then for the entire duration of the program. We divided the benefits and costs into private and public categories. We characterized those associated with the individual participants as private. We categorized benefits received and costs borne by the community as public. Table 1 summarizes the items included as benefits and costs by value.
| Value | Benefits | Costs |
|---|---|---|
| Private, calculated | Salary increases New economic opportunities | Tuition |
| Public, calculated | Volunteer time Local spending | None |
| Public, given | New events | County contribution Business donations |
| Note. "Calculated" indicates that the value was extrapolated from survey results to represent the entire population. "Given" indicates that the data were directly collected from the source and not estimated. | ||
We categorized MFT operations as both a cost and a benefit. Direct spending by the program was a cost. In-kind donations and volunteer hours, which would not have existed without the program, were benefits.
The evaluation process identified two major private benefits—individual salary increases and new economic opportunities for program participants. New economic opportunities included a collaborative project between participants, a new job, and a new community project. We calculated the average increases per participant and then extrapolated these numbers across all participants.
The evaluation process also identified multiple public benefits. Participants reported additional volunteer hours, increased local spending, and the development of new local events. We collected data to measure the value of each of these items, as follows:
- First, we measured the benefit of additional hours volunteered. Participants reported higher levels of volunteering both in and outside the program directly resulting from their participation. To measure the value of this volunteerism, we calculated the average increase per participant. We then extrapolated the average across all participants. We obtained the value of an hour of volunteer time from an analysis by Independent Sector (Independent Sector, 2018). Independent Sector is a national organization whose membership includes charitable organizations, nonprofits, foundations, and corporations. Each year, the organization undertakes a national survey to quantify the value of volunteering.
- Second, we calculated the value of increased local spending by participants. Using our participant survey data, we calculated the average increase per person and extrapolated across all MFT participants.
- Third, we collected data on the new events created by MFT program alumni. Data collected included the budgets for Winterfest, Glow Run, the student leadership program, and the student scholarship. In addition to direct spending, we gathered data on in-kind donations. As MFT alumni formed these events directly as a result of the program, we included the entire budget for each.
After quantifying the benefits, we measured the costs of the MFT program. The major cost is the operation of the program. Each participant pays tuition to join the program (private cost). In addition, MFT collects sponsorships from local businesses and from the county (public cost).
In calculating cumulative economic benefit, we considered two factors. First, the value of a dollar changes with time. Therefore, we adjusted all dollar values to 2017 dollars. Second, the value of leadership training changes with time. During the first few years postgraduation, participants apply their new skills, abilities, and knowledge to their work, increasing their effectiveness. At some point, however, participants fully adopt their new skill set and establish a new normal. Leadership research has indicated that the benefits of participation continue for 10 years (Stiefelmeyer et al., 2013). Therefore, we adjusted the annual value of the program for length of time from program completion. In addition, MFT added Winterfest and Glow Run in later years of the program. We added the value of each event starting the year it commenced.
Findings
Table 2 details the economic benefit of the MFT leadership program in 2017. As shown in the table, MFT generated $167,855 in net benefits. This translated into a $5.60 net benefit for each dollar invested in the program. The net public value was more than twice the net private value. For each dollar invested, the program returned $7.26 in public value and $2.92 in private value.
| Type | Benefit | Cost | Net |
Return (net benefit over cost) |
|---|---|---|---|---|
| Private | $44,640 | −$11,400 | $33,240 | $2.92 |
| Public | $153,165 | −$18,550 | $134,615 | $7.26 |
| Total | $197,805 | −$29,950 | $167,855 | $5.60 |
Table 3 details the cumulative economic benefit of the MFT leadership program. As highlighted in the table, MFT generated $555,500 of total benefit between 2008 and 2018. This represented a $5.43 net benefit over the program's total investment. Public value constituted 76% of the program's cumulative net benefit.
| Type | Benefit | Cost | Net |
Return (net benefit over cost) |
|---|---|---|---|---|
| Private | $175,600 | −$44,800 | $130,800 | $2.92 |
| Public | $482,200 | −$57,500 | $424,700 | $7.39 |
| Total | $657,800 | −$102,300 | $555,500 | $5.43 |
Leadership programs provide a variety of benefits beyond economics, as dollars and cents cannot measure all worth. As a bridging program, MFT also has the goal of developing social capital, or connections among participants. On average, each respondent created 10.5 new connections with other individuals in the county and 8.8 new connections with individuals from the respondent's own community.
Conclusions, Implications, and Recommendations
Our analysis suggests that leadership programs provide a net benefit to participants and communities. It illustrates that leadership programs with a bridging focus have a higher share of public benefit compared to private benefit. These results are consistent with previous research on University of Minnesota Extension's bridging programs, which indicated that participants had the highest gains in leadership competencies related to understanding community context and future orientation (items correlated with public value) and that items pertaining to personal growth (items correlated with private value) had smaller increases among participants (Rasmussen, Armstrong, & Chazdon, 2011).
Our study has implications for measuring the economic benefit of Extension programming across disciplines. First, it demonstrates the benefit of pairing evaluation techniques (surveys and mind maps) with economic impact principles. Traditionally, an evaluation process ends with the collection of outcomes without attaching economic benefit. Economic impact studies, correspondingly, often limit themselves to participant surveys. By combining the two, we measured both the public and private benefits of the MFT leadership program.
Second, our study indicates that measures of economic benefit should determine public and private benefits separately. The MFT leadership program, built on the bridging model, accumulated a higher public value than private value. Other Extension programs, however, may have a focus on the individual, thus reflecting a higher private value.
Finally, our study provides implications for those seeking public support of Extension leadership programs. MFT, such as many Extension programs, began with a substantial investment from local government. During a time when local leadership is becoming increasingly necessary and public funds increasingly scarce, documenting benefits to elected officials is crucial.
Our study advances the understanding of measures related to the benefit of leadership programs. We have recommendations for future research. First, research might include interviews with nonrespondents to measure any differences in answers. In any survey process, the possibility of surveying errors, especially nonresponse error, exists (Salant & Dillman, 1994). To minimize the effect of this error, we invited all former MFT leadership program participants to complete the survey. Our analysis also did not address business benefits and costs. We did not survey businesses to determine the benefits of an employee's participation (e.g., increased productivity). Correspondingly, we also did not quantify business costs such as time away from the office. Finally, our analysis inherently assumes that participants from all cohorts had similar outcomes. Future research might provide a comparison of different cohorts.
Author Note
Hannah J. Bohn currently works as a sustainability specialist at the Minnesota Chamber of Commerce in Saint Paul, Minnesota.
References
Apaliyah, G. T., Martin, K. E., Gasteyer, S. P., Keating, K., & Pigg, K. (2012). Community leadership development education: Promoting civic engagement through human and social capital. Community Development, 43(1), 31–48.
Bono, J. E., Shen, W., & Snyder, M. (2010). Fostering integrative leadership development. Leadership Quarterly, 21(2), 324–335.
Chazdon, S., Emery, M., Hansen, D., Higgins, L., & Sero, R. (2017). A field guide to ripple effects mapping. Minneapolis, MN: University of Minnesota Libraries Publishing. Retrieved from www.z.umn.edu/rembook
Day, D. V. (2000). Leadership development: A review in context. Leadership Quarterly, 11(4), 581–613.
Emery, M., Fernandez, E., Gutierrez-Montes, I., & Flora, C. B. (2007). Leadership as community capacity building: A study on the impact of leadership development training on community. Community Development, 38(4), 60–70.
Emery, M., & Flora, C. (2006). Spiraling-up: Mapping community transformation with community capitals framework. Community Development, 37(1), 19–35.
Extension Center for Community Vitality. (2019). Leadership model. Retrieved from https://extension.umn.edu/leadership-education-offerings/leadership-model
Flora, C. B., Flora, J. L., & Gasteyer, S. P. (2018). Rural communities: Legacy and change (5th ed.). New York, NY: Routledge.
Independent Sector. (2018, April 18). The value of volunteer time: State and historical data. Retrieved from https://independentsector.org/resource/vovt_details/
Kalambokidis, L. (2004). Identifying the public value in Extension programs. Journal of Extension, 42(2), Article 2FEA1. Available at: https://www.joe.org/joe/2004april/a1.php
Leiderman, S. (2008). Investigation of cost benefit analyses of leadership programs [PDF file]. Center for Assessment and Policy Development. Retrieved from http://leadershiplearning.org/system/files/Leadership%20Program%20Cost-Benefit%20Analysis_1.pdf
Mahone, J., & Bokor, C. (2000). Valuing leadership training: Economic impacts and return on investment [PDF file]. Retrieved from https://www.leadershipeducators.org/Resources/Documents/Conferences/2000/Mahone.pdf
Maltsberger, B., & Majee, W. (2012). Building regional networking capacity through leadership development: The case of Leadership Northwest Missouri. Journal of Extension, 50(4), Article v50-4a3. Available at: https://joe.org/joe/2012august/a3.php
McGrath, D. M., Conway, F. D., & Johnson, S. (2007). The Extension hedgehog. Journal of Extension, 45(2), Article 2FEA1. Available at: https://www.joe.org/joe/2007april/a1.php
Morse, G., French, C., & Chazdon, S. (2016). The impact indicators tips booklet: Practical and credible methods for using the "but for" rule to document Extension community development impacts (Northeast Regional Center for Rural Development Working Paper No. 55). State College, PA: Penn State University.
Phillips, J., & Phillips, P. (n.d.). Measuring return on investment in HR: A global initiative for HR strategy. Retrieved June 26, 2019, from ROI Institute website: https://roiinstitute.net/download/measuring-roi-in-hr/
Phillips, J., & Phillips, P. (2007). Measuring return on investment (ROI) in leadership development. In K. M. Hannum, J. W. Martineau, & C. Reinelt (Eds.), The handbook of leadership development evaluation (pp. 137–166). San Francisco, CA: Jossey-Bass.
Pigg, K. E. (2001). Excel: Experience in community enterprise and leadership. University of Missouri, Columbia, MO: University Extension and Outreach.
Putnam, R. D. (2000). Bowling alone: The collapse and revival of the American community. New York, NY: Simon and Schuster.
Rasmussen, C., Armstrong, J., & Chazdon, S. (2011). Bridging Brown County: Captivating social capital as a means to community change. Journal of Leadership Education, 10, 63–82.
Rohs, F. R. (2003). Leadership development: Return of investment. Calculating the monetary value of the managerial assessment of proficiency program for the Georgia Extension System. Retrieved from https://eric.ed.gov/?id=ED479653
Salant, P., & Dillman, D. A. (1994). How to conduct your own survey. New York, NY: John Wiley & Sons, Inc.
Siro, R., Hansen, D., & Hoard, S. (2017). Evaluating economic impact at the community level: A pilot of REM in action. Paper presented at the 2017 Annual Meeting of the American Evaluation Association, Washington, DC.
Stiefelmeyer, K., Rajcan, I., & Mussel, A. (2013). Social and economic return on investment of the Advanced Agricultural Leadership Program [PDF file]. Ontario, Canada: George Morris Center. Retrieved from http://www.ruralontarioinstitute.ca/uploads/userfiles/files/SROI%20FINAL%20Report_31%20Jan%202013.pdf
Vitcenda, M. (2012). Creating connections for better communities. Retrieved from https://extension.umn.edu/vital-connections/creating-connections-better-communities
Waston, P., Wilson, J., Thilmany, D., & Winter, S. (2007). Determining economic contributions and impacts: What is the difference and why do we care? The Journal of Regional Analysis and Policy, 37(2), 1–15.
Appendix A
McLeod for Tomorrow (MFT) Leadership Program Survey
- To start, please type the names of organizations, community projects, or volunteer opportunities with which you have become involved or increased your involvement as a result of your participation in McLeod for Tomorrow. This may include increased leadership in a workplace or a volunteer capacity.
-
Time commitments. This question asks you to reflect on time spent engaging in community activities during an average month before and after you participated in McLeod for Tomorrow. For activities that may not happen monthly, think about a full year and divide by 12.
- Average hours per month volunteered with an organization (on boards, committees, etc.) - Before you participated in MFT?
- Average hours per month volunteered with an organization (on boards, committees, etc.) - Since you participated in MFT?
- Average hours per month volunteered for community events? - Before you participated in MFT?
- Average hours per month volunteered for community events? - Since you participated in MFT?
- Average hours per month training or mentoring (formal or informal) others for leadership? (in a workplace or volunteer capacity) - Before you participated in MFT?
- Average hours per month training or mentoring (formal or informal) others for leadership? (in a workplace or volunteer capacity) - Since you participated in MFT?
- Average hours per month conducting other community activities not specified above (please type the activity below)
- Average hours per month conducting other community activities not specified above (please type the activity below) - Before you participated in MFT?
- Average hours per month conducting other community activities not specified above (please type the activity below) - Since you participated in MFT?
-
Local spending. As a result of your participation in McLeod for Tomorrow, have you increased your spending in McLeod County, as compared with outside McLeod County?
- Yes No
- If yes, please estimate the increased dollar amount per month, on average, that you have spent in the county. For occasional activities that may not happen monthly, think about a full year and divide by 12.
-
Have you received a salary increase, bonus, or promotion that was at least in part connected to your participation in the MFT program?
- Yes No
- If yes, the increase was connected to my participation in MFT (please type your dollar estimate of the gross increase per year).
-
Connections made. Please estimate the number of new connections you made as a result of the program in the following categories.
- Connections with elected officials in my community (may include officials who represent the community, but do not live there)
- Connections with elected officials in other communities in McLeod County
- Connections with other individuals in my community
- Connections with other individuals in other communities in McLeod County
- Connections with organizations in my community
- Connections with organizations in other communities in McLeod County
- Did any of these new connections lead to a new opportunity (collaborative activity, new job, community project)?
- Yes No
- If yes, please describe
- Did these new opportunities generate an economic benefit or result? (such as new income to the community, grants, new funding, new building or infrastructure projects)?
- Yes No
- If yes, please type an estimate of the economic benefit in dollars
- Do you have any other comments about individual or community benefits derived from the McLeod for Tomorrow Program?
- If you would be interested in participating in the second phase of this project—a group discussion about the community benefits of the program—please type your name and email address below.
Appendix B
McLeod for Tomorrow (MFT) Leadership Program Mind Map Agenda
McLeod for Tomorrow – Quantify the Benefits
Community Benefit Mapping Session Agenda
Thursday, May 17, 2018, 2:00 – 4:00 P.M., Crow River Winery, Hutchinson
Introduction and Brief Overview (2:00-2:15)
The University of Minnesota Extension Center for Community Vitality and McLeod for Tomorrow are hosting this session to better understand the community benefits of McLeod for Tomorrow. Today’s session will use a visual “mind mapping” method to help you to reflect upon and visually map community benefits and their monetary value.
We begin with a brief discussion of community events or activities that would not have occurred if MFT did not exist. Each of these events/activities will be the focus of small group discussion to dig deeper into questions about community benefits. From earlier evaluation efforts we have identified the following list:
- WinterFest
- Student leadership program / Scholarships
- McLeod for Tomorrow program activities (ex. serving on board or day chair, hosting a business visit) / McLeod for Tomorrow 2.0
- Glow Run
- Trails / recreational map
- Others to add?
Small Group Discussions of Community Activities Spawned by MFT (2:15-2:55)
Each participant will be assigned to a group to discuss each of these activities. In your groups, please read and answer the following questions, and write your group’s responses on the large sticky notes (one response per sticky note). During the small group discussion, we will collect the sticky notes so the responses can be typed into a mind map.
Human capital benefits
In what ways has this activity increased skills or changed attitudes in ways that benefit McLeod County?
Civic/political benefits
In what ways has this activity mobilized public participation (including volunteerism) or influenced the distribution of public resources in the county?
Social capital benefits
In what ways has this activity strengthened or expanded trust or connections among people, groups, and organizations and their resources in the county?
Health benefits
In what ways has this activity promoted physical, mental, or spiritual well-being among county residents?
Cultural benefits
In what ways has this activity supported diverse perspectives in the community? In what ways has this activity helped transmit knowledge of spiritual, cultural heritage, artistic expression, and traditions to future generations?
Financial benefits
In what ways has this activity generated private and public wealth that is invested in the community?
Building and infrastructure benefits
In what ways has this activity led to improvement and creation of structures (e.g. housing, retail, etc.) or infrastructures, such as transportation, that strengthen the community?
Natural resource benefits
In what ways has this activity increased the ability to provide local food sources or protect landscape, air, water, soil, and biodiversity of both plants and animals?
Mapping and Asking “Quantifying” Questions (2:55-3:50)
Please review the handout entitled Measuring Economic Value Activity. We will go from activity to activity adding estimates of economic value to the mind map. If there is a contact person who would likely have more information for us, please give us their name and email address!
Reflecting and Closing (3:50-4:00)
- We will collect additional data as needed to finalize this community benefits map.
- We will compile the information provided from this process with our earlier survey to create a report of the Return on Investment from McLeod for Tomorrow.
- What is most interesting about the map to you?
- Any last minute insights or ideas that we should add?
- THANK YOU for your help here today and for your efforts in your communities!