April 2020
|
April 2020 // Volume 58 // Number 2 // Research In Brief // v58-2rb7


Lesson Worksheets: A Tool for Developing Youth Weather and Climate Science Comprehension
Abstract
At an Extension youth agricultural science center, our team developed and pilot tested a five-lesson weather and climate science curriculum for middle school–aged youths. As part of the endeavor, we conducted an item analysis of the five worksheets used across the lessons and determined relationships between worksheet scores and pretest/posttest science comprehension improvement scores. Results from 88 primarily Hispanic eighth graders indicated that worksheet performance was related to overall science comprehension, science knowledge, and weather and climate resiliency in agriculture and natural resources lesson improvement scores. Results support the use of formative scaffolding tools such as worksheets in Extension youth programming to improve youth science comprehension.
Introduction and Conceptual Framework
Climate change is affecting agriculture and forcing producers to mitigate and adapt to the changes (Johnson, 2019; Lengnick, 2018; U.S. Global Change Research Program, 2018). How do we in Extension educate people about the growing threat of climate change to agricultural and natural resources systems? One way is to develop programs and curricula based in science, technology, engineering, and math (STEM) (U.S. Department of Education, n.d.) to teach youths about weather and climate and how agriculturalists can mitigate and adapt to weather and climate extremes. Donaldson, Franck, and Baker (2020) emphasized the coordination of land-grant university "Extension and research enterprises to produce evidence-based STEM programs for children and youths" ("Summary," para 2). Some innovative climate science programs for youths have been reported previously in Journal of Extension (Kinsey & Haberland, 2012; Pathak, Bernadt, & Umphlett, 2014). Such Extension-based programs and curricula are important for preparing youths to enter STEM/agriscience careers and to function as informed citizens. In this article, we address the development and pilot testing of worksheets as a component of a new evidence-based youth weather and climate science curriculum.
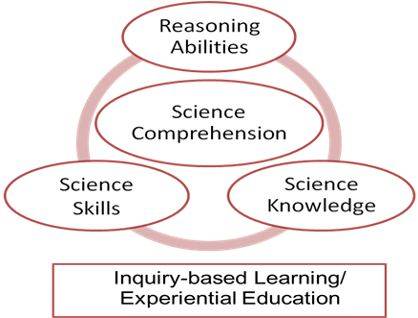
From various theories on experiential learning (Bourdeau, 2004; Cervetti, Pearson, Bravo, & Barber, 2006; Kolb, 1984; McLeod, 2017; Swinehart, 1992) and inquiry-based learning (National Research Council, 2000; Pedaste et al., 2015; Wilhelm & Beishuizen, 2003), we conceptualized a teaching and learning model to improve youth science comprehension (Skelton, Seevers, Dormody, & Hodnett, 2012). The basic premise for the model (Figure 1) is that when students engage in (a) inquiry-based and (b) experiential lessons designed to improve (c) science knowledge, (d) science skills, and (e) science reasoning abilities in a content area, their science comprehension will grow (Skelton, Dormody, & Dappen, 2016, p. 85).
Figure 1.
Extension and Research Youth Agricultural Science Center Conceptual Model for Improving Youth Science Comprehension
The model was previously tested by Skelton, Dormody, and Lewis (2016), Skelton, Blackburn, Stair, Levy, and Dormody (2018), and Dormody, Skelton, Rodriguez, Dubois, and VanLeeuwen (2019). All three studies indicated that positive effects on science comprehension are achieved when the model is used in designing and teaching curricula. For example, in our 2019 study, we found that when a model-based five-lesson weather and climate curriculum was taught to eighth-grade students, improvement from pretest to posttest occurred for overall science comprehension scores; science knowledge, science skills, and reasoning abilities scores; and scores on four of the five lessons.
This article is an extension of our 2019 study and focuses on the use of worksheets in the five lessons. We are supporting learning through scaffolding (Belland, 2014; Mulvahill, 2018) by using worksheets to build on student knowledge and experiences leading to development of new skills and enhanced reasoning abilities. Worksheets are a type of graphic organizer and formative assessment used to motivate, guide, and promote learning as students progress toward the summative test on the information. Formative assessments can enhance youth science and math learning (Black & Harrison, 2004; Ruiz-Primo & Furtak, 2007; Seeratan, 2011). They also can help teachers monitor progress and improve instruction (Fuller & Dawson, 2017; Penuel, Boscardin, Masyn, & Crawford, 2007; Tanner, 2013).
From an Extension program perspective, the worksheet is important because it functions as a curriculum guide youths can use to follow along with the facilitator as the lesson is taught, identify information that leads to a deeper understanding of content, and develop scientific skills and scientific reasoning abilities. Use of worksheets also allows the facilitator to identify science comprehension gaps. For our study, worksheets guided students through five lessons as they answered content questions, followed protocols for experiments and data analysis activities, entered and graphed data, and wrote hypotheses and conclusion statements.
Purpose and Research Objectives
Our purpose was to determine whether science comprehension scores from lesson worksheets were related to pretest/posttest science comprehension improvement scores for eighth-grade youths who were taught an Extension-developed weather and climate curriculum. Specific objectives were as follows:
- Determine student worksheet scores for individual items; each lesson; science knowledge, science skills, and reasoning abilities items; hypotheses and conclusion statements; graphing exercises; and the whole curriculum.
- Determine whether relationships exist between worksheet scores and science comprehension improvement scores in science knowledge, science skills, reasoning abilities, and overall science comprehension.
- Determine whether relationships exist between worksheet scores and science comprehension improvement scores for each of the five lessons.
Methods
Research Design and Participants
Within the context of programming at the New Mexico State University Extension and Research Youth Agricultural Science Center in Las Vegas, New Mexico (Skelton & Dormody, 2009), we developed and pilot tested weather and climate science curriculum worksheets employing the one-group pretest–posttest design (Campbell & Stanley, 1963). The target population for the study was 120 eighth-grade students grouped into five science classes at Memorial Middle School in Las Vegas, New Mexico. Of these students, 88 (73.33%) submitted informed assent and consent forms and completed the pretest, posttest, and worksheets. The sample included 78 (88.64%) Hispanic students, 38 (43.18%) female and 50 (56.82%) male students, and 13 (14.77%) special needs students.
Treatment
After the pretest was administered, one member of our team taught the curriculum to the five classes over 6 days of 50-min class periods. The lessons integrated the five components of the Skelton et al. (2012) youth science comprehension model. Lesson 1 was on the water cycle, Lesson 2 on the greenhouse effect, Lessons 3 and 4 on weather stations and how to access and analyze online local precipitation and temperature data (National Oceanic and Atmospheric Administration Regional Climate Centers, n.d.), and Lesson 5 on how to mitigate and adapt to weather and climate extremes in agriculture and natural resources. Because scientists usually work in teams, we organized the students in teams of four to set up three experiments and teams of two to share an iPad and complete online precipitation and temperature protocols. Students completed a worksheet while progressing through each lesson. The fifth lesson was followed by the posttest.
Instrumentation
The pretest/posttest consisted of two multiple-choice science knowledge questions (tied to the content taught in each lesson), two science skills questions (tied to the scientific skills taught in each lesson), and two reasoning abilities questions (tied to the hypothesis development and testing completed in each lesson) for each of the five lessons, for a total of 30 1-point questions. To ensure content and face validity, test questions were drawn from the objectives and written to be consistent with the worksheets.
To ensure worksheet content and face validity, worksheet items were drawn from the lesson objectives and covered all learning activities. Worksheets were two or three pages long. Each started with one or two science knowledge questions from the lesson's introductory PowerPoint presentation and activating strategy. Science skills were measured with combinations of questions, protocols, tables for data entry, and graphing exercises corresponding to a lesson's experiment or data analysis activity. Reasoning ability was addressed with directions and places to write hypotheses and conclusions statements. The researcher who taught the curriculum graded the worksheets using answer keys that included rubrics for evaluating graphs, hypotheses, and conclusions statements. Students on a team that completed a science skill correctly received full points for the protocol on their worksheet.
The pretest/posttest and worksheets could be divided into equivalent halves for split-halves reliability testing. When applied to our pilot test data, the Spearman-Brown prophecy formula yielded split-halves reliability coefficients of 0.68, 0.74, and 0.82 for the pretest, posttest, and worksheets, respectively.
Data Analysis
Objective 1 was analyzed descriptively for all the items on the worksheets by all the students who attempted each item and the sets of items articulated in Objective 1 (Table 1 in the "Results" section). We calculated averages and percentage correct for the sets of items by summing the average points correct for each item in the set and dividing by the points possible. The graphing exercises were completed by students if there was time to do so before the end of the lesson.
We analyzed Objective 2 by correlating the worksheet scores with science comprehension improvement scores from the pretest to the posttest (Table 2 in the "Results" section). These scores controlled for student random effects such as test-taking ability whereas pretest and posttest scores could not. We analyzed Objective 3 similarly by correlating scores for a particular worksheet with the improvement scores on the test questions designed for that lesson. For the Objectives 2 and 3 analyses, we coded missing values as zero following the logic that by not trying a worksheet item, the student did not get a chance to practice that item before taking the posttest. Because we were studying the relationships between practice on the worksheet and pretest/posttest improvement, it made sense to code a lack of practice as a zero. With this approach, we were able to keep all 88 students who completed the pretest and posttest in the correlational analyses. We analyzed all objectives using SAS version 9.3 software (SAS Institute Inc., 2011), and significance for Objectives 2 and 3 was defined as p ≤ .05.
Results
Objective 1
On the 27 worksheet items and the 12 sets of items listed in Table 1, students averaged less than 70% correct responses on only two science knowledge items, one science skills item, and one reasoning abilities item. Average worksheet scores were all above 75% correct, with the highest at 92%. Among the three science comprehension model components, students had their highest average (94% correct) on science skills. Students averaged 75% correct responses on science knowledge and reasoning abilities items. The overall average of correct responses across all items was 83%.
| Lesson number | Worksheet item or set of items | No. | Points possible | M | SD | % Correct |
|---|---|---|---|---|---|---|
| 1 | Science knowledge | 75 | 9 | 6.12 | 2.52 | 68.00 |
| 1 | Science skills | 73 | 3 | 3.00 | 0.00 | 100.00 |
| 1 | Reasoning abilities (hypothesis) | 71 | 3 | 2.46 | 0.62 | 82.00 |
| 2 | Science knowledge 1 | 75 | 6 | 3.04 | 2.11 | 50.67 |
| 2 | Science knowledge 2 | 73 | 6 | 4.47 | 1.59 | 74.50 |
| 2 | Science skills | 78 | 7 | 7.00 | 0.00 | 100.00 |
| 2 | Reasoning abilities (hypothesis) | 76 | 3 | 2.15 | 0.64 | 71.67 |
| 3 | Science knowledge | 74 | 5 | 4.06 | 1.17 | 81.20 |
| 3 | Science skills 1 | 56 | 1 | 0.96 | 0.19 | 96.00 |
| 3 | Science skills 2 | 62 | 1 | 0.87 | 0.34 | 87.00 |
| 3 | Science skills 3 | 61 | 3 | 2.43 | 0.94 | 81.00 |
| 3 | Science skills 4 (table) | 73 | 7 | 6.77 | 1.17 | 96.71 |
| 3 | Science skills 5 (graph) | 28 | 3 | 2.55 | 0.67 | 85.00 |
| 3 | Reasoning abilities 1 (hypothesis) | 64 | 3 | 1.98 | 0.76 | 66.00 |
| 3 | Reasoning abilities 2 (conclusion) | 63 | 2 | 1.50 | 0.55 | 75.00 |
| 4 | Science knowledge | 79 | 5 | 4.63 | 0.95 | 92.60 |
| 4 | Science skills 1 | 61 | 1 | 0.97 | 0.18 | 97.00 |
| 4 | Science skills 2 | 70 | 1 | 0.96 | 0.20 | 96.00 |
| 4 | Science skills 3 | 67 | 1 | 0.93 | 0.26 | 93.00 |
| 4 | Science skills 4 (table) | 78 | 7 | 6.91 | 0.69 | 98.71 |
| 4 | Science skills 5 (graph) | 60 | 3 | 2.78 | 0.38 | 92.67 |
| 4 | Reasoning abilities 1 (hypothesis) | 71 | 3 | 2.11 | 0.69 | 70.33 |
| 4 | Reasoning abilities 2 (conclusion) | 67 | 2 | 1.82 | 0.41 | 91.00 |
| 5 | Science knowledge | 77 | 5 | 4.58 | 0.68 | 91.60 |
| 5 | Science skills 1 | 77 | 3 | 2.06 | 1.10 | 68.67 |
| 5 | Science skills 2 | 76 | 3 | 3.00 | .00 | 100.00 |
| 5 | Reasoning abilities (hypothesis) | 73 | 3 | 2.24 | .73 | 74.67 |
| 1 | Average score on Worksheet 1 | 15 | 11.58 | 77.20 | ||
| 2 | Average score on Worksheet 2 | 22 | 16.67 | 75.73 | ||
| 3 | Average score on Worksheet 3 | 25 | 21.12 | 84.48 | ||
| 4 | Average score on Worksheet 4 | 23 | 21.11 | 91.78 | ||
| 5 | Average score on Worksheet 5 | 14 | 11.88 | 84.86 | ||
| Average score on science knowledge | 36 | 26.90 | 74.72 | |||
| Average score on science skills | 44 | 41.49 | 93.61 | |||
| Average score on reasoning abilities | 19 | 14.26 | 75.05 | |||
| Average score on hypotheses | 15 | 10.94 | 72.93 | |||
| Average score on conclusions | 4 | 3.32 | 83.00 | |||
| Average score on graphing activities | 6 | 5.33 | 88.83 | |||
| Average score on all items | 99 | 82.35 | 83.18 | |||
| Note. No. = number of responses. | ||||||
Objectives 2 and 3
Although all sets of worksheet scores correlated positively with their corresponding pretest/posttest science comprehension improvement scores, only three correlations were significant (Table 2). The score for all worksheet items had a significant correlation of .32 with overall improvement score. Science knowledge worksheet score had a significant correlation of .28 with its improvement score. Finally, Lesson 5 worksheet score had a significant correlation of .36 with its improvement score. The magnitudes of these significant relationships are in the low range (Ary, Jacobs, & Razavieh, 1996).
| Variable | r | p |
|---|---|---|
| All worksheet items x overall improvement | .3186 | .0025 |
| Science knowledge worksheet x science knowledge improvement | .2807 | .0081 |
| Science skills worksheet x science skills improvement | .1303 | .2262 |
| Reasoning abilities worksheet x reasoning abilities improvement | .0517 | .6326 |
| Lesson 1 worksheet x Lesson 1 improvement | .1756 | .1018 |
| Lesson 2 worksheet x Lesson 1 improvement | .0583 | .5896 |
| Lesson 3 worksheet x Lesson 1 improvement | .1188 | .2705 |
| Lesson 4 worksheet x Lesson 1 improvement | .0495 | .6469 |
| Lesson 5 worksheet x Lesson 1 improvement | .3575 | .0006 |
| Note. N = 88. | ||
Conclusions, Implications, and Recommendations
Students averaged above 70% correct on all but the four worksheet items indicated above, on all five lesson worksheets, and on science knowledge, science comprehension, and reasoning abilities items. Their performance on all worksheet items averaged 83% correct. We concluded that the items receiving an average score of less than 70% correct were worded well but that students needed more explanation and time to complete them. The low average score on the Lesson 3 hypothesis and overall average of only 73% correct on the five hypotheses suggest that the students needed more explanation and time for writing their hypotheses.
That worksheet score was related to overall science comprehension improvement score is the most promising evidence of the value of the worksheets in the curriculum. Unlike the pretest and posttest, which were administered in a clinical environment, we treated the worksheets as lower stakes assessments to motivate, guide, and promote students' learning as they progressed toward the posttest. For the science skills and reasoning abilities parts of the worksheets, we had the students work in teams. These approaches to using the worksheets might have limited variability in worksheet performance and weakened some relationships with improvement scores. However, this is how we would recommend educators use them, with the addition of reviewing graded worksheets with students before moving to another lesson.
We used the pilot test results to make final changes to the worksheets, which we have made available to formal and nonformal educators on a website (https://aces.nmsu.edu/weatherclimate). The worksheets can be used in formal education classrooms, in county educator–led school enrichment programs, in afterschool and summer special interest programs, and with homeschooled youths. We also plan to include them in a 4-H weather and climate science project curriculum to add to our website.
Our results indicate that as a scaffolding strategy, formative worksheets developed following our science comprehension model (Skelton et al., 2012) can play a role in improving youth science comprehension. Additional research is needed with different age groups and agricultural and natural resources content to further establish the value of worksheets for improving science comprehension.
Acknowledgments
The study reported here was supported by funds from the New Mexico Agricultural Experiment Station, National Institute of Food and Agriculture, and The Enchanted Life Foundation.
References
Ary, D., Jacobs, L. C., & Razavieh, A. (1996). Introduction to research in education. San Antonio, TX: Harcourt Brace College Publishers.
Belland, B. R. (2014). Scaffolding: Definition, current debates, and future directions. In J. Spector, M. Merrill, J. Elen, & M. Bishop (Eds.), Handbook of research on educational communications and technology (pp. 505–518). New York, NY: Springer. doi:10.1007/978-1-4614-3185-5_39
Black, P., & Harrison, C. (2004). Science inside the black box: Assessment for learning in the science classroom. London, UK: GL Assessment.
Bourdeau, V. D. (2004). 4-H experiential education: A model for 4-H science as inquiry. Journal of Extension, 42(5), Article 5TOT3. Available at: http://www.joe.org/joe/2004october/tt3.php
Campbell, D. T., & Stanley, J. C. (1963). Experimental and quasi-experimental designs for research. Boston, MA: Houghton Mifflin Company.
Cervetti, G. N., Pearson, P. D., Bravo, M. A., & Barber, J. (2006). Reading and writing in the service of inquiry-based science. In R. Douglas, M. P. Klentschy, K. Worth, & W. Binder (Eds.), Linking science and literacy in the K-8 classroom (pp. 221–244). Arlington, VA: National Science Teachers Association Press.
Donaldson, J. L., Franck, K. L., & Baker, M. A. (2020). Challenge to bolster the evidence base for 4-H science, technology, engineering, and mathematics programming. Journal of Extension, 58(1), Article v58-1comm1. Available at: https://www.joe.org/joe/2020february/comm1.php
Dormody, T. J., Skelton, P., Rodriguez, G., Dubois, D. W., & VanLeeuwen, D. (2019). Assessing the impact of a weather and climate curriculum on science comprehension among 8th grade agriscience students. Manuscript submitted for publication.
Fuller, J. S., & Dawson, K. M. (2017). Student response systems for formative assessment: Literature-based strategies and findings from a middle school implementation. Contemporary Educational Technology, 8(4), 370–389. Retrieved from https://libezp.nmsu.edu:2362/contentdelivery/servlet/ERICServlet?accno=EJ1158166
Johnson, G. (2019, Summer). AG 101: The + & – of climate change. New Horizons, 67(4), 8–9.
Kinsey, S. B., & Haberland, M. W. (2012). Using rain gardens to promote service learning and climate science education with urban youth. Journal of Extension, 50(4), Article v50-4iw4. Available at: https://www.joe.org/joe/2012august/iw4.php
Kolb, D. A. (1984). Experiential learning: Experience as the source of learning and development. Englewood Cliffs, NJ: Prentice-Hall.
Lengnick, L. (2018, March). Cultivating climate resilience on farms and ranches. (Sustainable Agriculture Research and Education, U.S. Department of Agriculture Publication No. 2014-38640-22173).
McLeod, S. (2017). Kolb's learning styles and experiential learning cycle. SimplyPsychology, 1–5. Retrieved from https://www.simplypsychology.org/learning-kolb.html
Mulvahill, E. (2018). 10 ways to scaffold learning. Retrieved from https://www.weareteachers.com/ways-to-scaffold-learning/
National Oceanic and Atmospheric Administration Regional Climate Centers. (n.d.). Retrieved January 10, 2019, from http://scacis.rcc-acis.org/
National Research Council. (2000). Inquiry and the national science education standards; A guide for teaching and learning. Washington DC: National Academies Press.
Pathak, T. B., Bernadt, T., & Umphlett, N. (2014). Climate Masters of Nebraska: An innovative action-based approach for climate change education. Journal of Extension, 52(1), Article v52-1iw1. Available at: https://www.joe.org/joe/2014february/iw1.php
Pedaste, M., Mäeots, M., Siiman, L. A., de Jong, T., Van Riesen, S. A., Kamp, E. T., & Manoli, C. C. (2015). Phases of inquiry-based learning: Definitions and the inquiry cycle. Educational Research Review, 14, 47–61. Retrieved from https://doi.org/10.1016/j.edurev.2015.02.003
Penuel, W. R., Boscardin, C. K., Masyn, K., & Crawford, V. M. (2007). Teaching with student response systems in elementary and secondary education settings: A survey study. Education Technology Research & Development, 55(4), 315–346.
Ruiz-Primo, M. A., & Furtak, E. M. (2007). Exploring teachers' informal formative assessment practices and students' understanding in the context of scientific inquiry. Journal of Research in Science Education, 44(1), 57–84. doi:10.1002/tea.20163
SAS Institute, Inc. (2011). SAS 9.3 software. Retrieved from http://support.sas.com/software/93/
Seeratan, K. L. (2011). Diagnostic learning progressions framework: Developing an embedded formative and summative assessment system to improve learning outcomes for elementary and middle school students with mathematics learning disabilities. In Society for Research on Educational Effectiveness. Retrieved from https://libezp.nmsu.edu:2362/contentdelivery/servlet/ERICServlet?accno=ED528684
Skelton, P., Blackburn, J. J., Stair, K. S., Levy, N., & Dormody, T. J. (2018). Agriscience education through inquiry-based learning: Investigating factors that influence the science competence of middle school students. Journal of Agricultural Education, 59(1), 223–237. https://doi.org/10.5032/jae.2018.01223
Skelton, P., & Dormody, T. (2009). Adding context to content: The Memorial Middle School Agricultural Science Center model. The Agricultural Education Magazine, 81(5), 26–28.
Skelton, P., Dormody, T., & Dappen, P. (2016). The learning tornado: An agriscience comprehension model [Abstract]. NACTA Journal, 60(Suppl. 1), 85.
Skelton, P., Dormody, T., & Lewis, M. (2016). Closing the science comprehension achievement gap through the use of an Extension youth development science comprehension model. Journal of Extension, 54(6), Article v54-6rb6. Available at: https://www.joe.org/joe/2016december/rb6.php
Skelton, P., Seevers, B., Dormody, T., & Hodnett, F. (2012). A conceptual process model for improving youth science comprehension. Journal of Extension, 50(3), Article v50-3iw1. Available at: https://joe.org/joe/2012june/iw1.php
Swinehart, B. (1992). Youth involvement: Developing leaders and strengthening communities. Boulder, CO: Partners for Youth Leadership.
Tanner, K. D. (2013). Structure matters: Twenty-one teaching strategies to promote student engagement and cultivate classroom equity. Life Sciences Education, 12, 322–331. doi:10.1187/cbe.13-06-0115
U.S. Department of Education. (n.d.). Science, technology, engineering, and math, including computer science. Retrieved on February 4, 2020, from https://www.ed.gov/stem
U.S. Global Change Research Program. (2018). Fourth National Climate Assessment. Retrieved from https://nca2018.globalchange.gov/
Wilhelm, P., & Beishuizen, J. (2003). Content effects in self-directed inductive learning. Learning and Instruction, 13(4), 381–402. doi:10.1016/s0959-4752(02)00013-0