April 2020
|
April 2020 // Volume 58 // Number 2 // Feature // v58-2a3


Informing Decision Making in Extension Through Importance-Performance Analysis and the Repositioning Framework
Abstract
In an era of financial constraint following the Great Recession, many Extension entities have been forced to make difficult decisions; some have adopted alternative funding strategies whereas others have accepted reductions in service delivery and staffing levels. In this article we describe how importance-performance analysis and the repositioning framework may be combined to help inform resource-related decision making in Extension. To do so, we provide an example drawn from an evaluation of local recreation services. The approach and recommendations we detail can be valuable resources for Extension professionals faced with difficult decisions regarding limited resources.
Introduction
Traditionally, Extension has relied on tax-based funding from federal, state, and county governments to deliver services to individuals and communities. In the wake of the Great Recession, however, the viability of that system has been called into question (Angima, Etuk, & King, 2014; Serenari, Peterson, Bardon, & Brown, 2013). Although the Great Recession officially stretched from December 2007 to June 2009 (Rich, 2013), the impacts to individuals and communities continue to resonate, and government spending on services such as Extension has been adversely affected well beyond the official end date of the recession period.
In light of this new fiscal reality, some Extension entities have been forced to consider alternative funding strategies such as additional grant funding, community partnerships, and higher user fees; others have accepted reductions in service delivery or the elimination of staff positions (Serenari et al., 2013). Whether practitioners choose to pursue alternative funding sources or continue to rely on tax-based funding, there is increased emphasis on stewardship of existing resources and production of high-quality funding proposals (Angima et al., 2014; Serenari et al., 2013). Ongoing systematic needs assessment, and the use of resources such as the Proposal Enhancement Tool (PET) (Angima et al., 2014), represent potential strategies for addressing these conditions.
In this article, we describe another strategy for informing decision making in Extension, specifically as it relates to the management of existing resources and the pursuit of additional resources. To do so, we provide an example illustrating how importance-performance analysis (IPA) and the repositioning framework may be combined, using data from an evaluation of local recreation services. Although municipal recreation and Extension are distinct entities, for the purposes of this example, they share several key characteristics: Both rely largely on tax-based funding that was negatively affected by the Great Recession (Barrett, Pitas, & Mowen, 2017; Pitas, Barrett, & Mowen, 2017), have seen a rise in interest regarding alternative funding strategies (Serenari et al., 2013; Walls, 2014), and seek to enhance quality of life for the individuals and communities they serve (National Recreation and Park Association, 2019; U.S. Department of Agriculture National Institute of Food and Agriculture, n.d.).
IPA
IPA (Martilla & James, 1977) is a method of evaluating and improving service quality through the use of survey data. IPA has been widely used, including in Extension contexts (e.g., Hugo, & Lacher, 2014; Pitas, Murray, Olsen, & Graefe, 2017; Warner, Kumar Chaudhary, & Lamm, 2016; Warner, Kumar Chaudhary, Lamm, Rumble, & Momol, 2017). Conducting an IPA is generally a three-step process:
- Compile a set of important attributes related to the service in question. This step can be performed by the evaluator alone or in collaboration with key stakeholder groups.
- Have survey respondents rate the perceived importance of each attribute and the perceived level of performance by the service provider in question for each attribute, using Likert-style items for the survey.
- Plot attributes on a two-dimensional matrix, using their mean importance score (y-axis value) and mean performance score (x-axis value). This matrix is divided into quadrants, and attributes are categorized and prioritized according to their placement in the matrix (see Figure 1).
Figure 1.
Importance-Performance Matrix
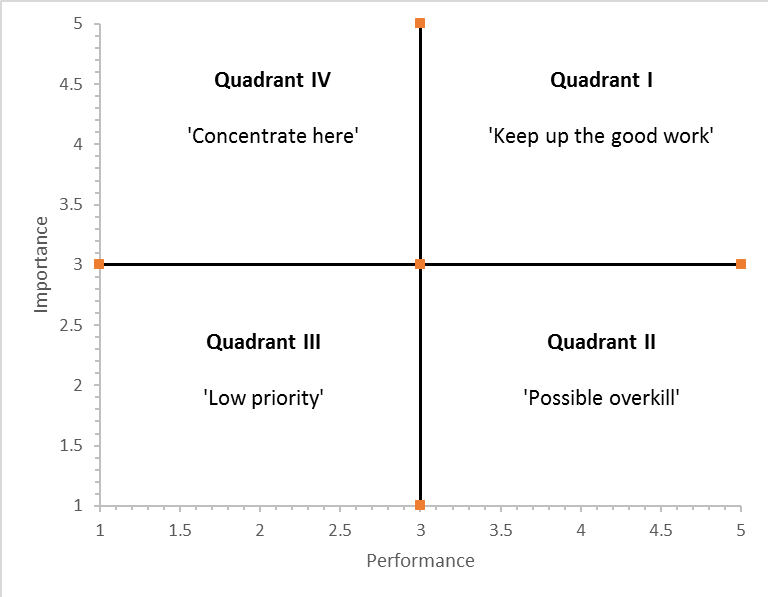
Adapted from "Importance-Performance Analysis," by J. A. Martilla and J. C. James, 1977, Journal of Marketing, 41(1), p. 78.
Attributes that are high in both importance and performance are low urgency for the investment of additional agency resources and are categorized as areas in which to keep up the good work (Quadrant I). Attributes low in importance and high in performance are categorized as those for which possible overkill is occurring, indicating that current levels of investment may be more than necessary (Quadrant II). Attributes low in both importance and performance are seen as low priority overall and low urgency for the investment of agency resources (Quadrant III). Finally, those attributes that are high in importance but low in performance emerge as potential focal points for action and resource allocation (concentrate here, Quadrant IV).
As an additional step, a separate analysis can be conducted for the purpose of understanding the magnitude of the difference between the importance and performance ascribed to an attribute, providing further information by which to prioritize attributes for resource allocation. A more significant gap between the two may indicate in relative terms where resources and effort may make the most difference in terms of service improvement. In this case, we adopted the approach described by Warner et al. (2017), using paired-samples t-tests.
The Repositioning Framework
An organization's position refers to the place it occupies in the minds of key stakeholders relative to other services that compete for the same funding or support (Ries & Trout, 1986). When an organization occupies an unfavorable position, it may apply one or more repositioning strategies, which are purposeful actions designed to shift stakeholder opinions. The repositioning process consists of three distinct steps:
- Identify key stakeholders who have the capacity to influence the organization.
- Identify issues of concern to those key stakeholders.
- Effectively communicate with those stakeholders regarding the contributions of the organization related to the issues of concern.
The final step of effectively communicating organizational contributions may take multiple forms (Crompton, 2009): Real repositioning occurs when organizations make actual changes to their operations and the services they offer to specifically address an issue of concern; psychological repositioning involves attempts to change stakeholder beliefs about what an organization does or the value it contributes; associative repositioning involves aligning and partnering with organizations that already occupy desired positions; and competitive repositioning refers to attempts to change stakeholder beliefs about a competitive organization. In this article we focus on real, psychological, and associative repositioning, as we believe competitive repositioning is beyond the scope and mission of Extension professionals.
The steps of the repositioning process overlap considerably with those of an IPA. At their cores, both involve identifying issues that are important to key stakeholders and determining how to address those important issues in ways that improve stakeholder perceptions. In the sections that follow, we provide an example illustrating how IPA and the repositioning process may be combined and applied by Extension professionals as a method of guiding resource-related decision making.
Application of IPA and Repositioning
Because municipal recreation exists to serve the community and is largely supported by tax-based allocations, members of the public are key stakeholders. The public has the capacity to influence agency operations through their behavior (e.g., patterns of visitation and/or participation) and their support for or opposition to specific legislation (e.g., municipal bonds related to recreational facility construction).
We collected the data used in the example we present here through a convenience sample of residents of the Town of Perinton, New York, during March 2019. A total of 500 online surveys were returned, after promotion through agency social media and the spring program catalog. Because missing value analysis indicated a nonsignificant value for Little's (1988) missing completely at random test (𝒳2 = 10,130.33, df = 9,970, p = .128), we used pairwise deletion to account for missing data (Tsikriktsis, 2005). At the conclusion of that process, we had 408 usable surveys, for a final sample size of 408.
As part of the larger survey evaluating usage of and satisfaction with agency services, respondents completed the Park and Recreation Repositioning Scale (PARRS) (Kaczynski & Crompton, 2004). The PARRS asks respondents to rate the overall importance of 25 community issues (e.g., "improving the quality of groundwater," "helping people build healthy lifestyles") and the perceived contribution of their park and recreation agency to addressing those issues. The 25 individual issues are then combined into indexes representing eight predetermined issue categories (Kaczynski & Crompton, 2004). Importance was measured via a 5-point Likert-style scale ranging from 1 (not at all important) to 5 (extremely important); contribution was measured via a similar Likert-style scale ranging from 1 (very small) to 5 (very large). Cronbach's alphas for the eight indexes were acceptable, ranging from .814 to .945.
We then used paired-samples t-tests (Warner et al., 2017) to measure the magnitude of the gap between attribute importance and perceived agency contribution. We observed significant differences in six of the eight categories. Table 1 contains mean importance and contribution scores for the eight issue categories as well as the results of the gap analysis.
| Issue category | Mean importance (rank) | Mean contribution (rank) | t-value (p-value) |
|---|---|---|---|
| Youth development | 4.4 (1) | 4.0 (2) | 9.0 (<.001) |
| Parks and open space | 4.3 (2) | 3.7 (4) | 9.5 (<.001) |
| Business development | 4.1 (3) | 3.1 (6) | 12.7 (<.001) |
| Environmental stewardship | 4.0 (t4) | 3.0 (t7) | 12.8 (<.001) |
| Senior citizens | 4.0 (t4) | 4.1 (1) | -0.1 (.892) |
| Health | 3.9 (6) | 3.8 (3) | 1.6 (.105) |
| Tourism | 3.8 (7) | 3.3 (5) | 7.3 (<.001) |
| Unemployment | 3.5 (8) | 3.0 (t7) | 7.9 (<.001) |
Using the mean scores for each category presented in Table 1, we then plotted attributes on an importance-performance matrix (see Figure 2). Importance-performance quadrant boundaries may be defined according to scale mean (i.e., dividing lines placed at the midpoint of the scale used, in this case 3.0) or calculated mean (i.e., dividing lines placed at the mean of all the importance or performance items used). We used a calculated mean method, which is generally considered more rigorous than the scale mean method (Bacon, 2003).
Figure 2.
Importance-Performance Matrix for Community Issues and Agency Contribution
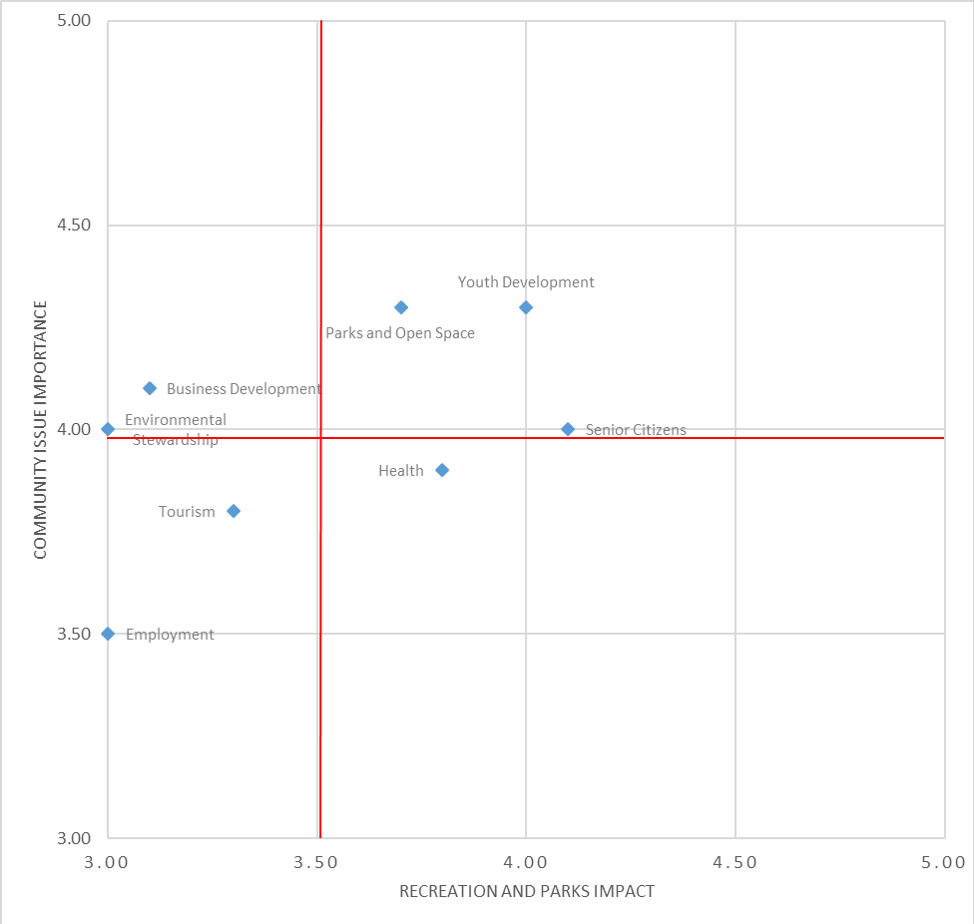
Using the results of our analysis, we categorized the issues according to their relative priority for agency action and resource allocation.
- Keep up the good work: The community issue areas of youth development, senior citizens, and park and open space all fell into the first quadrant of the matrix and thus should be considered as low priority for the allocation of additional resources.
- Possible overkill: Health fell into the second quadrant, indicating that the current level of investment may be more than necessary in this area.
- Low priority: Employment and tourism both fell into the third quadrant, indicating that these areas should be considered low priority overall.
- Concentrate here: Business development and environmental stewardship fell into the fourth quadrant and thus emerged as potential focal points for action and resource allocation. We also observed the most significant gaps between mean importance and agency contribution in business development (t = 12.7, p < .001) and environmental stewardship (t = 12.8, p < .001), indicating that investment in these areas may make the most difference in terms of service improvement (Warner et al., 2017).
In the process we are proposing, the next step involves applying the repositioning framework to the areas identified as priorities via the IPA. Whereas the IPA identifies priorities, repositioning is used to create strategies for addressing those priorities and tailored messaging about those priorities that may be more likely to influence stakeholder perceptions.
Example repositioning strategies focusing on business development and environmental stewardship (the priorities identified via the IPA) may include the following options:
- Real repositioning: Identify an environmentally sensitive area within the community as a recreational asset, and request additional funding to acquire and protect that area.
- Psychological repositioning: Request additional funds for marketing and outreach efforts regarding existing programs that provide environmental education in the community.
- Associative repositioning: Propose a partnership with the local economic development authority to showcase recreational assets to businesses considering locating in the community.
In some instances, it may also be possible to reposition multiple areas simultaneously. For example, given the high importance and perceived contribution related to the areas of youth development and parks and open space, it may be advantageous to address business development or environmental stewardship through these areas. Such combination strategies that capitalize on what is already being done well (i.e., youth development, parks and open space) to address areas of potential focus (i.e., environmental stewardship) may be particularly effective. For example, as a real repositioning strategy, the agency could propose novel youth programming that addresses environmental stewardship through activities that maintain and improve parks.
The application of the repositioning framework depends on decision makers' integrating their experience, expertise, and knowledge of the organization with the results of the IPA. For example, if the organization was already investing significant resources in environmental stewardship, enhancing marketing and outreach may be appropriate. Conversely, if the organization was not investing in environmental stewardship, the results presented above may be used as justification for initial investment in that area. Results of the IPA also may guide decisions to reduce resource allocations for a specific issue category. For example, as health was in the possible overkill category, some resources may be reallocated from the area of health to address issues of greater priority.
It is also possible to combine this approach with other established practices within Extension, such as the aforementioned PET. The PET is designed to help Extension professionals put together compelling funding proposals; a comprehensive needs assessment is used to define problems and present potential solutions in a fashion that is approachable and transparent to funders (Angima et al., 2014). Any needs assessment conducted as part of a PET process could easily include importance-performance items, and the repositioning framework could be used for creating compelling solutions based on the results of an IPA. There is no need to rely on an either-or approach when making decisions regarding scarce financial resources, and Extension professionals should consider using any available and appropriate tool for the task at hand.
Conclusion
In this article we present a process for applying IPA and the repositioning framework as a means of helping Extension practitioners make informed resource-related decisions. Although we used a convenience sample focusing on municipal recreation, we believe that the process we illustrated is more important than the specific results. Extension professionals working in a variety of program areas may find value in the method presented here.
In an era of increased financial constraint following the Great Recession, Extension professionals must be equipped to make informed decisions regarding the management of existing resources and proposals for additional resources. Improving this decision-making process should be of universal significance to Extension professionals as managing and securing adequate and reliable funding may be a defining challenge for Cooperative Extension as a whole moving forward. Although various approaches to this problem exist, we believe that the strategy of combining IPA and repositioning represents a novel approach. As an added benefit, both IPA and repositioning are well-established approaches with a wealth of existing resources available to practitioners. Both are also highly accessible, requiring no special equipment and falling well within the scope of the skill set possessed by most Extension practitioners and evaluators.
Future research should expand on the example provided here and address the limitations of our analysis. Whereas we relied on a convenience sample of community members, using a true random sample to examine the perceived contributions of a specific Extension office regarding a variety of community issues would be a useful context for further developing the combined IPA/repositioning process. Items addressing knowledge/awareness of organizational activities among respondents also should be included in future research as raters' perceptions may be skewed if the raters are uninformed. The development of an instrument similar to the PARRS but specific to various Extension program areas also would be a useful contribution. Such a standardized instrument would allow Extension professionals to conduct highly uniform evaluations, compare data across time and geography, and reduce the burden on/skill requirements of individual professionals. Finally, as suggested elsewhere in the Extension literature (e.g., Warner et al., 2016), specific repositioning messaging strategies should be evaluated in future research, allowing for the creation of tailored messages that may more effectively change stakeholder perceptions regarding the efforts of Extension professionals.
Author Note
Joel Agate is no longer affiliated with the State University of New York, College at Brockport.
References
Angima, S., Etuk, L., & King, D. (2014). Using needs assessment as a tool to strengthen funding proposals. Journal of Extension, 52(6), Article v52-6tt1. Available at: https://joe.org/joe/2014december/tt1.php
Bacon, D. R. (2003). A comparison of approaches to importance-performance analysis. International Journal of Market Research, 45(1), 1–15.
Barrett, A. G., Pitas, N. A., & Mowen, A. J. (2017). First in our hearts but not in our pocket books: Trends in local governmental financing for parks and recreation from 2004 to 2014. Journal of Park and Recreation Administration, 35(3), 1–19.
Crompton, J. L. (2009). Strategies for implementing repositioning of leisure services. Managing Leisure, 14(2), 87–111.
Hugo, N. C., & Lacher, R. G. (2014). Understanding the role of culture and heritage in community festivals: An importance-performance analysis. Journal of Extension, 52(5), Article v52-5rb4. Available at: https://www.joe.org/joe/2014october/rb4.php
Kaczynski, A., & Crompton, J. (2004). Development of a multi-dimensional scale for implementing positioning in public park and recreation agencies. Journal of Park and Recreation Administration, 22(2), 1–27.
Little, R. J. (1988). A test of missing completely at random for multivariate data with missing values. Journal of the American Statistical Association, 83(404), 1198–1202.
Martilla, J. A., & James, J. C. (1977). Importance-performance analysis. Journal of Marketing, 41(1), 77–79.
National Recreation and Park Association. (2019). About NRPA. Retrieved from https://www.nrpa.org/About-National-Recreation-and-Park-Association/
Pitas, N. A., Barrett, A. G., & Mowen, A. J. (2017). Trends in local park and recreation department finances and staffing in the early twenty-first century. Journal of Park and Recreation Administration, 35(3), 20–34.
Pitas, N. A., Murray, A., Olsen, M., & Graefe, A. (2017). A modified importance-performance framework for evaluating recreation-based experiential learning programs. Journal of Extension, 55(1), Article v55-1tt5. Available at: https://www.joe.org/joe/2017february/tt5.php
Rich, R. (2013). The Great Recession. Retrieved from https://www.federalreservehistory.org/essays/great_recession_of_200709
Ries, A., & Trout, J. (1986). Positioning: The battle for your mind (Vol. 1). New York, NY: McGraw-Hill.
Serenari, C., Peterson, M. N., Bardon, R. E., & Brown, R. D. (2013). The impacts of the Great Recession on state natural resource Extension program. Journal of Extension, 41(4), Article 4FEA11. Available at: https://joe.org/joe/2013august/a11.php
Tsikriktsis, N. (2005). A review of techniques for treating missing data in OM survey research. Journal of Operations Management, 24(1), 53–62.
U.S. Department of Agriculture National Institute of Food and Agriculture. (n.d.). Extension. Retrieved from https://nifa.usda.gov/extension
Walls, M. (2014). Private funding of public parks: Assessing the role of philanthropy. Retrieved from the Resources for the Future website: https://www.rff.org/publications/issue-briefs/private-funding-of-public-parks-assessing-the-role-of-philanthropy/
Warner, L. A., Kumar Chaudhary, A., & Lamm, A. J. (2016). Using importance-performance analysis to guide Extension needs assessment. Journal of Extension, 54(6), Article v54-6a1. Available at: https://www.joe.org/joe/2016december/a1.php
Warner, L. A., Kumar Chaudhary, A., Lamm, A. J., Rumble, J. N., & Momol, E. (2017). Using home irrigation users' perceptions to inform water conservation programs. Journal of Agricultural Education, 58(3), 101–119.