October 2019
|
October 2019 // Volume 57 // Number 5 // Research In Brief // v57-5rb7


Analysis Identifies Need to Educate Wine Grape Growers on Crop Insurance Issues
Abstract
A spatial analysis of variation in return on investment for crop insurance showed that West Coast wine grape growers are more inclined to use insurance to maximize short-term net returns than to protect against cash flow shortages. Growers would benefit from knowing that even if crop insurance does not maximize short-term net returns, it increases the revenue floor, thereby helping prevent cash flow shortages and vineyard failure. With crop insurance as the backbone of the U.S. agricultural safety net, an understanding of factors that drive variation in crop insurance participation can improve agricultural Extension agents' ability to offer programming on crop insurance issues. Additionally, agents can use publicly available data to replicate the analysis described in this article for other insured crops.
Few Oregon wine grape growers purchase crop insurance. This circumstance is confounding to many because there is an array of market and production risks for Oregon wine grapes, including variation in input markets, natural disasters, weather, disease, pests, and trade wars (Countryman & Muhammed, 2018). For example, wildfire smoke taint is an emerging issue that is encouraging many West Coast wine grape growers to reconsider the role of crop insurance for their vineyards. Furthermore, the crop insurance price (premium) is highly subsidized by the federal government, and wine grape insurance is widely available through multiple-peril crop insurance plans and the Whole-Farm Revenue Protection program (WFRP). (See the appendix for definitions of premium, multiple-peril crop insurance, Whole-Farm Revenue Protection program, and other terms used throughout this article.) Oregon had 1,144 vineyards and 33,631 ac of wine grapes in 2017 (University of Oregon, 2018), but only 26% of this acreage was insured, compared to 81% in California and 71% in Washington (U.S. Department of Agriculture Risk Management Agency, 2019).
Extension agents are comfortable with many of the basic strategies farmers use for risk management. However, agents feel the least qualified to offer educational programs on futures markets and crop insurance (Buzby, Skees, & Benson, 1992). This does not bode well for growers, given that the federally subsidized crop insurance program has been the backbone of the U.S. agricultural safety net since the 2014 Farm Bill eliminated the direct payments program and developed new crop insurance programs, such as WFRP. One aspect of crop insurance that is poorly understood is how insurance can protect an operation's cash flow: cash income minus cash operating expenses. Cash flow is the most important financial indicator for growers to monitor in the short term because it is the primary component of working capital: all cash available to a grower in a short period of time. To avoid farm failure, growers need sufficient working capital to pay the costs of ongoing farming operations. Crop insurance increases the minimum yield or revenue received (increases the revenue floor), which helps protect an operation's cash flow (Janzen & Carter, 2018). However, discussions with growers indicate that few of them keep detailed records of their expenses or develop cash flow statements. Growers often base the decision to purchase crop insurance on whether "it pays."
Indeed, a review of the literature by Knight and Coble (1997) showed that growers with higher expected returns on insurance are more likely to insure. Other major findings from the literature were that (a) larger farm size increases participation in insurance, (b) on-farm diversification (crop and livestock) reduces participation, and (c) higher yield variability or income risk increases participation, even if the price of insurance accurately reflects higher expected indemnities (Knight & Coble, 1997). Lee and Sumner (2013) evaluated the return on investment (ROI) for buy-up coverage for almonds, wine grapes, rice, and cotton in California for 2002–2011. They found that the ROI was 0.01 for almonds, 0.19 for wine grapes, 1.22 for rice, and 3.33 for cotton. In other words, the returns for cotton insurance were 330% higher than the costs, but the returns for wine grape insurance were only 19% higher than the costs. The authors concluded, "We would expect a high participation rate by almond and grape growers if net benefits from crop insurance participation for these crops were as high as they are for cotton" (Lee & Sumner, 2013, p. 5).
In this article, I report on a spatial analysis of interstate and intrastate variation in the ROI for crop insurance. The analysis provides a deeper understanding about the factors that drive variation in crop insurance participation. The methodology used and findings reported have implications for agricultural Extension agents in assisting growers with understanding crop insurance issues.
Applying Lee and Sumner's ROI Measure to West Coast Wine Grapes
I applied Lee and Sumner's (2013) approach to test whether insurance net returns can help explain spatial variation in wine grape insurance participation in the West Coast region (California, Oregon, and Washington). With this approach, the expected ROI is evaluated as the net returns of insurance (indemnity minus the grower cost of insurance) divided by the grower cost of insurance:
ROI = (Indemnity – Premium + Premium Subsidy) / (Premium – Premium Subsidy). (1)
There are three general outcomes associated with this ROI:
- ROI > 0 is a positive ROI. The net return is positive.
- ROI = 0 is a zero ROI. The net return is zero.
- ROI < 0 is a negative ROI. The net return is negative.
A positive expected ROI for insurance is an incentive to purchase insurance, whereas a negative expected ROI is a disincentive to purchase insurance. ROI = 0 is the break-even case in which the costs and returns of insurance are equal and there is neither an incentive nor a disincentive to purchase insurance. Nonetheless, even if the expected ROI is not positive, crop insurance may be worthwhile in the short term because it helps prevent cash flow shortages and vineyard failure.
I applied the approach to data for 1995–2017 to control for structural and quantitative changes to the federal crop insurance program. The Federal Crop Insurance Reform Act of 1994 introduced CAT (the Catastrophic Risk Protection Endorsement) and significantly increased premium subsidies, both of which would affect the ROI as calculated with Equation 1. Because the premium for CAT is essentially zero, I evaluated the ROI separately for CAT and buy-up coverage. It was important to control for these changes because crop insurance was not purchased in Oregon before the Federal Crop Insurance Reform Act of 1994. Data from 1995 onward represent a period in which growers in all three states purchased insurance under the same structural and quantitative characteristics of the federal crop insurance program. The data I used are the U.S. Department of Agriculture Risk Management Agency's Summary of Business data (U.S. Department of Agriculture Risk Management Agency, 2018). These data include information on the number of policies sold, indemnified acres, liability, premium, subsidy, and indemnity for each year, state, county, insurance plan (actual production history [APH], etc.), and coverage category (CAT or buy-up). I used the Producer Price Index to adjust all dollar values for inflation, using 1982–1984 as the base period. I aggregated the data by county and year, resulting in 713 county–year observations for the 1995–2017 period. I also aggregated the data to evaluate the expected ROI for each state.
The data have two potential sources of bias, adverse selection and moral hazard, both of which arise due to asymmetric information between insurance providers and growers.
- Adverse selection occurs if there is "hidden knowledge" possessed by an insured grower about his or her probability of loss (Arrow, 1984). Due to growers' hidden knowledge about their risks, the most risky growers are more likely to purchase crop insurance.
- Moral hazard occurs if there is "hidden action" by an insured grower. Insured growers can hide their actions from insurance providers and therefore have less incentive to implement costly risk management practices.
All else equal, adverse selection and moral hazard lead to higher indemnity payments, which lead to higher premiums for the federal government and private insurance companies to maintain solvency of the crop insurance program. With an increase in premiums, premium subsidy is also expected to increase (not premium subsidy rates). The net effect on the ROI from increasing indemnity, premium, and premium subsidy is uncertain. For an actuarially fair insurance program, where indemnity and premium are equal and then both increase by the same amount, with the premium subsidy rate unchanged, there is no effect on the ROI. However, other circumstances can lead to an increase or decrease in the ROI. With this county- and state-level analysis, one must bear in mind that within a county or state, specific vineyards may have different circumstances.
Does It Pay to Purchase Wine Grape Insurance?
The ROI for the period 1995–2017 was positive for both CAT and buy-up coverage in all three states (Table 1). The ROIs for CAT in California, Oregon, and Washington are 4,774, 13, and 603, respectively. This indicates that on average the returns on CAT are many times higher than the costs. On the other hand, the ROIs for buy-up coverage in California, Oregon, and Washington are 0.34, 0.15, and 0.12, respectively. This indicates that the returns for buy-up coverage are 12%–34% higher than the costs. One reason why the ROI is substantially higher for CAT than for buy-up is that nearly 100% of the CAT premium was subsidized (Table 1). On the other hand, 55%–57% of the buy-up premium was subsidized. Subsidies increase the value of the numerator in Equation 1 and decrease the value of the denominator, both of which increase the ROI.
| ROI | Premium subsidy rate | |||
|---|---|---|---|---|
| State | CAT | Buy-up | CAT | Buy-up |
| California | 4,773.53 | 0.34 | 100% | 56% |
| Oregon | 12.89 | 0.15 | 100% | 57% |
| Washington | 603.46 | 0.12 | 100% | 55% |
| Note. CAT is the Catastrophic Risk Protection Endorsement (see appendix). | ||||
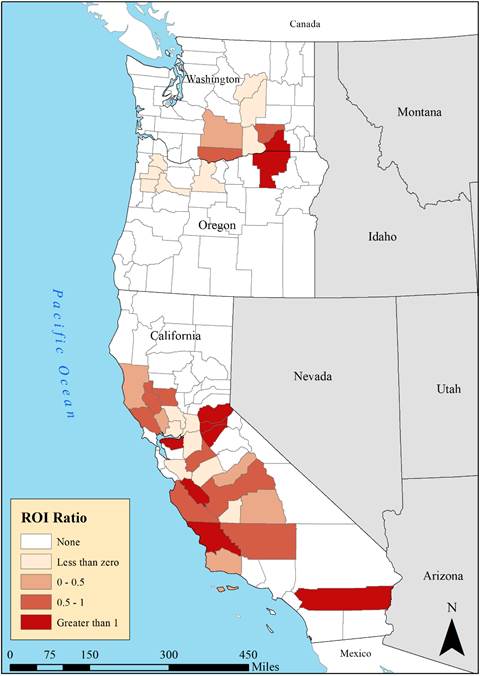
Umatilla County is the only Oregon county where historically "it pays" to purchase buy-up coverage from the grower perspective. With the exception of Umatilla County, which has an ROI greater than 1, all Oregon counties in which growers purchased insurance have a negative ROI in buy-up coverage (Figure 1). On the other hand, four out of seven counties in Washington in which growers purchased insurance have a positive ROI in buy-up coverage. In California, 19 out of 26 counties in which growers purchased insurance have a positive ROI in buy-up coverage.
Figure 1.
Return on Investment (ROI) in Wine Grape Buy-Up Coverage, 1995–2017
To Protect Cash Flow or Maximize Short-Term Net Returns?
This article provides empirical evidence that West Coast wine grape growers are more inclined to use insurance to maximize short-term net returns than to protect against cash flow shortages. If protecting cash flow were growers' main objective, one would expect a similar insurance participation rate in all three states. This finding is consistent with my discussions with growers, which indicate that few of them develop cash flow statements and that they often base the decision to purchase crop insurance on whether "it pays." The analysis provides several implications for Extension programming:
- Crop insurance is a risk management tool designed to protect cash flow; it is not a guaranteed payment program. Growers would benefit from knowing that even if the expected ROI is not positive, crop insurance can be worthwhile because it increases the minimum yield or revenue received (increases the revenue floor), thereby helping prevent cash flow shortages and vineyard failure.
- The ROI evaluated in this analysis was for wine grape yield insurance (APH), and the evaluation could be different for revenue insurance (WFRP). In particular, premiums are generally higher for WFRP than for APH, but additional premium subsidy (the "whole-farm premium subsidy") and higher coverage levels are offered to farms that insure more than one crop under WFRP (Olen & Wu, 2017).
- Grower involvement in federal programs can affect program development. For example, Oregon growers successfully lobbied for red and white wine grapes to be separate commodities under WFRP, allowing vineyards growing both types of grape to receive the whole-farm premium subsidy. Given that the ROI in APH buy-up coverage is negative for most Oregon counties, growers may benefit from lobbying for lower insurance premiums to accurately reflect the expected indemnities.
The approach and findings presented here, as well as the publicly available data I used for the analysis, can improve the ability of agricultural Extension agents to offer educational programs on crop insurance issues. The U.S. Department of Agriculture Risk Management Agency (2018) provides publicly available data that Extension agents can use to replicate the analysis described in this article for any insured crop in the United States down to the county level.
Acknowledgments
This material is based on work partially supported by the Oregon Wine Research Institute, Oregon State University. I greatly appreciate comments on earlier versions of this article from Mark Chien, Kent Fleming, Nick Gans, Larry Lev, James Osborne, JunJie Wu, and participants at the June 2018 Southern Oregon Viticultural Technology Meeting. Maps were produced by Michael Weinerman, Department of Applied Economics, Oregon State University. Any opinions, findings, conclusions, and recommendations expressed in this material are those of the author and do not necessarily reflect the views of the reviewers, Oregon State University, and the Oregon Wine Research Institute.
References
Arrow, K. (1984). The economics of agency. In J. Pratt & R. Zeckhauser (Eds.), Principals and agents: The structure of business (pp. 37–51). Boston, MA: Harvard Business School Press.
Buzby, J. C., Skees, J. R., & Benson, F. J. (1992). Risk management education. Journal of Extension, 30(1), Article 1FEA7. Available at: https://www.joe.org/joe/1992spring/a7.php
Countryman, A. M., & Muhammad, A. (2018). Chinese trade retaliation may diminish U.S. wine export potential. Choices, 33(2), 1–7. Retrieved from http://www.choicesmagazine.org/UserFiles/file/cmsarticle_635.pdf
Janzen S. A., & Carter, M. R. (2018). After the drought: The impact of microinsurance on consumption smoothing and asset protection. American Journal of Agricultural Economics, 101(3), 651–671. https://doi.org/10.1093/ajae/aay061
Knight, T. O., & Coble, K. H. (1997). Survey of US multiple peril crop insurance literature since 1980. Review of Agricultural Economics, 19(1), 128–156. https://doi.org/10.2307/1349683
Lee, H., & Sumner, D. A. (2013). What is the role of crop insurance for 'specialty' crops? OreCal Issues Brief No. 006. Retrieved from http://orecal.org/publications/
Olen, B., & Wu, J. (2017). Tracking the evolution and recent development of whole farm insurance programs. Choices, 32(3), 1–8. Retrieved from http://www.choicesmagazine.org/choices-magazine/submitted-articles/tracking-the-evolution-and-recent-development-in-whole-farm-insurance-programs
University of Oregon. (2018). 2017 Oregon vineyard and winery report. Retrieved from https://industry.oregonwine.org/resources/#filter=combo%3A.winery-vineyard-report
U.S. Department of Agriculture Risk Management Agency. (2018). Summary of business reports and data. Retrieved from https://www.rma.usda.gov/data/sob/scc/index.html
U.S. Department of Agriculture Risk Management Agency. (2019). State profiles. Retrieved from https://legacy.rma.usda.gov/pubs/state-profiles.html
Appendix
Glossary of Crop Insurance Terms
| Term | Definition/explanation |
|---|---|
| Buy-up coverage | Any coverage level higher than the basic CAT coverage (55% to 85% coverage in intervals of 5%). |
| Cash flow | Annual cash income minus cash operating expenses for the production year. |
| CAT coverage | The Catastrophic Risk Protection Endorsement, which pays 55% of the price of the commodity established by the U.S. Department of Agriculture Risk Management Agency on crop losses in excess of 50%. The premium is paid by the federal government; however, growers must pay a $300 administrative fee (as of the 2008 Farm Bill) for each crop insured in each county. Beginning, limited-resource, and socially disadvantaged growers may have this fee waived. CAT coverage is not available on all types of policies. |
| Indemnity | The amount payable by the insurer to the insured in the event of an insured loss. |
| Liability | An insurer's financial debt or obligations to the insured; the value of the insured asset. |
| Loss ratio | Indemnity divided by premium, with a value of 1 representing a program that breaks even and higher values representing less efficient programs. |
| Multiple-peril crop insurance | Insurance plans covering multiple causes of crop loss for a single commodity. |
| Premium | The amount payable by the insured to the insurer for the period of insurance granted by the policy; the price of insurance. |
| Premium subsidy | The amount of the crop insurance price (the premium) that is paid by the federal government on growers' behalf. |
| Return on investment (ROI) for crop insurance | The indemnity minus the grower cost of insurance, all divided by the grower cost of insurance. A positive ROI represents a profitable investment for the grower. |
| Risk | Exposure to uncertainty. |
| Whole-Farm Revenue Protection program | Insurance that covers revenue losses for one or more commodities under a single insurance plan. |