October 2019
|
October 2019 // Volume 57 // Number 5 // Research In Brief // v57-5rb2


Poverty Simulations for Human Services Professionals: Impacts and Implications
Abstract
We examined the program outcomes of a poverty simulation offered by Nebraska Extension. Using qualitative and quantitative data sets collected from 582 participants, we investigated their emotional, attitudinal, and learning outcomes. The overall findings suggest that poverty simulations can enable participants to empathize with people living in poverty, reduce their misconceptions about people living in poverty and about governmental support, and improve their awareness of financial hardship, economic difficulties, government programs, and community resources. We provide recommendations for poverty simulation implementation, such as more rigorous use of orientation, group discussion, and community resources.
Introduction
Poverty simulations in Extension programming and other Extension-led educational endeavors have been found to be effective for raising awareness of and increasing sympathy for families with limited resources (Franck, Barnes, & Harrison, 2016; O'Neill, 2008; Todd, de Guzman, & Zhang, 2011). Moreover, considerable evidence from outside the realm of Extension also supports the idea that poverty simulations have positive impacts on individuals' understanding of poverty and attitudes toward people living in poverty (Menzel, Willson, & Doolen, 2014; Noone, Sideras, Gubrud-Howe, Voss, & Mathews, 2012; Patterson & Hulton, 2012; Reid & Evanson, 2016; Steck, Engler, Ligon, Druen, & Cosgrove, 2011; Vandsburger, Duncan-Daston, Akerson, & Dillon, 2010; Yang, Woomer, Agbemenu, & Williams, 2014). However, much of this evidence is from higher education settings and thus relates to college students who have limited exposure to poverty (Menzel et al., 2014; Reid & Evanson, 2016; Vandsburger et al., 2010). Research focusing on important populations such as human services professionals remains sparse.
Nebraska Extension has offered poverty simulations as a community outreach program for current and prospective human services providers for 15 years. Currently, the simulations are presented by two facilitators who have received Community Action Poverty Simulation (CAPS) training and certification, with five additional educators serving as cofacilitators. CAPS is an experiential and interactive program designed to sensitize community participants to the realities of poverty and promote a greater understanding of poverty (Missouri Community Action Network, n.d.).
Using a mixed-methods approach, we examined the emotional, attitudinal, and learning outcomes of human services professionals who participated in Nebraska Extension poverty simulations. We addressed the following questions: (a) What emotions do participants feel while taking part in a poverty simulation? (b) How do their attitudes change from before to after the simulation? (c) What learning outcomes do they attain?
Method
Using self-administered surveys, available both in paper form and online (via Qualtrics), we gathered qualitative data in 2017 and quantitative data in 2018. In 2017 we pilot tested a survey to explore simulation participants' feelings, attitudes, and learning outcomes, using a survey instrument made up of open-ended questions (see Table 1). On the basis of the pilot evaluation, we developed and implemented a quantitative evaluation in 2018, adapting the 2017 survey questions accordingly (see Table 1). For example, in 2017 we asked participants to describe their feelings. After reviewing their responses and conducting thematic analyses, we converted this open-ended question to a multiple-answer question involving a list of the frequently reported emotions. Instead of the qualitative questions we used for assessing attitudes and learning outcomes in 2017, we included scaled measures to assess attitudes and learning outcomes in 2018. Additionally, we collected participants' demographic information in 2018.
| Data type |
Qualitative evaluation, 2017 (n = 304) |
Quantitative evaluation, 2018 (n = 278) |
|---|---|---|
| Emotional outcomes | Questions: How did you feel about yourself during your experience? Why did you feel that way? | Multiple-answer question with 16 options regarding feelings (e.g., anxious, stressful, overwhelmed) plus an "other" option |
| Attitudinal outcomes | Questions: Did your attitudes change during the month? If so, how? | 10 items adapted from Attitudes Toward Poverty scale (Atherton et al., 1993) |
| Learning outcomes | Question: What insights or conclusions have you come to about the life experience of low-income families? | 5 items assessing understanding and awareness of low-income families and their difficulties |
| Demographics | Not collected | Gender, age, race/ethnicity, education, income, occupation |
Participants
A total of 582 participants completed program evaluations for the years 2017 and 2018 (304 participants in 2017, 278 participants in 2018). Due to unavailability of data for 2017 participants, Table 2 shows the characteristics of only those who completed the program in 2018. Over two thirds of the participants were female, and most were in their 20s or 30s. They were predominantly non-Hispanic Whites. The majority were earning or had earned college degrees, and most were young professionals. Over half of the participants were teachers or worked in educational settings. It should be noted that the participants in 2017 might have had different characteristics; however, the program has consistently targeted current or prospective human services professionals (e.g., teachers, childcare providers, health care providers, college students, and community volunteers).
| Variable | No. | % |
|---|---|---|
| Gender | ||
| Male | 88 | 32.4 |
| Female | 184 | 67.6 |
| Age | ||
| 19 or younger | 62 | 22.6 |
| 20–24 | 69 | 25.2 |
| 25–29 | 28 | 10.2 |
| 30–39 | 48 | 17.5 |
| 40–49 | 33 | 12.0 |
| 50 or older | 34 | 12.4 |
| Race/ethnicity | ||
| White | 252 | 89.0 |
| African American | 3 | 1.1 |
| Hispanic or Latino | 19 | 6.8 |
| Asian | 4 | 1.4 |
| Other | 5 | 1.8 |
| Educational attainment | ||
| Less than high school | 8 | 2.9 |
| High school degree | 25 | 9.1 |
| Some college | 85 | 31.0 |
| Associate's degree | 20 | 7.3 |
| Bachelor's degree | 50 | 18.3 |
| Graduate degree | 86 | 31.4 |
| Occupational field | ||
| Education | 153 | 52.9 |
| Health and nutrition | 33 | 11.4 |
| Community services | 8 | 2.8 |
| Government | 3 | 1.0 |
| Nonprofit organization | 19 | 6.6 |
| Business | 4 | 1.4 |
| Student | 55 | 19.3 |
| Other (e.g., journalism) | 14 | 4.9 |
Measures
Emotional Outcomes
Participants' emotional outcomes were measured with the question "What feelings did you experience during the program?" In the 2017 survey, this was an open-ended question. As previously noted, by conducting thematic analyses, we categorized the 2017 participants' feelings into 16 options to create a multiple-answer question for the 2018 survey. We also included an "other" text box.
Attitudinal Outcomes
In the 2017 survey, we asked participants to report whether and how their attitudes had changed from before to after the simulation. In the 2018 evaluation, instead of a qualitative question, we used theoretically and empirically validated scaled measures adapted from the Attitudes Toward Poverty scale (Atherton et al., 1993). We implemented a retrospective pretest/posttest design to compare participants' attitudes before and after the program.
The following statements were used to assess attitudes about people living in poverty: "people living in poverty have lower self-esteem and confidence than others"; "they watch much more TV than others"; "they spend too much money on fast foods"; "they need to learn to budget better"; and "I am not responsible for improving the lives of people living in poverty." Using a 4-point Likert scale of 1 (very untrue) to 4 (very true), we asked participants to indicate to what extent each statement was true. Higher scores indicated a more biased view of people living in poverty. Cronbach's alphas were .65 each for before and after the program, indicating acceptable internal consistency.
Misconceptions about governmental support were measured with the following statements: "low-income families have sufficient support from the government"; "welfare programs are good enough for them"; "they get sufficient help with rent, heating, and electricity"; "they don't have to work because of government support"; and "if working harder, they can get out of poverty." Using the same 4-point Likert scale of 1 (very untrue) to 4 (very true), we asked participants to indicate to what extent each statement was true. Higher scores indicated a less accurate view of governmental support. Cronbach's alphas were .81 each for before and after the program, indicating good or excellent internal consistency.
Learning Outcomes
In the 2017 survey, we asked participants to elaborate on insights or conclusions they reached about the life experience of low-income families. From the associated findings, we defined learning outcomes related to five aspects of the challenges and difficulties experienced by people living in poverty. Accordingly, in the 2018 survey, we asked participants to indicate the extent to which they came to understand the following aspects of living in poverty: "the financial challenges low-income families face," "the difficulties they face in improving their own situations," "the challenges they face in meeting their basic needs," "the difficulties they have accessing community or government resources," and "the frustrations and emotional stress poverty can bring." The response options ranged from 1 (learned a lot) to 4 (never learned). This scale produced a high internal reliability coefficient of .89.
Results
Emotional Outcomes
In the 2017 qualitative survey, multiple participants expressed that during the role-playing scenario they had felt stressed, particularly when they were unemployed because they "struggle[d] with [their] knowledge versus what [they could] do." Those who played a child role in simulations reported that they felt helpless, confused, and sad because "[they were] too young [to take necessary actions]" and "some things happened that were out of [their] control."
Participants experienced negative emotions in the simulations because they had
- inadequate and inaccessible resources such as "no transportation, house, time, food, and job";
- incapability of supporting family, indicating that they were unable to "help [their] parents," "contribute to [their] family," or "obtain necessities";
- excessive burdens and responsibilities, reporting that they had to "[be] responsible for everything," "[handle] too many things," and "[visit many] different agencies"; and
- unexpected life events including a teen pregnancy "at [the age of] 19."
Additionally, some participants expressed positive feelings when they survived or solved problems during the role-playing activity, indicating that it was a "relief when things went well" or when "[they] made it to work, paid rent, handled business, [and] kept everything together." Those who had experienced poverty in their real life affirmed that "people actually go through" the scenarios presented.
Several participants reported that they felt confused not in the roles they were playing but about the simulation itself due to unclear expectations about the rules, procedures, and timelines of the simulation. They mentioned that the initial simulation orientation was not clear enough, with one individual suggesting that it was "difficult to understand the concept at the beginning [because] instructions were not very clear [before participants opened their simulation] packets."
Quantitative findings from the 2018 survey summarized the overall emotions participants experienced (Table 3). During the poverty simulations, majorities of the participants reported that they felt overwhelmed, stressed, anxious, frustrated, and confused. Additionally, considerable numbers of participants felt worried, impatient, and helpless.
| Feeling | f | % |
|---|---|---|
| 1. Overwhelmed | 172 | 61.4 |
| 2. Stressful | 162 | 57.9 |
| 3. Anxious | 160 | 57.1 |
| 4. Frustrated | 155 | 55.4 |
| 5. Confused | 147 | 52.5 |
| 6. Worried | 137 | 48.9 |
| 7. Impatient | 127 | 45.4 |
| 8. Helpless | 105 | 37.5 |
| 9. Struggled | 102 | 36.4 |
| 10. Empathetic | 97 | 34.6 |
| 11. Angry | 84 | 30.0 |
| 12. Desperate | 76 | 27.1 |
| 13. Panic | 71 | 25.4 |
| 14. Sad | 68 | 24.3 |
| 15. Hopeless | 61 | 21.8 |
| 16. Tired | 54 | 19.3 |
Attitudinal Outcomes
In the 2017 qualitative survey, a large number of participants mentioned that the program was effective in providing "the exposure and understanding of what [living in poverty] is like" by offering participants the experience of "taking on roles and going to places" based on "real-life issues." They reported that through the "hands-on roles" in the simulation, they "got to see more families and individuals in poverty."
Participants stated that the poverty simulation offered "a glimpse of what people actually go through in life," "opened [their] eyes to the life of people in poverty," and "helped [them] understand why people can't get out of poverty." The majority of participants noted that the simulation provided an experiential learning opportunity because they were able to "act things out," "put [themselves] in others' places," "learn to step in other families' shoes," and "go through what [low-income families] go through." Realistic situations helped them "feel [the] real experience" of poverty. These results support the idea that poverty simulations enable participants to revisit common misconceptions and build empathy. A better understanding of scarce resources, limited job opportunities, family instability, and lack of social support made the simulation participants we studied rethink and change their attitudes about poverty.
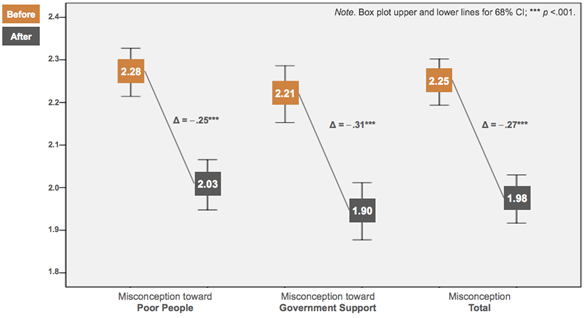
The 2018 quantitative findings suggested that participants' levels of bias and misconceptions associated with people living in poverty were significantly decreased after the poverty simulation (see Figure 1). As stated previously, scaled response options ranged from 1 to 4, with higher scores reflecting more biased, less accurate views. The mean scores for participants' attitudes toward people living in poverty before and after the simulation were 2.28 (SD = .47) and 2.03 (SD = .49), respectively (T = −9.43, p < .001). The mean scores for participants' conceptions of governmental support before and after the simulation were 2.21 (SD =.57) and 1.90 (SD =.58), respectively (T = −9.58, p < .001). Overall, the poverty simulation was effective in reducing implicit biases and prejudices regarding people living in poverty and governmental support for them. The means for total scores before and after the simulation were 2.25 (SD =.46) and 1.98 (SD =.48), respectively (T = −10.39, p < .001).
Figure 1.
Changes in Participants' Misconceptions from Before to After Poverty Simulation, 2018 (n = 275)
Learning Outcomes
The qualitative data gathered in 2017 suggested that participants benefited from interacting with community agencies during the simulation. In particular, participants reported that they learned about public services and programs (e.g., public assistance, transportation, food, housing, education, correctional services) in terms of eligibilities, provisions, and benefits. Some participants requested more details about community and governmental resources. They reported that they wanted to learn more about community agencies and resources that would practically help families living in poverty. One participant asked, "When the agencies say no, where can someone go to get help?" Several participants indicated that they wanted to be trained better about "how best to work with families and students in poverty" and best practices for "serving [such] families."
The 2018 quantitative data also showed positive learning outcomes (see Table 4). Approximately 90% of the participants learned "some" or "a lot" about the challenges and difficulties low-income families and individuals face related to dealing with financial hardship (92.9%), improving one's financial situation (92.8%), meeting basic needs (91.7%), accessing community and governmental resources (89.1%), and coping with frustration and emotional toll (91.3%). A modest number of participants reported that they never or barely learned from simulations in general. Additionally, almost 11% of participants found that they did not learn much about the challenges and difficulties that poor families face with regard to accessing and using community resources and government support.
| Level of learning | ||||
|---|---|---|---|---|
| Topic |
Learned a lot % |
Learned some % |
Learned little % |
Never learned % |
| 1. Dealing with financial hardship | 47.8 | 45.7 | 6.1 | 0.4 |
| 2. Improving financial situations | 46.0 | 46.8 | 6.8 | 0.4 |
| 3. Meeting basic needs | 53.4 | 38.3 | 7.9 | 0.4 |
| 4. Accessing community or government resources | 45.1 | 44.0 | 10.1 | 0.7 |
| 5. Coping with frustration and emotional toll | 53.8 | 37.5 | 8.3 | 0.4 |
Discussion
Using qualitative and quantitative data sets with 582 participants, we examined emotional, attitudinal, and learning outcomes of a poverty simulation program. The findings suggest that poverty simulations enable participants to empathize with people living in poverty, reduce their misconceptions about people living in poverty and governmental support for those people, and improve their awareness of financial hardship, economic difficulties, community resources, and government programs. Despite these findings, limitations should be noted, such as the unavailability of demographic data, the possibility of inaccurate or biased recalls in retrospective responses, and the use of perceived outcomes only. Overall, we identified the following implications for improving such simulations:
- Project orientation matters. Thorough explanations and clear guidance about simulation rules and procedures at the beginning of the simulation are important.
- Information should be disseminated. Providing participants with fact sheets, handouts, and a list of resources/programs would be beneficial. A partnership with government agencies and community-based organizations would help participants get connected with the community and navigate support systems.
- Group discussion is an important way of learning. Wrap-up discussion can be another opportunity for participants to learn from one another while facilitators help them process their thoughts.
- Time and space management are important. Time and place restrictions are barriers to interactions. The program should be managed properly through procedures and organization regarding space and group size.
Conclusion
We conducted a mixed-methods evaluation to examine the program outcomes of a poverty simulation, understand participant learning, and obtain participants' feedback. Our findings lend additional support relative to the positive impact of poverty simulations and underscore key recommendations for further development of such programs. The information presented herein can be a reference for future simulation programs administered by Extension educators.
References
Atherton, C. R., Gemmel, R. J., Haagenstad, S., Holt, D. J., Jensen, L. A., O'Hara, D. F., & Rehner, T. A. (1993). Measuring attitudes toward poverty: A new scale. Social Work Research and Abstracts, 29(4), 28–30.
Franck, K. L., Barnes, S., & Harrison, J. (2016). Poverty simulations: Building relationships among Extension, schools, and the community. Journal of Extension, 54(1), Article 1TOT10. Available at: https://joe.org/joe/2016february/tt10.php
Menzel, N., Willson, L. H., & Doolen, J. (2014). Effectiveness of a poverty simulation in Second Life®: Changing nursing student attitudes toward poor people. International Journal of Nursing Education Scholarship, 11(1), 39–45. doi:10.1515/ijnes-2013-007
Missouri Community Action Network. (n.d.). Community Action Poverty Simulation. Retrieved from http://www.communityaction.org/povertysimulations/
Noone, J., Sideras, S., Gubrud-Howe, P., Voss, H., & Mathews, L. R. (2012). Influence of a poverty simulation on nursing student attitudes toward poverty. Journal of Nursing Education, 51(11), 617–622. doi:10.3928/01484834-20120914-01
O'Neill, B. (2008). Financial simulations for young adults: Making the "real world" real. Journal of Extension, 46(6), Article 6TOT4. Available at: https://www.joe.org/joe/2008december/tt4.php
Patterson, N., & Hulton, L. J. (2012). Enhancing nursing students' understanding of poverty through simulation. Public Health Nursing, 29(2), 143–151. doi:10.1111/j.1525-1446.2011.00999.x
Reid, C. A., & Evanson, T. A. (2016). Using simulation to teach about poverty in nursing education: A review of available tools. Journal of Professional Nursing, 32(2), 130–140. doi:10.1016/j.profnurs.2015.10.002
Steck, L. W., Engler, J. N., Ligon, M., Druen, P. B., & Cosgrove, E. (2011). Doing poverty: Learning outcomes among students participating in the Community Action Poverty Simulation program. Teaching Sociology, 39(3), 259–273. doi:10.1177/0092055X11407347
Todd, M. E., de Guzman, M. R., & Zhang, X. (2011). Using poverty simulation for college students: A mixed methods evaluation. Journal of Youth Development, 6(2), 72–77. doi:10.5195/jyd.2011.189
Vandsburger, E., Duncan-Daston, R., Akerson, E., & Dillon, T. (2010). The effects of poverty simulation, an experiential learning modality, on students' understanding of life in poverty. Journal of Teaching in Social Work, 30(3), 300–316. doi:10.1080/08841233.2010.497129
Yang, K., Woomer, G. R., Agbemenu, K., & Williams, L. (2014). Relate better and judge less: Poverty simulation promoting culturally competent care in community health nursing. Nurse Education in Practice, 14(6), 680–685. doi:10.1016/j.nepr.2014.09.001.