June 2019
|
June 2019 // Volume 57 // Number 3 // Research In Brief // v57-3rb2


Assessing New England Family Forest Owners' Invasive Insect Awareness
Abstract
Family forest owners in the United States have underscored the need for forest insect pest (FIP) information, and numerous Extension programs have been developed to meet pest information needs. We developed the Pest Awareness Index to illustrate the heterogeneity of familiarity, knowledge, and experience regarding three FIPs (hemlock woolly adelgid, emerald ash borer, Asian long-horned beetle) in four New England states. Using mail survey data of family forest owners, we calculated an index from three components and provided comparisons based on region and actual insect presence. The differences in the index across these domains have implications for measurement and delivery of Extension programs.
Introduction
Approximately 36% of the forestland in the United States is privately held by an estimated 11 million families, individuals, trusts, estates, and family partnerships, collectively referred to as family forest owners (FFOs) (Butler et al., 2016). Given new and emerging forest health issues, FFO awareness related to these issues is critical to the future condition and persistence of FFO lands.
Negative impacts of invasive forest insect pests (FIPs) have been documented globally (Aukema et al., 2011; Liebhold, MacDonald, Bergdahl, & Mastro, 1995; Peltzer, Allen, Lovett, Whitehead, & Wardle, 2010). Damage from FIPs occurs in forests in many parts of the United States, costing billions of dollars annually (Aukema et al., 2011). The northeastern United States leads the country in the number of invasive FIPs (Liebhold et al., 2013), which include hemlock woolly adelgid (HWA) (Adelges tsugae), emerald ash borer (EAB) (Agrilus planipennis), and Asian long-horned beetle (ALB) (Anoplophora glabripennis). Damage includes major ecological and economic impacts (Lovett et al., 2016). Insects selectively alter forest structure and composition (Dodds & Orwig, 2011; Orwig, Foster, & Mausel, 2002; Orwig et al., 2012); affect carbon, water, and nutrient cycles (Hicke et al., 2012; Kim et al., 2017; Lovett, Canham, Arthur, Weathers, & Fitzhugh, 2006); and undermine the provisioning of ecosystem services (Boyd, Freer-Smith, Gilligan, & Godfray, 2013; Peltzer et al., 2010).
FIPs are identified as one of the most highly rated topics with regard to educational needs and management interests of FFOs (Magill, McGill, & Fraser, 2004; McGill, Campbell, & Pierskalla, 2007; Strong, Oester, & Shaw, 2012; Zobrist & Rozance, 2015). The importance of FIP identification, education on FIPs, and management of FIPs has been recognized within the Extension community (Sundermeier, 2005). Numerous examples exist of programs and workshops focused on training and education on topics related to FIPs and forest health (Anderson, 2006; Nagle, Usborne, Stone, McCullough, & Sadof, 2014; O'Callaghan & Skelly, 2013; Strong et al., 2012).
We contribute to this growing body of literature by presenting an FFO Pest Awareness Index (PAI) for the most threatening insects in the Connecticut River Valley watershed (i.e., HWA, EAB, and ALB) (Table 1) and investigating regional variation in this index. The study reported here is part of a larger, multidisciplinary effort examining interactions between FFOs and FIPs in the watershed as a coupled natural and human system. To develop the PAI, we quantified FFOs' familiarity, knowledge, and experience related to the three aforementioned FIPs. The premise for the tool came from the Conservation Awareness Index, which involves use of a questionnaire for assessing FFOs' awareness of forest conservation options (Van Fleet, Kittredge, Butler, & Catanzaro, 2012).
| Invasive species | Detection and impact |
| Hemlock woolly adelgid (HWA) (Adelges tsugae) |
HWA was detected in the eastern United States in the early 1950s and has been a major concern for over 20 years as its range has expanded across eastern forests and it has killed over 90% of the hemlocks (Tsuga spp.) it has encountered (Orwig et al., 2013; Orwig et al., 2012). As of 2014, HWA had been detected in 19 states from Maine to Georgia, including Connecticut, Massachusetts, New Hampshire, and Vermont (U.S. Department of Agriculture [USDA] Forest Service, 2016). |
| Emerald ash borer (EAB) (Agrilus planipennis) | EAB was first discovered in North America in 2002 and has subsequently killed millions of ash trees (Fraxinus spp.) (Herms & McCullough, 2014). By the end of 2014, EAB was found in 24 states, including Connecticut, Massachusetts, and New Hampshire (USDA Forest Service, 2016). In February 2018, EAB detection spread to Vermont (University of Vermont Extension, Vermont Department of Forests, Parks, and Recreation, Vermont Department of Environmental Conservation, & Vermont Nature Conservancy, 2018). |
| Asian long-horned beetle (ALB) (Anoplophora glabripennis) | ALB, discovered in New York in 1996, was later found in four other states, including Massachusetts in 2008. Although ALB has been declared eradicated in Boston (Meng, Hoover, & Keena, 2015), removal efforts remain in a 110 mi² quarantine area surrounding Worcester, MA. ALB attacks hardwood species, preferring a variety of maples (Acer spp.), with 22 hardwood tree genera (families) serving as larval hosts (Meng et al., 2015). |
| Note. Connecticut, Massachusetts, New Hampshire, and Vermont are the states addressed in the investigation of regional variation in the Pest Awareness Index reported herein. | |
Data and Methods
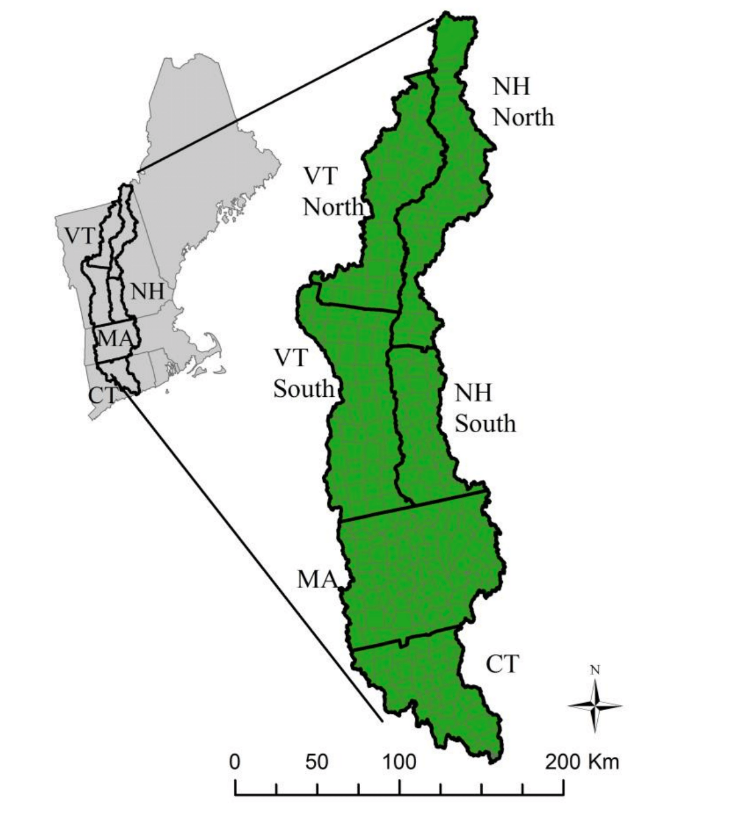
Our study area encompassed Connecticut, Massachusetts, New Hampshire, and Vermont towns that fall within the Connecticut River Valley watershed (Figure 1). We gathered landowner information from a random sample of FFOs owning 10 or more acres of land. We stratified across six regions and by size of parcels, 10−49 ac and ≥50 ac, to ensure sufficient representation of larger parcels across the region.
Figure 1.
Mail Survey Study Area
The survey included questions for ascertaining landowners' familiarity, knowledge, and experience related to three focal FIPs (Appendix A). In 2017, we administered 2,000 mail surveys, following methods advanced by Dillman, Smyth, and Christian (2014), to approximately 333 FFOs per region (roughly 167 per strata). After accounting for ineligible surveys (e.g., those sent to deceased persons, persons not owning land), we obtained a 37% cooperation rate, or 688 usable surveys. Lack of knowledge may be one factor contributing to the lower response rate. We detected no nonresponse bias based on telephone follow-up calls or based on early/late respondent comparisons.
We modeled the PAI questions and scoring methodology after the Conservation Awareness Index (Van Fleet et al., 2012). We transformed responses to each question for each species into a numerical value. Higher scores reflect higher levels of self-reported familiarity, correct answers to knowledge-based questions, and insect exposure or management experience (Appendix B).
We used these transformed responses to calculate component and summary PAI scores. First, we calculated 12 scores for each respondent—one for each PAI component and species. Second, we calculated component PAI scores for the sample: We averaged sample responses for each component/species combination. Third, we calculated summary PAI scores by species: We summed component responses for each respondent by species and then averaged scores by species.
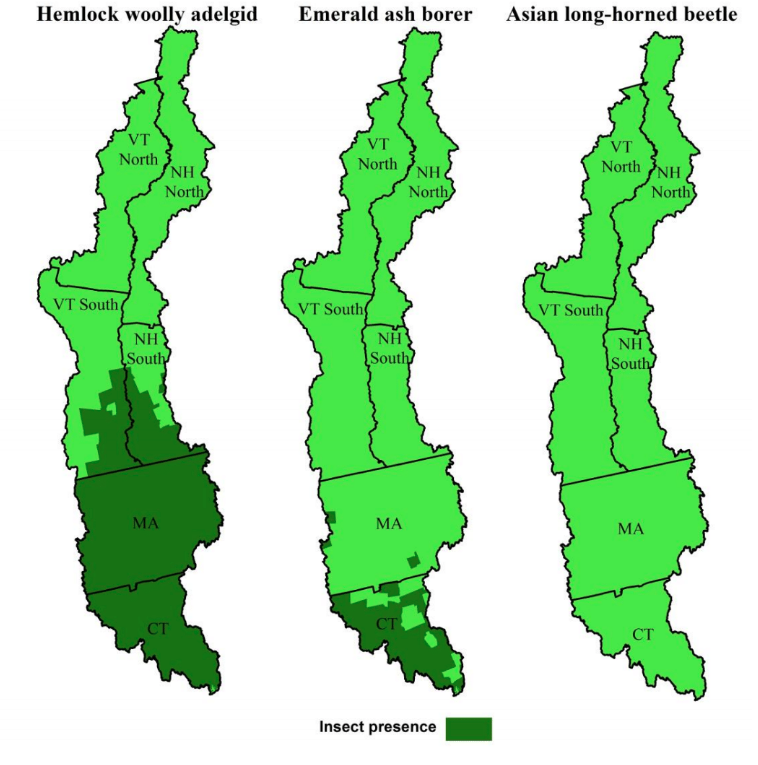
To understand whether PAI scores varied geographically, we partitioned data by region and calculated regional mean PAI scores for each species. To understand whether PAI scores differed when respondents resided in towns where insects had been detected, we identified in-zone and out-of-zone towns based on the presence of each forest pest (Figure 2). We then calculated PAI scores for each of the region/zone combinations by species, region, and zone. We tested for differences in PAI scores across species with Wilcoxon signed-rank tests and differences in PAI scores for infested versus noninfested towns with Wilcoxon rank-sum tests.
Figure 2.
Forest Insect Pest Presence in Study Area as of 2017 Survey Administration
Results
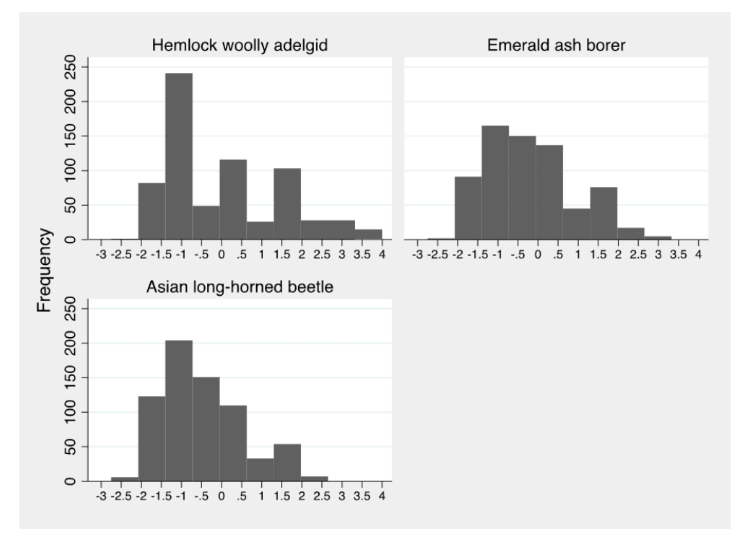
The component PAI scores captured variation in FIP awareness across the study area (Table 2). Respondents were most aware of EAB. Although HWA had been in the area the longest, 26% of respondents had not heard of HWA, compared with 9% and 8% who had not heard of EAB and ALB, respectively (Appendix C). However, respondents' pest knowledge was greatest for HWA. The experience score for each of the species resulted in negative PAI scores, largely driven by respondents' lack of knowledge of the presence of the FIP in their towns and lack of forest management experience with the FIP (Appendix C). The highest summary PAI scores were associated with HWA and EAB (not statistically different) and the lowest with ALB (Figure 3).
| Index component | Hemlock woolly adelgid (HWA) M (SD) |
Emerald ash borer (EAB) M (SD) |
Asian long-horned beetle (ALB) M (SD) |
Wilcoxon signed-rank test result |
| Familiarity (range: 0 to 1) |
0.34 (0.3) | 0.44 (0.2) | 0.40 (0.2) | All paired comparisons different (p ≤ .01%) |
| Knowledge (range: -1 to 1) |
0.37 (0.5) | 0.21 (0.5) | 0.05 (0.6) | All paired comparisons different (p ≤ .01%) |
| Experience: Exposure (range: -1 to 1) |
-0.53 (0.7) | -0.69 (0.5) | -0.71 (0.5) | HWA/EAB different (p ≤ .01%) HWA/ALB different (p ≤ .01%) EAB/ALB not different |
| Experience: Management (range: -1 to 1) |
-0.12 (0.4) | -0.11 (0.4) | -0.16 (0.4) | HWA/EAB not different HWA/ALB different (p ≤ 1%) EAB/ALB different (p ≤ .01%) |
| Summary (range: -3 to 4) |
0.05 (1.4) | -0.15 (1.1) | -0.41 (1.0) | HWA/EAB not different HWA/ALB different (p ≤ .01%) EAB/ALB different (p ≤ .01%) |
| Note. N = 688. | ||||
Figure 3.
Frequency Distribution of Summary Pest Awareness Index Scores by Species
The PAI score results differed by region (Figure 4). Component scores for the entire study area showed consistently positive scores for familiarity and knowledge and negative scores for exposure and management experience.
Figure 4.
Pest Awareness Index (PAI) Scores by Region
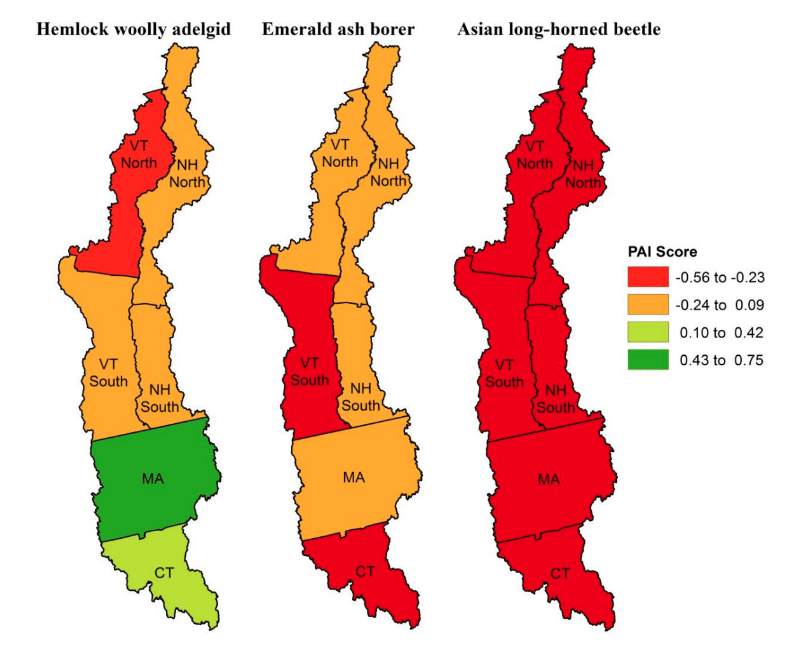
The overall summary PAI scores indicated differences by region (Table 3). The positive PAI score for HWA was driven largely by high PAI scores for Connecticut and Massachusetts, whereas Vermont-North contributed the greatest negative score. The negative PAI score for EAB was supported by all regions (except Vermont-North), with lowest scores in Connecticut and Vermont-South. The large negative PAI score for ALB was driven by all six areas, with the largest contributing negative scores from Connecticut and Vermont. (Appendix D provides more detail.)
| Species | CT (n = 107) M (SD) |
MA (n = 111) M (SD) |
NH-North (n = 128) M (SD) |
NH-South (n = 121) M (SD) |
VT-North (n = 96) M (SD) |
VT-South (n = 125) M (SD) |
| Hemlock woolly adelgid | 0.27(m) (1.8) | 0.75(all) (1.7) | -0.17(m) (1.2) | 0.01(m,vn) (1.2) | -0.36(m) (1.0) | -0.14(m) (1.3) |
| Emerald ash borer | -0.29(ns,vn) (1.1) | −0.24(vn) (1.0) | -0.05 (1.1) | -0.04(c,vs) (1.1) | 0.04(c,m) (1.0) | -0.31(ns,vn) (1.1) |
| Asian long-horned beetle | -0.55(m) (0.9) | −0.25(c) (1.0) | -0.38 (1.0) | -0.39 (1.0) | -0.47 (0.8) | -0.45 (1.1) |
| Note. Wilcoxon rank-sum test result significant differences: (all) = significant different from all, at least 5% level (c) = significant different from Connecticut, at least 5% level (m) = significant different from Massachusetts, at least 5% level (ns) = significant different from New Hampshire-South, at least 5% level (vn) = significant different from Vermont-North, at least 5% level (vs) = significant different from Vermont-South, at least 5% level |
||||||
The statistical tests comparing PAI scores for in-zone/out-of-zone areas showed consistently significant differences for HWA but not EAB (Table 4). HWA-infested areas had higher overall summary and component scores than non-HWA-infested areas. Non-EAB-infested areas had statistically significant higher management experience scores than EAB-infested areas.
| Species | Index component | In-zone score M (SD) |
Out-of-zone score M (SD) |
Wilcoxon rank-sum test result |
| Hemlock woolly adelgid (In-zone n = 308, out-of-zone n = 380) |
Familiarity | 0.38 (0.3) | 0.30 (0.2) | < 0.01% |
| Knowledge | 0.45 (0.5) | 0.30 (0.5) | < 0.01% | |
| Exposure | -0.35 (0.8) | -0.68 (0.5) | < 0.01% | |
| Management | -0.08 (0.5) | -0.14 (0.5) | < 10% | |
| Summary | 0.40 (1.6) | -0.23 (1.1) | < 0.01% | |
| Emerald ash borer (In-zone n = 75, out-of-zone n = 613) |
Familiarity | 0.42 (0.2) | 0.44 (0.2) | |
| Knowledge | 0.15 (0.4) | 0.22 (0.5) | ||
| Exposure | -0.63 (0.6) | -0.70 (0.5) | ||
| Management | -0.21 (0.5) | -0.10 (0.4) | < 5% | |
| Summary | -0.27 (1.2) | -0.13 (1.1) | ||
| Note. No comparison could be made with Asian long-horned beetle because it is not present in the study area. | ||||
Discussion
FIPs present major problems for forests across the northeastern United States, the United States as a whole, and the rest of the world. Across the northeastern United States and in many other regions, FFOs affected by these pests can contribute greatly to mitigating their spread and impact. Increased knowledge leading to increased concern and action will help FFOs (and others) mitigate the problems posed by these pests (Gorman, 2016). The use of a tool such as the PAI with FFOs and other forest owners will help Extension specialists, and others, understand the current state of FIP knowledge, identify specific areas that are weakest, and design programs to address shortcomings.
Overall, PAI scores were low across the study area—in other words, FFOs had relatively low familiarity, knowledge, and experience with the three species. However, the percentages of FFOs in our study indicating familiarity with the FIPs exceeded that of the general public (Poudyal, Bowker, & Moore, 2016) and of private forest owners more than a decade ago (Connelly, Brown, & Smallidge, 2007). In our study, over 26% of respondents were unaware of HWA, 9% were unaware of EAB, and 8% were unaware of ALB. The eastern United States survey conducted by Poudyal et al. (2016) showed that 62% of the public were unaware of HWA. The New York survey conducted by Connelly et al. (2007) showed that 58%–63% were unaware of HWA, 61%–74% were unaware of EAB, and 33%–46% were unaware of ALB (ranges reflect regional differences). Lower familiarity levels may be due to unaffected respondents and lower prevalence of the pests at an earlier time, respectively.
Our results indicated that FIP familiarity ranged across the scale for respondents but tended toward the lower end of familiarity for each of the species. The highest familiarity score (0.44) was for EAB, likely due to the recent introduction of this species and the accompanying high levels of press coverage and outreach. HWA had the lowest average familiarity score (0.34) and was low even in Connecticut where it has long been established. Was HWA familiarity in Connecticut higher when the insect first established itself and when there was more media coverage? Researchers could use the PAI to address this question in the future with remeasurement. For example, remeasuring the PAI for EAB could indicate whether EAB familiarity decreases with passing of time and lessened media coverage.
Although the lowest familiarity score was for HWA, the highest, but still relatively low, knowledge score (0.37) was for HWA, and the knowledge score for ALB (0.05) was the lowest. Knowledge scores were driven down largely by respondents' honestly stating their lack of knowledge in response to the question rather than answering incorrectly. As familiarity is raised through outreach and other efforts, we anticipate that insect knowledge also will increase. That being said, the knowledge scores need to be examined cautiously as they are based on one knowledge question for each insect. Future efforts should include a small battery of three or four knowledge questions per species. This shortcoming was a result of limited space in the questionnaire for our project.
The exposure scores were low primarily due to respondents' not knowing whether they had had the insects on their land and secondarily due to their either being out of the infestation zones or not having the requisite host species. Not knowing what is actually present is especially an issue with hard-to-detect species. Although exposure is an important part of overall awareness, it is not a perfect indicator of what is on the land, and it will change as insects move and detection increases. As most owners reported not knowing whether they had the insects, it is logical that the management scores also were low.
The low levels of exposure and management experience suggest that outreach efforts should focus on general knowledge and detection and not specific management or mitigation actions. But the outreach should be structured so that owners gain not only knowledge needed to identify an insect but also knowledge regarding whom to call if the pest is detected; in other words, efforts should establish trusted sources and build social capital (Gorman, 2016). Providing linkages to the small number of owners who have direct experience with the pest may be particularly useful in assisting other FFOs in gaining knowledge through peer-to-peer learning (Allred, Goff, Wetzel, & Luo, 2011). The Extension community has an important role to fill in helping ensure that accurate information is being distributed and helping support and nurture networks of owners.
Conclusion
Because FIPs are threats to many forested landscapes, it is important that forest owners have the knowledge and tools to increase their familiarity with FIPs and to address the challenges FIP infestations present. The PAI is a tool that can be used in many ways to inform and monitor Extension efforts aimed at educating FFOs, and indeed many other forest owners (e.g., industrial and public land managers), about FIPs. Investigating specific factors that influence PAI scores can inform outreach. For example, low PAI knowledge and exposure experience scores may point to the need to redouble efforts to help owners gain specific insect and infestation knowledge. Future assessments involving use of the PAI could include more questions on species identification to help measure success of particular outreach designed to improve species detection skills. The PAI could be used to retest awareness in an area over time (or via cross-section) to measure the effectiveness and reach of Extension efforts, peer-to-peer learning, social media campaigns, and other efforts. Additional analyses exploring how PAI scores vary across regions according to respondent and land characteristics may help Extension agents target specific audiences. The PAI also may be adapted to different places and FIPs by changing specific content while retaining the basic structure of the questions and scoring.
Acknowledgments
This material is based on work supported by the National Science Foundation under Grant No. DEB-1617075. We graciously thank Danelle Laflower for her assistance in creating the maps presented in the article figures. The research we have reported on is partially supported by the Harvard Forest Long Term Ecological Research Program.
References
Allred, S. B., Goff, G. R., Wetzel, L. P., & Luo, M. K. (2011). Evaluating peer impacts of a master forest owner volunteer program. Journal of Extension, 49(5), Article 5RIB3. Available at: https://joe.org/joe/2011october/rb3.php
Anderson, R. C. (2006). Forestry mini college: A cost-effective way to educate non-industrial private forest landowners. Journal of Extension, 44(3), Article 3IAW4. Available at: https://www.joe.org/joe/2006june/iw4.php
Aukema, J. E., Leung, B., Kovacs, K., Chivers, C., Britton, K. O., Englin, J., . . . Holle, B. V. (2011). Economic impacts of non-native forest insects in the continental United States. PLOS ONE, 6(9), e24587. https://doi.org/10.1371/journal.pone.0024587
Boyd, I. L., Freer-Smith, P. H., Gilligan, C. A., & Godfray, H. C. J. (2013). The consequence of tree pests and diseases for ecosystem services. Science, 342(6160), 1235773–1235773. https://doi.org/10.1126/science.1235773
Butler, B. J., Hewes, J. H., Dickinson, B. J., Andrejczyk, K., Butler, S. M., & Markowski-Lindsay, M. (2016). Family forest ownerships of the United States, 2013: Findings from the USDA Forest Service's National Woodland Owner Survey. Journal of Forestry, 114(6), 638–647. https://doi.org/http://dx.doi.org/10.5849/jof.15-099
Connelly, N. A., Brown, T. L., & Smallidge, P. J. (2007). Public awareness of invasive plants and insects in the Catskills and Lower Hudson region (Human Dimensions Research Unit Publications Series No. HDRU Series No. 07-7). Cornell, NY: Cornell University Department of Natural Resources Human Dimensions Research Unit.
Dillman, D. A., Smyth, J. D., & Christian, L. M. (2014). Internet, phone, mail, and mixed-mode surveys: The tailored design method (4th ed.). Hoboken, NJ: Wiley & Sons.
Dodds, K. J., & Orwig, D. A. (2011). An invasive urban forest pest invades natural environments—Asian longhorned beetle in northeastern US hardwood forests. Canadian Journal of Forest Research, 1742(June), 1729–1742. https://doi.org/10.1139/X11-097
Gorman, J. E. (2016, August). Anticipating aliens: Applying social science to understand stakeholder perceptions of emerald ash borer (Unpublished master's thesis). University of Maine, Orono, ME.
Herms, D. A., & McCullough, D. G. (2014). Emerald ash borer invasion of North America: History, biology, ecology, impacts, and management. Annual Review of Entomology, 59(1), 13–30. https://doi.org/10.1146/annurev-ento-011613-162051
Hicke, J. A., Allen, C. D., Desai, A. R., Dietze, M. C., Hall, R. J., Hogg, E. H., . . . Vogelmann, J. (2012). Effects of biotic disturbances on forest carbon cycling in the United States and Canada. Global Change Biology, 18(1), 7–34. https://doi.org/10.1111/j.1365-2486.2011.02543.x
Kim, J., Hwang, T., Schaaf, C. L., Orwig, D. A., Boose, E., & Munger, J. W. (2017). Increased water yield due to the hemlock woolly adelgid infestation in New England. Geophysical Research Letters, 44, 2327–2335. https://doi.org/10.1002/2016GL072327
Liebhold, A. M., McCullough, D. G., Blackburn, L. M., Frankel, S. J., Von Holle, B., & Aukema, J. E. (2013). A highly aggregated geographical distribution of forest pest invasions in the USA. Diversity and Distributions, 19(9), 1208–1216. https://doi.org/10.1111/ddi.12112
Liebhold, A. M., MacDonald, W. M., Bergdahl, D., & Mastro, V. C. (1995). Invasion by exotic forest pests: A threat to forest ecosystems. Forest Science Monograph, 30, 49.
Lovett, G. M., Canham, C. D., Arthur, M. A., Weathers, K. C., & Fitzhugh, R. D. (2006). Forest ecosystem responses to exotic pests and pathogens in eastern North America. BioScience, 56(5), 395–405. https://doi.org/10.1641/0006-3568(2006)056[0395:FERTEP]2.0.CO;2
Lovett, G. M., Weiss, M., Liebhold, A. M., Holmes, T. P., Leung, B., Lambert, K. F., . . . Weldy, T. (2016). Nonnative forest insects and pathogens in the United States: Impacts and policy options. Ecological Applications, 26(5), 1437–1455. https://doi.org/10.1890/15-1176
Magill, D. J., McGill, D. W., & Fraser, R. F. (2004). Refining outreach to woodland owners in West Virginia—Preferred topics and assistance methods. Journal of Extension, 42(2), Article 4RIB5. Available at: https://www.joe.org/joe/2004august/rb5.php
McGill, D. W., Campbell, L. G., & Pierskalla, C. (2007). The role of the West Virginia Extension Service in forestry education and technical assistance. Journal of Extension, 45(6), Article 6RIB6. Available at: https://www.joe.org/joe/2007december/rb6.php
Meng, P. S., Hoover, K., & Keena, M. A. (2015). Asian longhorned beetle (Coleoptera: Cerambycidae), an introduced pest of maple and other hardwood trees in North America and Europe. Journal of Integrated Pest Management, 6(1). https://doi.org/10.1093/jipm/pmv003
Nagle, A. M., Usborne, R., Stone, A., McCullough, D., & Sadof, C. S. (2014). Power hours—Invasive species communication through collaborative webinars. Journal of Extension, 52(2), Article 2IAW1. Available at: https://www.joe.org/joe/2014april/iw1.php
O'Callaghan, A. M., & Skelly, J. (2013). Community involvement to reduce insect threats to urban forests. Journal of Extension, 51(6), Article 6TOT8. Available at: https://joe.org/joe/2013december/tt8.php
Orwig, D. A., Barker Plotkin, A. A., Davidson, E. A., Lux, H., Savage, K. E., & Ellison, A. M. (2013). Foundation species loss affects vegetation structure more than ecosystem function in a northeastern USA forest. PeerJ, 1, e41. https://doi.org/10.7717/peerj.41
Orwig, D. A., Foster, D. R., & Mausel, D. L. (2002). Landscape patterns of hemlock decline in New England due to the introduced hemlock woolly adelgid. Journal of Biogeography, 29, 1475–1487.
Orwig, D. A., Thompson, J. R., Povak, N., Manner, M., Niebyl, D., & Foster, D. R. (2012). A foundation tree at the precipice: Tsuga canadensis health after the arrival of Adelges tsugae in central New England. Ecosphere, 3(1), 1–16.
Peltzer, D. A., Allen, R. B., Lovett, G. M., Whitehead, D., & Wardle, D. A. (2010). Effects of biological invasions on forest carbon sequestration. Global Change Biology, 16(2), 732–746. https://doi.org/10.1111/j.1365-2486.2009.02038.x
Poudyal, N. C., Bowker, J. M., & Moore, R. L. (2016). Understanding public knowledge and attitudes toward controlling hemlock woolly adelgid on public forests. Journal of Forestry, 114(6), 619–628. https://doi.org/10.5849/jof.15-015
Strong, N. A., Oester, P. T., & Shaw, D. (2012). Pest scene investigators: A peer-learning effort to improve forest health in Oregon. Journal of Extension, 50(2), Article 2IAW2. Available at: https://www.joe.org/joe/2012april/pdf/JOE_v50_2iw2.pdf
Sundermeier, A. (2005). Exotic pest invasion—Plan of action for Extension educators. Journal of Extension, 43(5), Article 5TOT5. Available at: https://www.joe.org/joe/2005october/tt5.php
University of Vermont Extension, Vermont Department of Forests, Parks, and Recreation, Vermont Department of Environmental Conservation, & Vermont Nature Conservancy. (2018, February 27). Emerald ash borer found in Vermont. Retrieved from https://vtinvasives.org/eab
U.S. Department of Agriculture Forest Service. (2016). Major forest and insect disease conditions in the United States: 2014 update (No. FS-1078). Washington, DC: Author.
Van Fleet, T. E., Kittredge, D. B., Butler, B. J., & Catanzaro, P. F. (2012). Reimagining family forest conservation: Estimating landowner awareness and their preparedness to act with the Conservation Awareness Index. Journal of Forestry, 110(4), 207–215.
Zobrist, K. W., & Rozance, M. A. (2015). Forest landowner education interests and delivery preferences: A retrospective look at survey results and actual participation. Journal of Extension, 53(5), Article 5FEA6. Available at: https://www.joe.org/joe/2015october/a6.php
Appendix A
Pest Awareness Index Survey Questions
| Familiarity | How much would you say you know about the following woodland insect species? | |||||
| Hemlock woolly adelgid | Never heard of |
Very little |
Some | Quite a bit | A great deal |
|
| Asian long-horned beetle | Never heard of |
Very little |
Some | Quite a bit | A great deal | |
| Emerald ash borer | Never heard of |
Very little |
Some | Quite a bit | A great deal | |
| Knowledge | Please indicate whether the following statements are true or false by checking True or False. If you do not know, check Don't know. | |||||
| Hemlock woolly adelgid can be identified by the presence of a white substance. | True | False | Don't know | |||
| Asian long-horned beetles feed on many types of trees. | True | False | Don't know | |||
| Adult emerald ash borers cannot fly. | True | False | Don't know | |||
| Experience | Do you currently have or have you ever had hemlock woolly adelgid on your woodland? | Yes | No | Don't know | ||
| Have you or someone you've hired ever cut or removed trees on your woodland because of hemlock woolly adelgid? | Yes | No | Don't know | |||
| Do you currently have or have you ever had emerald ash borer on your woodland? | Yes | No | Don't know | |||
| Have you or someone you've hired ever cut or removed trees on your woodland because of emerald ash borer? | Yes | No | Don't know | |||
| Do you currently have or have you ever had Asian long-horned beetle on your woodland? | Yes | No | Don't know | |||
| Have you or someone you've hired ever cut or removed trees on your woodland because of Asian long-horned beetle? | Yes | No | Don't know | |||
Appendix B
Pest Awareness Index Scoring
We drew our PAI scoring methodology from a similar index developed to estimate FFOs' awareness of conservation options (Van Fleet et al., 2012). We transformed each of the four component questions so that greater scores reflect greater pest awareness. Higher scores reflect higher levels of familiarity, correct answers to knowledge-based questions, and forest insect exposure or management experience. The exception to that rule involved scoring "Yes" responses to exposure experience when the insect was not and had not ever been recorded as being present in a particular town; in those cases, we transformed those scores to be −1.
We strived for consistency with scoring each of the four component questions, keeping scores between −1 and 1. The scoring rubric is presented in Tables B1, B2, and B3 and described in the narrative text following the table.
| Never heard of | Very little | Some | Quite a lot | A great deal |
| 0 | 0.25 | 0.5 | 0.75 | 1 |
| Correct answer | Incorrect answer | Do not know |
| 1 | −1 | 0 |
| Yes | No | Do not know | |
| In-zone scoring | 1 | 0 | −1 |
| Out-of-zone scoring | −1 | 0 | −1 |
Familiarity
The survey presented one question for each insect that asked the respondent to gauge his or her familiarity using a 5-point Likert scale. We assigned scores associated with these responses ranging from 0 (Never heard of) to 1 (A great deal). We assigned gradations of familiarity with equally spaced fractional values 0.25 (Very little), 0.5 (Some), 0.75 (Quite a lot).
Knowledge
The survey contained one knowledge question per species, asking the respondents to state whether the question was true or false or to state whether they did not know the answer. If the respondent provided the correct response to the question, we assigned a value of 1 to that component; if the response was incorrect, we assigned a value of −1; if the respondent reported he or she did not know the answer, we assigned the component a value of 0.
Experience
The survey contained two experience questions per species, one regarding exposure and one management. We elicited responses to gauge whether respondents currently had or ever had had the forest insect pest on their land and to gauge whether respondents had ever cut or removed trees because of the forest pest.
Exposure
Whereas the scoring for management experience was straightforward (as described below), the scoring for exposure experience depended on whether the forest insect pest was actually detected in the sample town. As described in "Methods," for each species, we identified in-zone and out-of-zone towns based on the presence of the forest insect pest (see Figure 2). At the time of the survey mailing, HWA was detected in all sampled towns in Connecticut and Massachusetts, 17 of the sampled towns in New Hampshire, and 15 of the sampled towns in Vermont. EAB occurred in 11 of the sampled towns in Connecticut, three of the sampled towns in Massachusetts, and none of the sampled towns in New Hampshire or Vermont. ALB was not detected in any of the sampled towns.
For towns containing the FIP, if a respondent indicated that he or she currently had or previously had had the FIP, we assigned the value 1 for that component. If the response was negative, we assigned the value 0. If the respondent did not know about current or past infestation by the FIP, we assigned the value −1.
For towns not infested by the FIP, if a respondent indicated that he or she currently had or previously had had the FIP, we assigned the value −1 for that component. If the response was negative, we assigned the value 0. If the respondent did not know about current or past infestation by the FIP, we assigned the value −1.
Management
Whereas exposure experience scoring depended on the actual presence or absence of the FIP in the town, management experience scoring did not. FFOs were asked whether they had cut or removed trees in response to the FIP. Because survey pretesting indicated that FFOs may preemptively cut or remove trees in response to FIPs found in other, nearby locations, the scoring did not depend on species presence. If a respondent indicated that he or she had cut or removed trees because of the FIP, we assigned a value of 1. If a respondent indicated that he or she had not cut or removed trees because of the FIP, we assigned the value 0. If a respondent did not know whether he or she had cut in response to the FIP, we assigned the value −1.
Appendix C
Sample Frequencies of Pest Awareness Index Questions
The familiarity index was lowest for HWA (Table C1), with 26% of respondents reporting they had never heard of the FIP. Compared with other species, respondents were more familiar with EAB than the other two FIPs.
| Pest | Never heard of | Very little | Some | Quite a lot | A great deal |
| Hemlock woolly adelgid | 26.3% | 29.5% | 30.2% | 11.2% | 2.8% |
| Emerald ash borer | 9.3% | 27.9% | 44.0% | 15.4% | 3.3% |
| Asian long-horned beetle | 8.4% | 37.8% | 40.4% | 11.5% | 1.9% |
In contrast to familiarity, respondents were more likely to answer the HWA knowledge question correctly (38%). However, across-species knowledge was low (Table C2), with the majority of respondents answering incorrectly or stating that they did not know the answer (62%−80%).
| Pest | Correct answer | Incorrect answer | Did not know |
| Hemlock woolly adelgid | 37.6% | 0.7% | 61.6% |
| Emerald ash borer | 24.1% | 3.2% | 72.7% |
| Asian long-horned beetle | 19.6% | 14.4% | 66.0% |
Although the number of respondents reporting exposure to one of the FIPs was low (Table C3), more respondents reported that they currently had or had had HWA on their woodland (11%), as would be expected based on historical species distribution. In terms of management (Table C3), response patterns were similar across species, with very few respondents having conducted any forest management at all because of the forest pests (<5%). Of those who had, more had removed trees because of EAB (4%) than HWA (3%) or ALB (<1%).
| Pest | Exposure experience | Management experience | ||||
| Yes | No | Do not know | Yes | No | Do not know | |
| Hemlock woolly adelgid | 11.3% | 26.5% | 62.2% | 3.3% | 81.7% | 15.0% |
| Emerald ash borer | 5.1% | 29.4% | 65.6% | 4.2% | 80.7% | 15.1% |
| Asian long-horned beetle | 1.2% | 28.8% | 70.1% | 0.6% | 83.3% | 16.1% |
Appendix D
Component and Summary Pest Awareness Index Scores by Region and Species
| Study region | Index component | Hemlock woolly adelgid M (SD) |
Emerald ash borer M (SD) |
Asian long-horned beetle M (SD) |
| Connecticut (n = 107) |
Familiarity | 0.36 (0.3) | 0.40 (0.3) | 0.34 (0.2) |
| Knowledge | 0.44 (0.5) | 0.18 (0.4) | 0.07 (0.5) | |
| Exposure | -0.36 (0.8) | -0.67 (0.6) | -0.75 (0.4) | |
| Management | -0.16 (0.5) | -0.20 (0.5) | -0.21 (0.4) | |
| Summary scores | 0.27 (1.8) | -0.29 (1.1) | -0.55 (0.9) | |
| Massachusetts (n = 111) |
Familiarity | 0.44 (0.3) | 0.43 (0.2) | 0.49 (0.2) |
| Knowledge | 0.50 (0.5) | 0.18 (0.5) | 0.01 (0.7) | |
| Exposure | -0.18 (0.9) | -0.79 (0.4) | -0.67 (0.5) | |
| Management | -0.02 (0.4) | -0.05 (0.4) | -0.08 (0.3) | |
| Summary scores | 0.75 (1.7) | -0.24 (1.0) | -0.25 (1.0) | |
| New Hampshire-North (n = 128) |
Familiarity | 0.31 (0.3) | 0.44 (0.2) | 0.38 (0.2) |
| Knowledge | 0.31 (0.5) | 0.28 (0.5) | 0.09 (0.6) | |
| Exposure | -0.63 (0.5) | -0.64 (0.5) | -0.69 (0.5) | |
| Management | -0.16 (0.4) | -0.13 (0.4) | -0.16 (0.4) | |
| Summary scores | -0.17 (1.2) | -0.05 (1.1) | -0.38 (1.0) | |
| New Hampshire-South (n = 121) |
Familiarity | 0.33 (0.3) | 0.49 (0.2) | 0.41 (0.2) |
| Knowledge | 0.35 (0.5) | 0.19 (0.5) | 0.07 (0.6) | |
| Exposure | -0.62 (0.6) | -0.67 (0.5) | -0.73 (0.4) | |
| Management | -0.07 (0.4) | -0.04 (0.4) | -0.14 (0.4) | |
| Summary scores | 0.01 (1.2) | -0.04 (1.1) | -0.39 (1.0) | |
| Vermont-North (n = 96) |
Familiarity | 0.26 (0.2) | 0.48 (0.2) | 0.42 (0.2) |
| Knowledge | 0.22 (0.4) | 0.20 (0.5) | -0.09 (0.6) | |
| Exposure | -0.73 (0.4) | -0.60 (0.5) | -0.69 (0.5) | |
| Management | -0.09 (0.3) | -0.03 (0.4) | -0.11 (0.3) | |
| Summary scores | -0.36 (1.0) | 0.04 (1.0) | -0.47 (0.8) | |
| Vermont-South (n = 125) |
Familiarity | 0.32 (0.3) | 0.41 (0.2) | 0.38 (0.2) |
| Knowledge | 0.39 (0.5) | 0.22 (0.5) | 0.14 (0.5) | |
| Exposure | -0.66 (0.6) | -0.74 (0.4) | -0.75 (0.4) | |
| Management | -0.18 (0.4) | -0.18 (0.4) | -0.22 (0.4) | |
| Summary scores | -0.14 (1.3) | -0.31 (1.1) | -0.45 (1.1) |