June 2019
|
June 2019 // Volume 57 // Number 3 // Feature // v57-3a2


A Multiple Indicators, Multiple Causes Analysis of Farmers' Information Use
Abstract
A multiple indicators, multiple causes, or MIMIC, modeling framework can be used for analyzing a variety of farmer decision-making situations where multiple outcomes are possible. Example applications include analyses of farmer use of multiple information sources, management practices, or technologies. We applied the framework to analyze use of multiple information sources by beef cattle farmers. We provide measures of how farmer demographics, farm characteristics, and risk attitudes influenced farmer use of information from Extension, producer groups, popular press, the U.S. Department of Agriculture, the Internet, and other farmers. Education and greater willingness to take risk positively influenced information use among the farmers we studied. Our process has implications for broader use within Extension.
Introduction and Objectives
Farmers use a variety of information sources when making their business decisions. Measuring the factors that influence farmers' likelihood of using different types of information sources can be cumbersome. However, a better understanding of the types of information sources farmers use in business decision making can assist Extension professionals in designing the delivery of Extension programming. Prior research has shown that information sources farmers use to make decisions may be dependent on farmer demographics and farm characteristics (Crawford, Grossman, Warren, & Cubbage, 2015; Edge et al., 2017; Jensen, English, & Menard, 2009; Ngathou, Bukenya, & Chembezi, 2006; Rejesus et al., 2008). Information about farmer demographics, farm characteristics, and risk-taking attitudes is helpful in developing profiles of farmers who are more or less likely to use information sources to make business decisions. In the study described here, we applied two methods to evaluate farmers' use of information sources. First, we used a process called multiple indicators, multiple causes (MIMIC) modeling to help simplify analysis of how farmer demographics, farm characteristics, and risk-taking attitudes may influence farmers' use of various information sources (Extension, producer groups, popular press articles, U.S. Department of Agriculture [USDA], the Internet, and other farmers). We used the MIMIC model to measure farmer adoption rates in relation to the information sources. Second, we applied a logit model based on the numbers of information sources farmers used to measure the effects farmer demographics, farm characteristics, and risk-taking attitudes have on how often farmers use multiple information sources. We used data from a survey of beef cattle farmers to measure their adoption of information sources. However, this modeling framework is applicable to a variety of farmer decision making situations where multiple outcomes are possible (e.g., use of Extension programming, production technologies, recommended management practices).
Previous Studies
Use of Information Sources
Previous research has addressed farmers' use of information sources in making business decisions regarding farm practices. Researchers found that for cotton farmers (Edge et al., 2017) and beef cattle farmers (Jensen et al., 2009), younger age, higher education level, and greater income level positively influenced the use of information sources. Jensen et al. (2009) noted that other factors positively influencing the use of information sources were rural location and farm diversification. Moreover, Edge et al. (2017) found that greater ownership of land positively influenced use of Extension, specifically. In a study of North Carolina organic growers' perceptions of information sources, Crawford et al. (2015) found that certain types of information sources were viewed as more or less valuable depending on a grower's level of experience and size of the grower's operation. For example, growers with more than 10 years of experience and those with larger operations found conference-based information more useful than growers with less experience or smaller operations did (Crawford et al., 2015). In another study, Marra, Jensen, Clark, English, and Menard (2012) found that farmers who were familiar with switchgrass obtained information about switchgrass from multiple sources, with the most commonly used being farmer or commodity magazines, followed by other mass media. Additionally, over a third relied on Extension as an information source (Marra et al., 2012).
Other research has addressed farmers' use of information sources in making business decisions regarding risk management. Ngathou et al. (2006) examined farmers' attitudes about the helpfulness of risk management information sources. Farmer characteristics positively related to the perceived usefulness of information sources included farm ownership, farmer age, and possession of a marketing plan (Ngathou et al., 2006). Rejesus et al. (2008) explored farmer preferences for various sources of information regarding risk management. They found that farmers tended to prefer information from risk management experts, the Internet, and marketing clubs/other producers if they were younger, were college educated, had higher leverage, had greater assets, had risk-loving attitudes, or used professional services (marketing consultants) (Rejesus et al., 2008). Producers who preferred to self-study educational materials and popular press information sources also were younger, but had lower leverage levels and used fewer professional services (Rejesus et al., 2008). Furthermore, Rejesus et al. (2008) found that older producers did not prefer any of the risk management education sources identified and thus hypothesized that risk management and outreach programs should be targeted to younger producers.
MIMIC Model Agricultural Applications
The MIMIC model has been used to model agricultural sector performance (Richards & Patterson, 2005), dairy industry performance (Richards & Jeffrey, 2000), fruit and vegetable consumption (Richards & Patterson, 2005), technical change in agriculture (Esposti & Pierpaolo, 2000), and the reputation of Washington apples (Quagrainie, McCluskey, & Loureiro, 2001). Further, Kalaitzandonakes and Monson (1994) used a MIMIC model to analyze propensity to adopt conservation efforts among Missouri Conservation Reserve Program participants. Oliver (2015) estimated the propensity of beef cattle farmers to adopt a prescribed grazing program and pasture management practices. And Lambert, Paudel, and Larson (2015) employed a MIMIC model to explain the adoption of precision agricultural technology bundles among cotton farmers.
Methods
Data
We obtained our data through an online survey of 5,500 beef cattle farmers who participated in the 2016 Tennessee Agricultural Enhancement Program (TAEP). State summary highlights from the 2012 Census of Agriculture showed Tennessee as having 33,556 cattle operations with beef cows; hence, 16.4% of the total were contacted (U.S. Department of Agriculture [USDA] National Agricultural Statistics Service [NASS], 2012). We pretested the survey instrument with 275 farmers in June and July 2016. On the basis of these pretests, we made revisions before full distribution of the instrument in August 2016. We sent a reminder email 1 week after the initial email and a second reminder email 2–3 weeks later. We completed data collection by mid-September. The pretest participants were not included in the full survey participant data. A copy of the survey instrument is available upon request.
In the survey, farmers were asked where they obtained information regarding their business decisions. The relevant survey item was "I obtain information used in making my beef cattle business decisions from the following sources (check all that apply): (1) Extension Services (ex: meetings, conferences, and publications), (2) Producer groups (ex: Tennessee Cattlemen's Association, National Cattlemen's Beef Association, R-CALF), (3) Popular press articles (ex: Drovers, Beef Magazine, Cattle Today, etc.), (4) United States Department of Agriculture (ex: NASS, AMS, NRCS, FSA, etc.), (5) Internet sites, or (6) Other farmers." We also included an "Other" category. However, less than 7% of respondents used sources not listed. Among those other sources were cooperatives, family members, RFD-TV, farm supply stores, customer feedback, farm shows, brokers, accountants, and veterinarians.
The survey also involved questions that would allow us to explore the effects of certain variables on respondents' use of information sources. Specifically, questions regarding farmer demographics and farm characteristics were included. As well, farmers were asked about their risk preferences regarding their overall business, financial matters related to their beef cattle business, new herd management practices, new market outlets, and retaining ownership. The response set for each item regarding willingness to take on risk was a 10-point Likert scale ranging from 1 (not at all willing) to 10 (very willing). Rather than use each of these risk measures, we calculated a summative rating scale. We applied Cronbach's alpha to measure the reliability of this scale (0.8 or higher reflects a high degree of correlation [Cronbach, 1951]). The scale reliability coefficient we calculated was 0.8612. The 50th percentile of this risk-preferences scale across the respondents was 6.4. We then created a dummy variable (Risk Taker); 1 represented greater risk takers having a score of at least 6.4, and 0 represented less risk-tolerant individuals with scores below 6.4. Use of the dummy variable measure for risk-taking attitudes enabled us to compare probabilities of using information across high-risk-taking and low-risk-taking groups.
Modeling
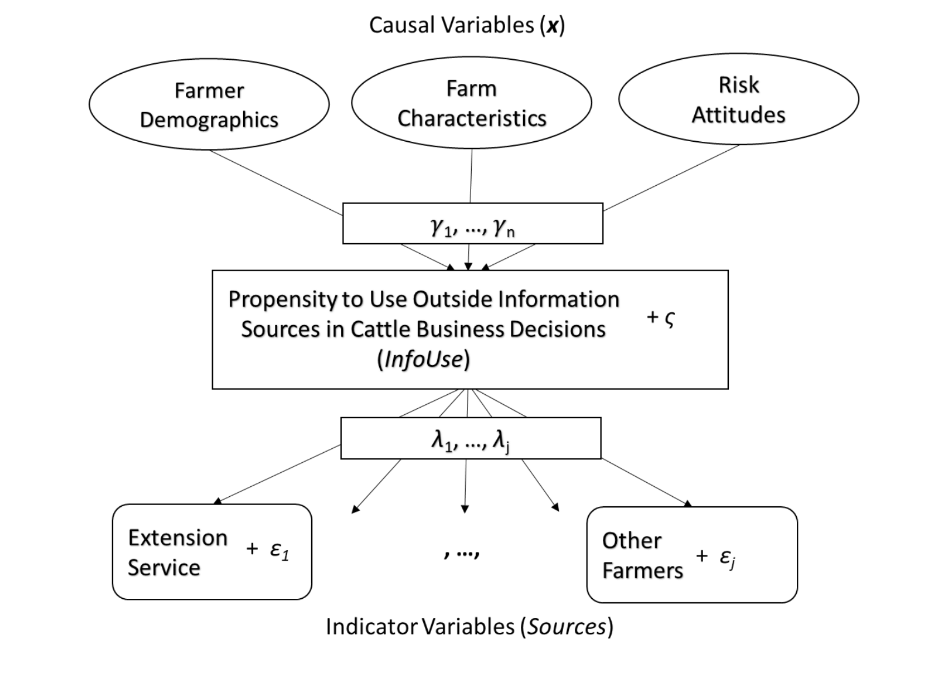
The MIMIC model is a structural latent variable econometric model researchers can apply to estimate an unobserved, or latent, variable using indicator and explanatory/causal variables (Richards & Jeffrey, 2000). The latent variable to which we applied the MIMIC model was an index representing the propensity of farmers to use information sources in their beef cattle business (InfoUse), which we constructed as a function of independent variables, such as farmer demographics or farm characteristics. Larger negative (positive) values of this latent variable represent a lower (greater) propensity to use information sources.
The types of information sources used (Source), such as Extension or other farmers, serve as indicators of the beef cattle farmers' propensity to use information sources in operating their beef cattle businesses (InfoUse). Explanatory "causal," or independent, variables are the exogenous factors of farmer demographics, farm characteristics, and farmer risk preferences that we hypothesized affect a farmer's propensity to use information sources in making cattle business decisions (the latent variable, InfoUse). Table 1 shows the indicator and independent variables involved in our study.
| Variable name | Variable description |
| Extension Service | 1 if use Extension Service information in making beef cattle business decisions, 0 otherwise |
| Producer Groups | 1 if use producer groups' information in making beef cattle business decisions, 0 otherwise |
| Popular Press | 1 if use popular press information in making beef cattle business decisions, 0 otherwise |
| United States Department of Agriculture | 1 if use U.S. Department of Agriculture information in making beef cattle business decisions, 0 otherwise |
| Internet | 1 if use Internet information in making beef cattle business decisions, 0 otherwise |
| Other Farmers | 1 if use other farmers' information in making beef cattle business decisions, 0 otherwise |
| Age Farmer Greater Than 70 | 1 if age of farmer greater than 70 years, 0 otherwise |
| Age Farmer Less Than 30 | 1 if age of farmer less than 30 years, 0 otherwise |
| Household Income ($1,000) | 2015 household income in $1,000 |
| Household Income Squared ($1,000) | 2015 household income in $1,000 squared |
| College Graduate | 1 if college graduate, 0 otherwise |
| Sole Proprietor | 1 of sole proprietor, 0 otherwise |
| Percentage Farm Income from Beef | Percentage of 2015 farm income from beef |
| Precondition | 1 if precondition calves, 0 otherwise |
| Background | 1 if background, 0 otherwise |
| Retain or Finish | 1 if retain or finish on farm, 0 otherwise |
| Risk Taker | 1 if greater willingness to take risk, 0 otherwise |
A MIMIC model consists of two types of equations: structural and measurement (Richards & Jeffrey, 2000). This is so that it can explain the relationship between the causal variables and the latent variable and describe the relationships between indicator variables and the latent variable. In our study, the structural equation specified the relationship between the latent variable, InfoUse, and the matrix of observable causal variables, x (Age Farmer Greater Than 70, . . ., Risk Taker), where γ is a matrix of parameters to be estimated and the random error term is ς, so
The measurement equations specify the relationships between the indicator variables, Sourcej (j = 1, . . ., 6, representing each of the six information sources), and the latent variable, InfoUse, where the λs are parameters to be estimated and εi is an error term (Bollen, 1989), such that
The random error terms ς and εj are assumed to be independent, to be normally distributed, and to have an expected value of zero (Dell'Anno & Schneider, 2004). The reduced form equation for the indicator variables (Sourcej) can then be written as
Figure 1 shows the interactions of causes, indicators, the latent variable, and error terms.
Figure 1.
Multiple Indicators, Multiple Causes Model
To model Equation 2 for each information source, we used logit regressions for each of the specific information sources (Sourcej). For Equation 1, we used a regression model to relate the unobserved latent variable (InfoUse) to the causal variables of farmer demographics, farm characteristics, and farmer risk attitudes.
We also examined how farmer demographics, farm characteristics, and risk attitudes influence farmer use of multiple information sources concurrently. On average, farmers used 3.7 sources of information, and 53.5% used greater than three sources of information. We created a dummy variable to represent whether the farmers used greater than three information sources. To estimate how demographics, farm characteristics, and farmer risk attitudes might influence use of multiple information sources, we estimated a logit model. The probability of a farmer's using more than three information sources was expressed as
/ (1 + exp(Age Farmer Greater Than 70 + . . . + 𝛾11 Risk Taker). (4)
We calculated the marginal effects of the variables on the probability by multiplying the estimated coefficient for a variable by the logistic density function.
Results
Sample Characteristics
A total of 4,661 farmers were successfully reached by email with a link to the full survey. In total, 864 farmers who were primary beef cattle business decision makers and had beef cattle operations on their farms responded. Of the 864 respondents, 671 farmers answered all the questions necessary for our analysis. The most commonly used information source was Extension at 81.8%, followed by other farmers at 72.7%. Additionally, 68.1% used information from producer groups, and 54.2% used information from the popular press. The least used information sources were the Internet at 52.6% and USDA at 42.8%. Less than 1% of the responding farmers did not use any of the sources.
Among the responding farmers, 7.3% were over the age of 70, 3.3% were under the age of 30, and 89.4% were 30 to 70 years of age. The average age of farmers participating in our survey was 53.5 years, and the average age of farmers in Tennessee reported in the 2012 Census of Agriculture was 59.2 years (USDA NASS, 2012). The farmers, on average, had household incomes of $125,834 (including farm and nonfarm income). Although we do not have access to Tennessee beef cattle farmers' overall household incomes, we can suggest that this household income level likely was higher than the average household income for Tennessee beef cattle farms because these were farmers who participated in the TAEP. As a reference point, however, USDA Agricultural Resource Management Survey data show that U.S. median household farm income for 2015 was $76,250 (USDA Economic Research Service, 2018). Nearly 58% of our respondents were college graduates, and 81% were sole proprietors. Data from the 2012 Census of Agriculture indicated that 93% of all farms were owned by families or individuals (USDA NASS, 2012). On average, farmers in our study derived approximately 52% of their farm income from beef. About 41% preconditioned calves, 30% backgrounded cattle, and 38% retained ownership or finished cattle on their farms. With regard to risk-taking attitudes, 52% expressed relatively high levels of willingness to take risk.
MIMIC Model
The estimated MIMIC model is presented in Table 2. For each information source, the coefficient on the latent variable, InfoUse, is significant in the measurement equations. This result suggests that the information sources serve as good measures of the farmers' propensity to use information sources in beef cattle decision making. Each coefficient on InfoUse is positive, indicating that information sources serve as complements of rather than substitutes for each other. The logit equations correctly classify 85.5% for Extension Service, 79.1% for Producer Groups, 84.1% for Popular Press, 79.9% for United States Department of Agriculture, 72.1% for Internet, and 72.6% for Other Farmers.
Also shown in Table 2, the estimated coefficients on several of the causal variables in the structural equation model are significant. Being under age 30 had a negative effect on InfoUse. Additionally, although household income had a positive effect, the squared term had a negative effect. The turning point was about $194,000. Being a college graduate had a positive effect on InfoUse, as did both having a higher percentage of farm income from beef and preconditioning calves. However, retaining or finishing animals had a negative influence. Having greater willingness to take risk had a positive effect on InfoUse. According to the signs and significances of the estimated coefficients, farmers with lower propensity to use information sources were those who were younger (under age 30), those who had lower farm incomes, those who were not college graduates, those who obtained a lower percentage of farm income from beef cattle farming, those who retained or finished cattle, and those who had less willingness to take risk.
| Equation variables | Measurement equations | Structural equation | |||
| λ (InfoUse) | Intercept | % correctly classified | 𝛾 | ||
| Measurement equations indicator variables | |||||
| Extension Service | 1.457*** | 0.818** | 85.5 | ||
| Producer Groups | 1.174*** | -0.035 | 79.1 | ||
| Popular Press | 1.674*** | -1.216*** | 84.1 | ||
| United States Department of Agriculture | 1.315*** | -1.575*** | 79.9 | ||
| Internet | 1.008*** | -0.770*** | 72.1 | ||
| Other Farmers | 0.492*** | 0.596*** | 72.6 | ||
| Structural equation causal variables | |||||
| Age Farmer Greater Than 70 | 0.224 | ||||
| Age Farmer Less Than 30 | -0.546* | ||||
| Household Income ($1,000) | 0.003* | ||||
| Household Income Squared ($1,000) | -0.000** | ||||
| College Graduate | 0.310*** | ||||
| Sole Proprietor | -0.051 | ||||
| Percentage Farm Income from Beef | 0.004*** | ||||
| Precondition | 0.214** | ||||
| Background | 0.205* | ||||
| Retain or Finish | -0.226** | ||||
| Risk Taker | 0.516*** | ||||
| Log-likelihood -2,322.243 | |||||
| ***significant at .01. **significant at .05. *significant at .15. | |||||
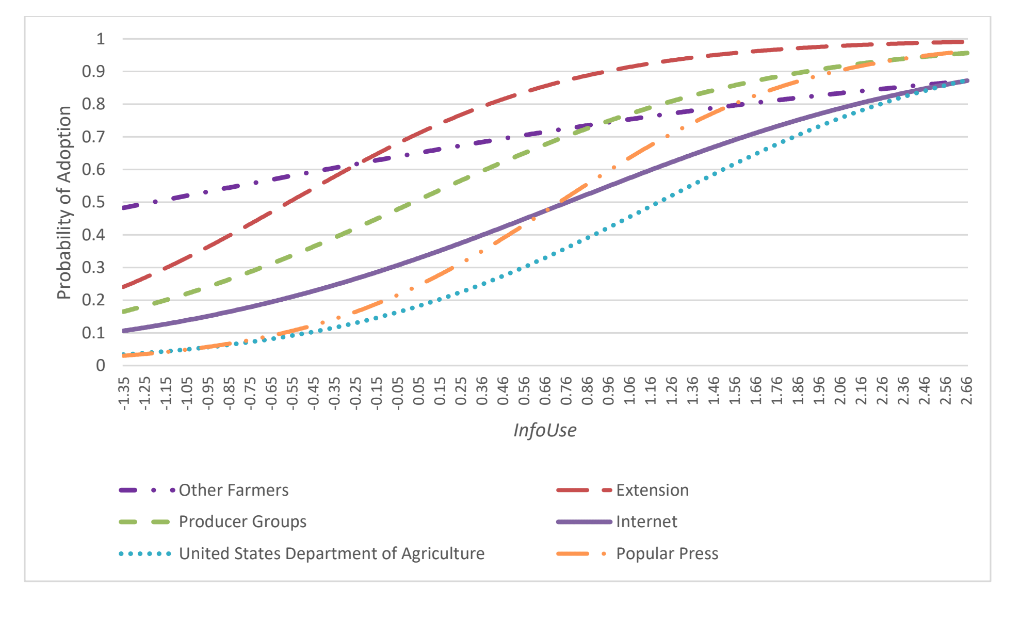
We generated curves showing the probability of farmers' adopting each of the information sources based on the estimated coefficients shown in Table 2 and the values of InfoUse that were estimated from the model. Figure 2 shows these adoption curves. Low values of InfoUse reflect a low propensity to use outside information on the part of the farmer and vice versa. The curves show how the probability of adopting a particular type of information source (e.g., other farmers, Extension) changes as InfoUse increases. Sources adopted at lower levels of InfoUse reflect wider adoption by farmers, being adopted even among those with low propensity to adopt information sources. As the figure shows, wider adoption (at lower levels of InfoUse) occurs for information from other farmers and Extension. The Internet, popular press, and USDA are adopted at higher levels of InfoUse. Although information from other farmers is adopted as a source at lower levels of InfoUse compared with other sources, the curve is relatively flat, and Extension, producer groups, and popular press adoption rates eventually surpass the adoption rate for other farmers as InfoUse increases.
Figure 2.
Adoption Curves for Information Sources
Logit Model
The results from the logit model for probability of using greater than three information sources are presented in Table 3. Farmers who were under 30 years old were 22.3% less likely to use greater than three sources of information compared with farmers who were 30 to 70 years old. Each $1,000 increase in farm income derived from beef increased the probability of using greater than three information sources by 0.1%. The positive effect of farm income occurred up to $208,000, after which the effects of an increase in income of $1,000 became negative by 0.0003%. Farmers who were college graduates were 8.3% more likely to use greater than three sources of information compared with those who were not college graduates. Farmers who preconditioned calves were 7.4% more likely to use more than three information sources compared with those who did not precondition. Farmers who were greater risk takers were 15.2% more likely to use more than three information sources compared with those who were less willing to take on risk.
| Variable | Est. coeff. | Marginal effect |
| Intercept | -1.074*** | |
| Age Farmer Greater Than 70 | 0.334 | 0.075 |
| Age Farmer Less Than 30 | -0.976** | -0.223** |
| Household Income ($1,000) | 0.006** | 0.001** |
| Household Income Squared ($1,000) | -0.000** | -0.000** |
| College Graduate | 0.362** | 0.083** |
| Sole Proprietor | -0.225 | -0.052 |
| Percentage Farm Income from Beef | 0.007*** | 0.002*** |
| Precondition | 0.324** | 0.074** |
| Background | 0.230 | 0.053 |
| Retain or Finish | -0.266 | -0.061 |
| Risk Taker | 0.664*** | 0.152*** |
| Log-likelihood -435.926 | ||
| LR chi(11) 55.06*** | ||
| Percentage correctly classified 62.15% | ||
| ***significant at .01. **significant at .05. *significant at .15. | ||
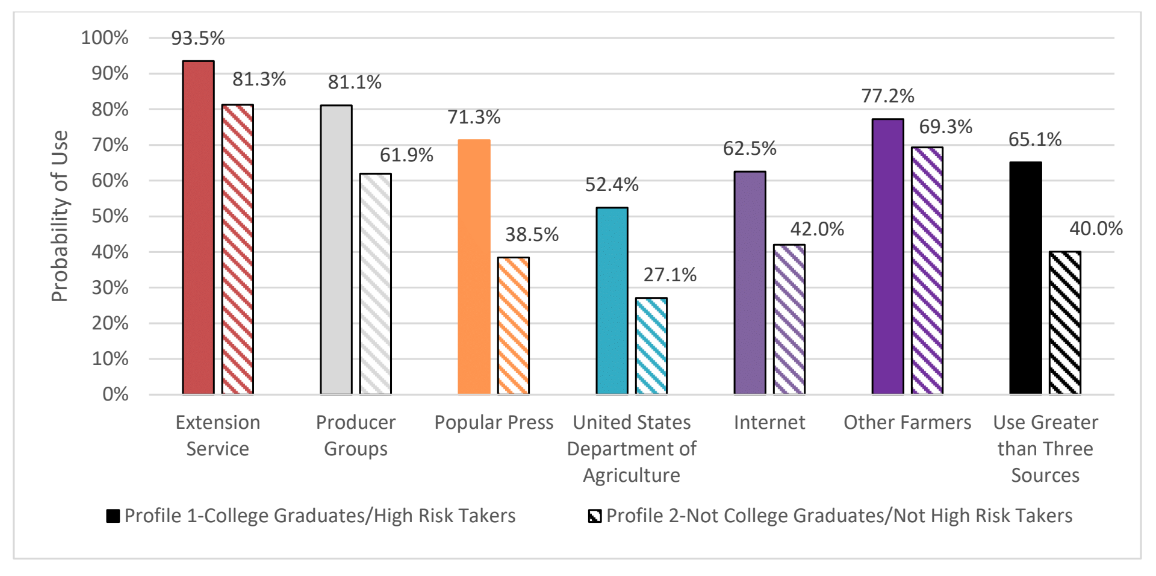
We developed two profiles to demonstrate the effects of education and risk preferences on information use and the probabilities of farmers' using the various sources of information. The probabilities for these two profiles are shown in Figure 3. We constructed the first profile to include college graduates and greater risk takers and the second to include farmers who were not college graduates and those who were less willing to take risk. All other variables were held at their means. For each type of information source, we found that the probability of use was lower among farmers fitting the second profile. The largest differences across the two profiles were for using information from popular press outlets, the USDA, and the Internet. The smallest differences across the two profiles were for using information from other farmers and Extension. The probability of using greater than three information sources was 65% for farmers fitting the first profile but only 40% for those fitting the second.
Figure 3.
Probability of Information Use Across Two Profiles (N = 671)
Conclusions
Because our sample was Tennessee beef cattle farmers participating in the TAEP, some caution should be used in extrapolating our findings to all Tennessee beef cattle farmers or other farmers. However, our research does demonstrate that beef cattle farmers use information from a variety of sources depending on their demographics, farm characteristics, and risk attitudes. Through this research, we have an improved understanding of the information sources beef cattle farmers use when making business decisions and can better target the delivery of Extension programming on the basis of farmer demographics, farm characteristics, and risk attitudes. Because beef cattle farmer demographics, farm characteristics, and risk attitudes may not align with farmers of other agricultural commodities (e.g., corn, soybeans, cotton, wheat, fruits, vegetables, dairy, nursery stock), it may be beneficial to conduct similar studies to determine how other agricultural producers use information sources and thus how to improve the delivery of Extension programming according to the demographics of farmers involved with specific commodity groups. We found that as farmers were willing to take more risks, they were more likely to use multiple information sources. However, regardless of risk preferences and college education, our research shows that beef farmers were most likely to use Extension services for information. This finding suggests that Extension services are likely responsible for providing important information to beef cattle farmers from other information sources, such as the USDA. For example, Extension commonly uses research reports, refereed research, and secondary data from sources such as the USDA when disseminating information to beef cattle producers. This circumstance indicates that Extension is providing an important service to producers by synthesizing vast information (e.g., USDA research reports, peer-reviewed journal articles) and providing that information to producers.
The two methods we used for evaluating farmers' adoption of information sources were the MIMIC model and the logit model. These two models can be applied to other agricultural production systems to achieve similar objectives. The MIMIC model allowed us to measure adoption rates across each information source based on farmer demographics, farmer characteristics, and risk-taking attitudes. The logit model allowed us to measure the intensity of use of information given farmer demographics, farm characteristics, and risk-taking attitudes. This application demonstrates that this modeling framework is applicable not only for determining information use but also for exploring a variety of farmer decision-making situations where multiple outcomes are possible, including those involving production technologies, management practices, or marketing channels.
References
Bollen, K. A. (1989). Structural equations with latent variables. New York, NY: Wiley.
Crawford, C., Grossman, J., Warren, S., & Cubbage, F. (2015). Grower communication networks: Information sources for organic farmers. Journal of Extension, 43(3), Article 3FEA9. Available at: https://www.joe.org/joe/2015june/a9.php
Cronbach, L. J. (1951). Coefficient alpha and the internal structure of tests. Psychometrika, 16, 297–334.
Dell'Anno, R., & Schneider, F. (2004). The shadow economy of Italy and other OECD countries: What do we know? Department of Economics Discussion Paper, University of Linz, Linz, Austria.
Edge, B., Velandia, M., Lambert, D., Roberts, R., Larson, J., English, B., . . . Mishra, A. (2017). Changes in the use of precision farming information sources among cotton farmers and implications for Extension. Journal of Extension, 55(2), Article 2RIB2. Available at: https://www.joe.org/joe/2017april/rb2.php
Esposti, R., & Pierpaolo, P. (2000). Modelling change in Italian agriculture: A latent variable approach. Agricultural Economics, 22(3), 261–270.
Jensen, K., English, B., & Menard, J. (2009). Livestock farmers' use of animal or herd health information sources. Journal of Extension, 47(1), Article 1FEA7. Available at: https://www.joe.org/joe/2009february/a7.php
Kalaitzandonakes, N., & Monson, M. (1994). An analysis of potential conservation effort of CRP participants in the state of Missouri: A latent variable approach. Journal of Agricultural and Applied Economics, 26(1), 200–208.
Lambert, D., Paudel, K., & Larson, J. (2015). Bundled adoption of precision agriculture technologies by cotton producers. Journal of Agricultural and Resource Economics, 40(2), 1–21.
Marra, A., Jensen, K., Clark, C., English, B., & Menard, J. (2012). Information sources and farmers' attitudes toward switchgrass production as a biofuel feedstock. Journal of Extension, 50(5), Article 5RIB6. Available at: https://www.joe.org/joe/2012october/rb6.php
Ngathou, I., Bukenya, J. O., & Chembezi, D. M. (2006). Managing agricultural risk: Examining information sources preferred by limited resource farmers. Journal of Extension, 44(6), Article 6FEA2. Available at: https://www.joe.org/joe/2006december/a2.php/
Oliver, K. (2015). Analysis of beef cattle producers' propensity to adopt pasture management and prescribed grazing east of the 100th meridian (Master's thesis). The University of Tennessee, Knoxville, TN.
Quagrainie, K., McCluskey, J., & Loureiro, M. (2001). Reputation and state commodity promotion: The case of Washington apples. Selected Paper 2001 American Agricultural Association Meetings. Retrieved from http://ageconsearch.umn.edu/bitstream/20592/1/sp01qu01.pdf
Rejesus, R. M, Knight, T. O., Jaramillo, M., Coble, K. H., Patrick, G. F., & Baquet, A. E. (2008). Preference for risk management information sources: Implications for extension and outreach programming. Agricultural and Resource Economics Review, 37(1), 106–116.
Richards, T., & Jeffrey, S. (2000). Efficiency and economic performance: An application of the MIMIC model. Journal of Agricultural and Resource Economics, 25(1), 232–251.
Richards, T., & Patterson, P. (2005). A bilateral comparison of fruit and vegetable consumption: United States and Canada. Journal of Agricultural and Resource Economics, 30(2), 333–349.
U.S. Department of Agriculture Economic Research Service. Median farm income, median off-farm income, and median total income of farm operator households, 2012–17. Retrieved from https://www.ers.usda.gov/webdocs/charts/90805/medianfarmincome2012_2017november2018_d.html?v=6461.9
U.S. Department of Agriculture National Agricultural Statistics Service. 2012 census of agriculture: State tables. Retrieved from https://www.nass.usda.gov/Publications/AgCensus/2012/Full_Report/Volume_1,_Chapter_2_US_State_Level/