December 2019
|
December 2019 // Volume 57 // Number 6 // Research In Brief // v57-6rb3


Sowing Seeds of Evaluation: A Pilot Study Measuring Master Gardener Program Public Benefit
Abstract
We conducted an evaluation pilot study to measure the influence of the statewide University of California Master Gardener Program on participants who attended its public education events. We discuss (a) steps for developing a statewide evaluation and (b) findings from the event follow-up survey we used to evaluate public education participants' self-reported behavior changes. Our findings suggest that volunteer-led public education events resulted in participants improving science-based gardening practices. Our approach has implications for other states' Extension programs; sharing program evaluation measurement strategies and data across states can facilitate better communicating Extension's benefit to the public, thereby addressing a need identified in the literature.
Introduction
Across the United States, Extension faces increased pressure to evaluate and communicate program impact (Franz, 2011). Program participant satisfaction is simply not enough to garner support for organizational sustainability (Franz, 2015). Funders and stakeholders expect proof of how programs benefit participants. Program evaluation data provide the necessary evidence to help stakeholders value Extension work (Baughman, Boyd, & Franz, 2010).
To meet increasing accountability and advocacy demands, our group of personnel from the University of California (UC) Master Gardener Program and the institution's Program Planning and Evaluation Office worked together to launch a statewide evaluation to measure and communicate program outcomes around improved gardening practices. The UC Master Gardener Program has local delivery in 52 of California's 58 counties, with 6,154 active volunteers who annually donate more than 500,000 hr in public service (UC Master Gardener Program, 2019). Our key objective for the evaluation was to understand the benefit of volunteer-led education efforts, specifically the behavior change outcomes for participants who attended public education events.
Our effort filled an existing information gap. Reviewing the literature, we did not find any state-level evaluations of what results from master gardener volunteers' educational programming for the general public. Our evaluation approach can be informative for other states' Extension master gardener programs as well as for other locally implemented statewide programs.
Methods
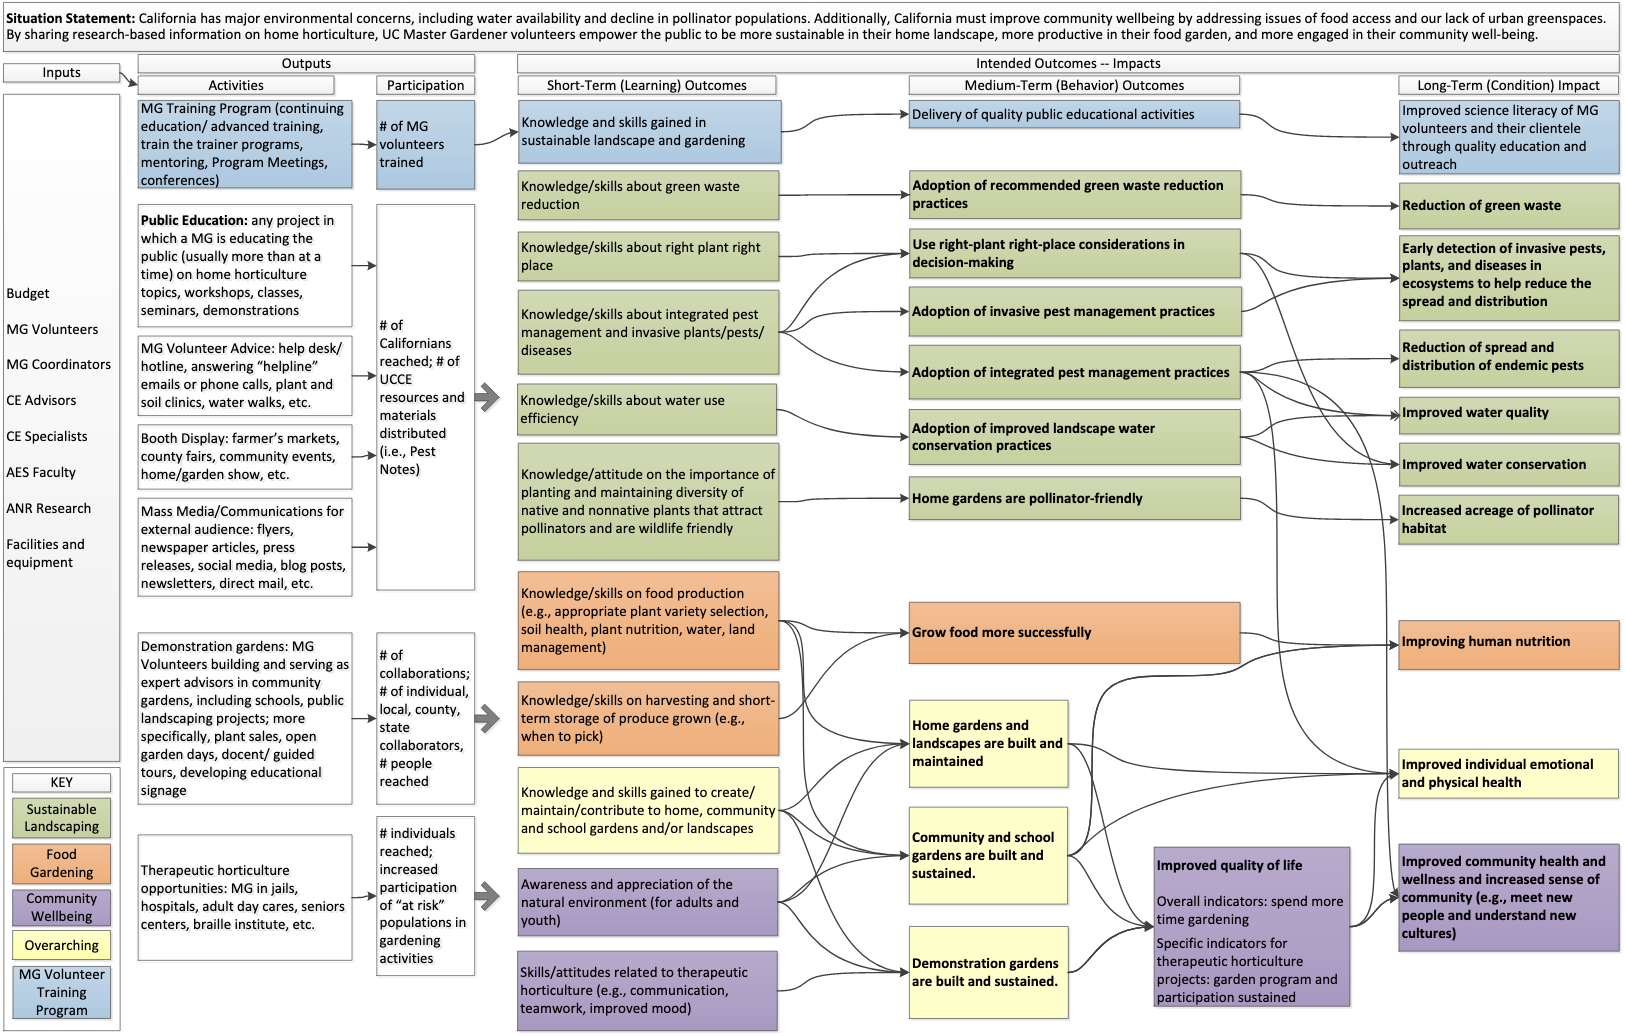
The UC Master Gardener Program's diverse 12-member advisory committee, to which members of our author team belong, developed a logic model to prioritize which participant behavior change outcomes should be measured. We used the approach described by Urban and Trochim (2009), creating a pathway model using directional arrows to connect public education events to specific short-, medium-, and long-term outcomes. We identified the program themes and topics that are the most significant and consistently addressed in programming delivered across the state. The logic model (see appendix) has three primary focus areas: sustainable landscaping, food gardening, and community well-being. Within the three focus areas, there are seven program topics: right-plant right-place, green waste, pest management, pollinator-friendly gardens, water conservation, food gardening, and time spent gardening/outdoors. Additionally, the model includes overarching outcomes related to development or improvement of home food gardens, home landscapes, and school and community gardens. We identified the most strategic behavior change outcomes to measure on the basis of their explicit connections to longer term condition changes. We made these pathway connections by identifying existing research that provides a safe inference for how our program outcomes can contribute to the broader public value. In this way, we were able to focus the scope of our evaluation.
The unit of analysis was participants in public education events, which included outreach efforts in which one or more master gardener volunteers hosted or delivered an educational presentation on a variety of gardening topics. The lengths and formats of the events ranged from 30-min workshops to multiple-day seminars. We chose such events as the focus of the evaluation because they were in-person endeavors and involved longer interventions than other activities, such as consultations on the phone or at fairs.
We designed an online Qualtrics survey to be administered 3 months after an educational event. Surveys for measuring self-reported behavior changes have been used in Extension, with shorter, 2-month follow-up time frames yielding higher response rates than longer, 10-month follow-up time frames (Koundinya, Klink, Deming, Meyers, & Erb, 2016). The survey measured self-reported change or intent to change for 26 behaviors, with participants choosing from five options for their responses (see Table 1 in the "Results" section). We chose to include intent to change given that 3 months may have been too soon for some individuals to have implemented desired gardening practices. In addition, we included questions addressing square footages and locations of gardens affected so that we could populate interactive maps illustrating the geographic scope of the behavior changes. We programmed the survey to display only questions applicable to topics covered in a particular event. We conducted face validity testing to ensure that we would measure what we aimed to measure.
Program coordinators and volunteers provided input on feasibility and improvement before our team finalized the instrument and the process. We designed procedures that would minimize the burden on volunteers and at the same time leverage the personal relationships they had within their communities. During educational events, volunteers recruited evaluation participants and collected participants' email addresses on contact sheets.
The UC Master Gardener Program hired a part-time evaluation coordinator to administer the survey and disseminate quarterly and annual statewide and county findings. Using the aforementioned contact sheets, the evaluation coordinator sent an introductory email to participants to thank them for participating and prepare them to expect the follow-up survey. Personalized survey email invitations were sent approximately 3 months after each event. Participants were given 2 weeks to respond to the survey. Nonresponders received two automated follow-up email reminders. An institutional review board approved the survey instrument, recruitment materials, and evaluation design.
Five county programs self-selected to participate in the pilot test, which occurred from March to August 2017. These programs varied in size, with the number of volunteers ranging from 100 to 300. During the pilot, 144 participants received the survey, and a 36% response rate was achieved. Respondents were primarily non-Hispanic (91%), White (87%), and female (80%) and between the ages of 51 and 70 (64%); these demographics suggest that the respondents accurately represented existing UC Master Gardener Program public event participants.
Results
In the results discussed herein, the UC Master Gardener Program public education event participants' behavior change outcomes and indicators are organized by program topic. We also present the results for the first six topics in Table 1 to show the distribution of responses across the 5-point scale used for the questions associated with those topics.
Right-Plant Right-Place
One item included in the survey was used for assessing behaviors related to the right-plant right-place topic. Results indicated that attendance at a public education event was a positive influence on participants' selection of plants according to size, maintenance, sun, and water needs. More specifically, 79% reported behavior change, suggesting that they either had started selecting plants on the basis of information gained from an event or had improved in this practice even though they already had been doing it.
Green Waste
Five items were used for assessing behavior change in green waste practices. Findings suggested that the greatest behavior change was related to participants' use of finished compost as a soil amendment. Seventy-three percent of participants who responded to the associated survey item indicated that they had changed in some way, with more than half reporting that they already practiced the behavior but had improved. Similarly, the 13 participants who reported on bin composting indicated that they already engaged in the practice but had improved. The least amount of behavior change occurred for the practice of worm composting; 50% of respondents indicated that they had not changed their worm composting behaviors.
Pest Management
Four items were used for assessing change in pest management practices. Seventy percent of respondents reported positive behavior change for the monitoring of insects, weeds, or diseases. Fifty-four percent reported that they had started or improved their existing practice of removing or not introducing invasive plants. Forty-six percent indicated that they had reduced unnecessary pesticide applications, and 39% reported that they had started or improved their practice of following pesticide label instructions.
Pollinator-Friendly Gardens
Three items were used for assessing change in pollinator-friendly gardening practices. Eighty percent of respondents reported a positive behavior change regarding their use of plants that attract and support pollinators. Fifty-four percent reported that they had started or improved their existing practice of providing water sources for pollinators. A lower proportion of respondents, 34%, reported behavior change for the practice of creating nesting habitats. Respondents indicated that they had applied practices learned on 37,770 ft2 of pollinator habitat.
Water Conservation
Seven items were used for assessing change in behaviors related to the water conservation topic. The findings suggested that the greatest behavior change occurred in participants' using mulch; 78% reported having started or improved in this practice. Additionally, 57% of respondents reported having started or improved in their existing use of a drip irrigation system, and 54% of respondents indicated that they had selected low-water-use plants. Responses also suggested that respondents had removed 1,700 ft2 of turf. Less change was reported for the practices of using a sprinkler system, using an irrigation controller, and using reclaimed, gray, or captured rainwater.
Food Gardening
Four items were used for assessing change in food gardening behaviors. Eighty-four percent of respondents reported that they had started or improved existing practices related to growing edible plants. Eighty-three percent reported growing an expanded variety of edible plants. Sixty-one percent reported reducing food loss, and 31% reported donating produce to community programs.
Time Spent Gardening/Outdoors
All participants were asked to indicate yes or no regarding whether they spent more time gardening or outdoors as a result of attending a public education event. The majority of respondents, 80%, reported spending more time gardening or outdoors.
Food Gardens, Home Landscapes, School/Community Gardens
All participants were asked to respond to additional survey items to provide information about the square footage and zip codes of the gardens and landscapes where they had applied new or improved practices learned during the public education events. Findings indicated that respondents had influenced a total of 300 ft2 of home food gardens and a total of 9,105 ft2 of home, school, and/or community gardens.
| Outcome indicators by topic |
No change % (No.) |
Not yet but intend to start % (No.) |
I started doing this % (No.) |
Already did this, but I have improved % (No.) |
Not presented or not applicable % (No.) |
|---|---|---|---|---|---|
| Right-plant right-place (42 responses) | |||||
| Selecting plants for any of the following: size, sun needs, water needs, maintenance level | 7.1% (3) | 4.8% (2) | 33.3% (14) | 45.2% (19) | 9.5% (4) |
| Green waste (15 responses) | |||||
| Bin composting | 30.8% (4) | 0% | 0% | 69.2% (9) | 0% |
| Worm composting | 50.0% (7) | 14.3% (2) | 14.3% (2) | 7.1% (1) | 14.3% (2) |
| Grass cycling | 42.9% (6) | 0% | 14.3% (2) | 14.3% (2) | 28.6% (4) |
| Using city-provided green waste bins | 38.5% (5) | 0% | 7.7% (1) | 38.5% (5) | 15.4% (2) |
| Using finished compost as a soil amendment | 20.0% (3) | 6.7% (1) | 20.0% (3) | 53.3% (8) | 0% |
| Pest management (24 responses) | |||||
| Reducing pesticide applications | 29.2% (7) | 0% | 12.5% (3) | 33.3% (8) | 25% (6) |
| Following pesticide label instructions | 30.4% (7) | 0% | 4.3% (1) | 34.8% (8) | 30.4% (7) |
| Monitoring for any of the following: insects, weeds, or diseases | 20.8% (5) | 4.2% (1) | 20.8% (5) | 50% (12) | 4.2% (1) |
| Removing or not introducing invasive plants | 20.8% (5) | 4.2% (1) | 16.7% (4) | 37.5% (9) | 20.8% (5) |
| Pollinator-friendly gardens (36 responses) | |||||
| Using plants that attract and support pollinators | 8.3% (3) | 0% | 27.8% (10) | 52.8% (19) | 11.1% (4) |
| Providing water sources for pollinators | 17.1% (6) | 11.4% (4) | 11.4% (4) | 42.9% (15) | 17.1% (6) |
| Creating nesting habitats | 28.6% (10) | 17.1% (6) | 8.6% (3) | 25.7% (9) | 20% (7) |
| Water conservation (28 responses) | |||||
| Using mulch | 14.8% (4) | 3.7% (1) | 22.2% (6) | 55.6% (15) | 3.7% (1) |
| Using a drip irrigation system | 17.9% (5) | 17.9% (5) | 7.1% (2) | 50% (14) | 7.1% (2) |
| Using a sprinkler system | 46.4% (13) | 14.3% (4) | 3.6% (1) | 21.4% (6) | 14.3% (4) |
| Using an irrigation controller | 35.7% (10) | 7.1% (2) | 7.1% (2) | 32.1% (9) | 17.9% (5) |
| Selecting low-water-use plants | 23.1% (6) | 3.8% (1) | 11.5% (3) | 42.3% (11) | 19.2% (5) |
| Using reclaimed, gray, or captured rainwater | 32.1% (9) | 17.9% (5) | 10.7% (3) | 10.7% (3) | 28.6% (8) |
| Reducing turf area | 35.7% (10) | 10.7% (3) | 14.3% (4) | 21.4% (6) | 17.9% (5) |
| Food gardening (25 responses) | |||||
| Growing edible plant(s) | 16% (4) | 0% | 20% (5) | 64% (16) | 0% |
| Expanding varieties of edible plant(s) | 12.5% (3) | 4.2% (1) | 16.7% (4) | 66.7% (16) | 0% |
| Reducing food loss | 38.9% (7) | 0% | 5.6% (1) | 55.6% (10) | 0% |
| Donating produce to community programs | 53.8 (7) | 15.4% (2) | 0% | 30.8% (4) | 0% |
Conclusion and Implications
More than 50% of respondents indicated that they had started or improved existing gardening practices for 14 of the 26 behavior change outcome indicators measured. The variation in responses suggests both that the questionnaire provides appropriate multiple-choice options and that social desirability bias is not a high concern in the findings. For a vast majority of the behavior change questions, the percentage of individuals saying they had improved practices was higher than the percentage saying they had started practices. This circumstance may indicate that community members who choose to attend the public education events already have some level of gardening skills. Over three quarters of respondents answered at least one of the five questions about square footages, indicating that it is reasonable to ask participants this type of question.
Lessons learned from our pilot study led us to improve the process for obtaining participants' contact information by providing additional sign-in templates and coaching. Additionally, representatives of local programs needed assistance with determining which events qualified as appropriate for the study. Given the need for technical assistance, we recommend employing a part-time evaluation coordinator for such a study.
There are several limitations to our evaluation. Participation was limited to individuals who had Internet access and provided a correct email address. The actions of obtaining site participation rates and monitoring event participation were not feasible due to program capacity and existing reporting system procedures. Further research could shed light on additional motivations for and barriers to implementing improved gardening practices.
Our pilot study has implications for other states' master gardener programs as well as other statewide Extension programs. We believe it meets the nationwide need, identified by Wise (2017), for better articulation of Extension's "capacity to deliver educational programs that change the behavior of its clientele" (para. 2). We agree with Wise (2017) that the means to that end should not "undercut the local educator's experience with and insight into the local audience and his or her capability to finesse programming to fit local culture and need—another major strength of the Extension network" (para. 12). The approach we took focuses on evaluating behavior change using common measures and still allows for local adaption of programming. Our pilot evaluation provides an example of how to develop and use common measures, which are lacking across Extension. In particular, the common measures of behavior change we used may serve as a model for the nearly 50 states across the nation that have master gardener programs. Overall, sharing program evaluation measurement strategies and data across states and institutions will help Extension professionals better communicate our programs' benefits to the public (Franz, Arnold, & Baughman 2014).
Next steps include launching the outcome evaluation in the remaining counties in California. Additionally, we will share county-specific data quarterly to facilitate local program refinement, development of partnerships, communication of impact to county-level decision makers, and volunteer recruitment. At the state level, we will develop impact statements, a statewide annual report, and interactive maps for use at the local, university, state, and national levels. These resources will be an important part of marketing, communication, and fund development activities.
Acknowledgments
We want to acknowledge the statewide advisory committee for their contributions to the evaluation design and development and the UC Master Gardener Program coordinators and volunteers for their participation in the pilot study.
References
Baughman, S., Boyd, H., & Franz, N. (2010, November). Beyond reporting: Do Extension educators use the results of evaluation? Paper presented at the annual meeting of the American Evaluation Association, San Antonio, TX.
Franz, N. (2011). Advancing the public value movement: Sustaining Extension during tough times. Journal of Extension, 49(2), Article 2COM2. Available at: http://www.joe.org/joe/2011april/comm2.php
Franz, N. (2013). Improving Extension programs: Putting public value stories and statements to work. Journal of Extension, 51(3), Article 3TOT1. Available at: https://www.joe.org/joe/2013june/tt1.php
Franz, N. (2015). Programming for the public good: Ensuring public value through Cooperative Extension program development model. Journal of Human Sciences and Extension, 3(2), 13.
Franz, N., Arnold, M., & Baughman, S. (2014). The role of evaluation in determining the public value of Extension. Journal of Extension, 52(4), Article 4COM3. Available at: https://joe.org/joe/2014august/comm3.php
Koundinya, V., Klink, J., Deming, P., Meyers, A., & Erb, K. (2016). How do mode and timing of follow-up surveys affect evaluation success? Journal of Extension, 54(1), Article 1RIB1. Available at: https://www.joe.org/joe/2016february/rb1.php
University of California Master Gardener Program. (2019). UC Master Gardener Program 2018 annual report. Retrieved from http://mg.ucanr.edu/files/302109.pdf
Urban, J., & Trochim, W. (2016). The role of evaluation in the research-practice integration: Working toward the "golden spike." American Journal of Evaluation, 30(4). https://doi.org/10.1177/1098214009348327
Wise, D. (2017). Evaluating Extension impact on a national level: Focus on programs or concepts? Journal of Extension, 55(1), Article 1COM1. Available at: https://www.joe.org/joe/2017february/comm1.php