June 2018
|
June 2018 // Volume 56 // Number 3 // Feature // v56-3a6


Relevant Information Sources in the Vast and Complex Manure Nutrient Management Network
Abstract
To understand and delineate pathways for effective information transfer among professional audiences in manure nutrient management, we deployed a survey, taken by 964 professionals, addressing workforce demographics, tasks performed, and information source relevance. Findings indicate that education of industry and the public is a widespread effort among the multiple organizations represented. The average relevance of different types of information sources was consistent across various organization types. Compared to mass media sources, information sources that were technical and individual- or group-oriented in nature were more relevant to respondents representing all organization types and levels of knowledge. Opportunities exist for translation of the findings presented to other networks of entities working toward common objectives.
Introduction
Broad societal outcomes, such as optimized agricultural productivity and environmental quality, require a complex network of constituents, including personnel across multiple Extension program areas, to develop and translate research, new technology, policy, and management practices for organizations and individuals. Responsible manure management is an example of an objective that unites multiple organizations and constituents. Livestock and poultry manures are a source of valuable crop nutrients, but there are potential environmental and social risks associated with the storage, transfer, and application of manure. Significant resources have been invested related to conducting manure nutrient management research, developing educational programming, and influencing environmental policy. The content developed to convey manure management recommendations must be communicated across a complex network of constituents that influence the management of manure, including Extension and outreach program personnel; federal, state, and local governments; producers; technical service providers; manure transfer and application companies; and those who support the end users, including sales, consulting, and commodity organizations.
Research supports the conventional belief that agricultural producers are often selective about where they obtain information (Crawford, Grossman, Warren, & Cubbage, 2015; Korsching & Hoban, 1990; Napier, Thraen, & Napier, 1988; Tucker & Napier, 2002). The adoption of new technology by agricultural producers is often predicated on how much access farmers have to experts (Sassenrath et al., 2008) or their social networks (Bates & Arbuckle, 2017; Noy & Jabbour, 2017). However, minimal available research describes the relevance of information sources for those working in regulatory, Extension, outreach, and service professions. Likewise, few data are available that describe how information related to manure management, in particular, is communicated across this professional network. Given the complex network of people and organizations involved in manure nutrient management, there are many venues and pathways for information transfer. To further complicate matters, regional differences and issues related to manure nutrient management exist because of variations in regulations, climate, dominant livestock species/manure types, natural resource pressures, land availability, and social paradigms.
As basic and applied research efforts evolve to influence the understanding of manure and best management practices, information about relevant findings must be effectively disseminated to facilitate adoption by end users. Identifying target audiences and determining the most effective methods for communicating information to influence their decision making has historically been a challenge in Extension and elsewhere. We examined demographics within the network of manure nutrient management professionals and the relevance of information formats, settings, and methods (hereafter referred to as "sources of information") used by the network's members. The ultimate use of our findings will be to identify effective pathways for information transfer within the network of individuals and organizations working toward the adoption of improved manure nutrient management practices. This article does not delve into the language or messaging of the information, nor the information sources used by persons outside the network. However, there are opportunities for translation of our approach and results to other networks that similarly involve various types of organizations and individuals working toward common objectives, such as in the areas of pest management, facilitation of organic agriculture, or climate education.
Approach
We distributed an online survey (referred to as the "Pathways" survey) to obtain the perspectives of manure management professionals on the relevance of information sources. We engaged a purposeful snowball sampling technique, using the electronic mailing lists of several professional and producer organizations associated with manure management, to distribute the survey instrument. We distributed the survey in South Dakota in 2014 and nationally in 2015. During each dissemination, we sent one or more follow-up emails during a 2-month period as reminders to recipients to complete the survey. We also encouraged survey recipients to forward the survey to appropriate colleagues.
The relevance questions involved a 4-point scale that respondents used to indicate how negatively or positively they viewed an information source on the basis of the description provided. The survey also included personal questions, such as questions about level of knowledge of manure management and importance of manure management, years of experience with manure management, nature of the organization with which the respondent was associated, age group, gender, and state of residence.
We used SPSS (Version 22.0) (IBM Corporation, Armonk, NY) to perform correlation and factor analyses. Unless otherwise noted, we considered most variables nonparametric and analyzed using Spearman rho bivariate correlation (Agresti & Finlay, 2009). The factor analyses (principal components extraction with varimax rotation) separated statistically correlated clusters of variables. On the basis of the cluster variables, we titled the categories according to commonalities in the content, formats, and methods included for discussion purposes.
The South Dakota State University Institutional Review Board deemed the survey exempt under federal regulation 45 CFR 46.101 (b) (IRB-1402010-EXM and IRB-1502001-EXM).
Findings
Demographics of Survey Participants
There were 964 surveys partially completed and 608 fully completed; we used data from partially completed surveys in the analyses. Respondents were geographically distributed across 49 states (98%), four Canadian provinces (1%), and unspecified locations (1%). Over 50% of the responses were from six states: Pennsylvania (13.2%), South Dakota (9.4%), Nebraska (7.7%), North Dakota (7.2%), Ohio (7.0%), and Oklahoma (6.4%).
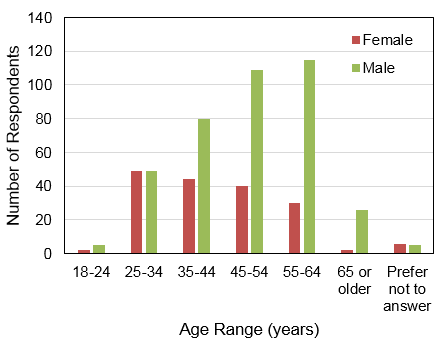
Age and gender. The age and gender distributions of respondents are shown in Figure 1. The relative number of respondents increased with age. The numbers of females and males in the 18–24 age category were equivalent, and the relative percentage of females to total respondents decreased with each increasing age bracket.
Figure 1.
Distributions by Age and Gender of Manure Nutrient Management Professional Respondents to the Pathways Survey
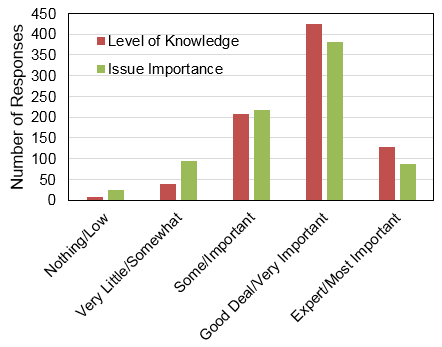
Levels of knowledge about and importance of manure nutrient management. Because the survey targeted people involved in manure nutrient management, over 68% of respondents reported levels of knowledge about manure management as being greater than "some" knowledge. The respondents' distribution for level of knowledge mirrored their perceptions about the level of importance of the issue relative to all issues respondents address in their professional capacity (Figure 2).
Figure 2.
Self-Perceived Levels of Knowledge and Issue Importance Regarding Manure Nutrient Management
Organization type. Table 1 summarizes the distribution of organization types represented in the survey data. On the basis of this distribution, the remainder of the article is focused on the six types of organizations having more than 10% of the total survey population's responses: university/Extension (UE); government nonregulatory agencies (GNRA); government regulatory agencies (GRA); producers (P); special government entities (SG); and sales or private service enterprises (SPE).
| Organization type | Total responses, # | Proportion of responses, % | Completeda surveys, # | Organizational completion rate, % |
| University or Extension | 189 | 24.3 | 158 | 83.6 |
| Government nonregulatory agency (examples: NRCS, USGS, NOAA) | 155 | 19.9 | 130 | 83.9 |
| Government regulatory agency (examples: EPA, Department of Environment, Department of Agriculture) | 106 | 13.6 | 94 | 88.7 |
| Producer | 97 | 12.5 | 52 | 53.6 |
| Special government entity (example: conservation district) | 88 | 11.3 | 72 | 81.8 |
| Sales or private service enterprise (examples: consultant, technical service provider, sales, custom applicator) | 85 | 10.9 | 53 | 62.4 |
| Commodity or advocacy group (examples: crop association, livestock association) | 16 | 2.1 | 10 | 62.5 |
| Nonprofit private service group (example: International Plant Nutrition Institute) | 15 | 1.9 | 9 | 60.0 |
| News or media outlet | 9 | 1.2 | 7 | 77.8 |
| Tribal government or agency | 3 | 0.4 | 2 | 66.7 |
| Other | 14 | 1.8 | 7 | 50.0 |
| No response | 187 | 14 | 7.5 | |
| Total | 964 | 608 | 63.1 | |
|
Note. NRCS = Natural Resources Conservation Service; USGS = United States Geological Survey; NOAA = National Oceanic and Atmospheric Administration; EPA = Environmental Protection Agency.
aCompleted means the respondent advanced through every question on the survey, even if a specific response was not provided for each question. |
||||
Tasks performed. Relative to a "select all that apply" list, the distributions of the numbers and types of tasks respondents selected were, as expected, different across organization types (Figure 3). Cumulatively across all organization types, the education of the general public and the agricultural community was the task selected most often (51% of respondents), indicating a widespread effort toward community engagement. The tasks of individual assistance and policy development were also common selections, with 36% and 25% of the responses, respectively. The UE respondents selected an average of 3.4 tasks per person, with primary focuses on general public education and research tasks. The GNRE respondents selected on average 2.2 tasks, and individual assistance was the task most commonly selected. The GRA respondents selected an average of 1.7 tasks from the list provided, with the majority of selections centered on policy development and compliance. The task most frequently selected by the P respondents was production of agricultural products. Several tasks could be interpreted as overlapping (e.g., education and generation of fact sheets).
Figure 3.
Distribution of Types of Tasks Performed Across Key Organization Types in the Manure Nutrient Management Profession
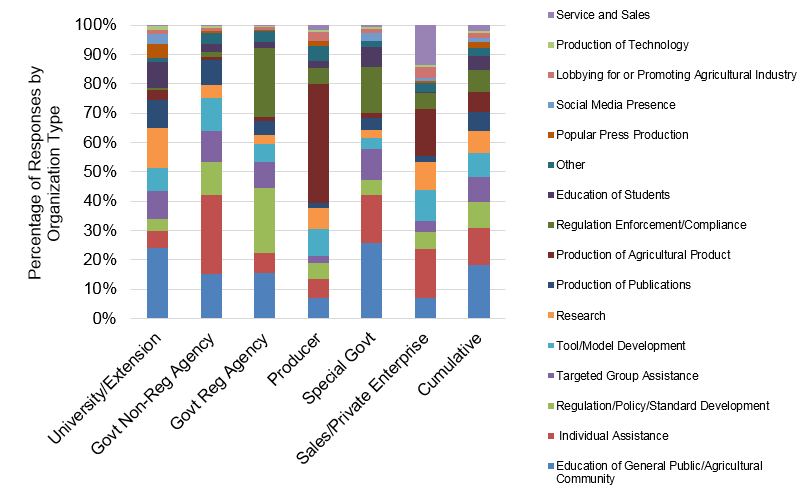
Note: Tasks are shown in the same order as the legend.
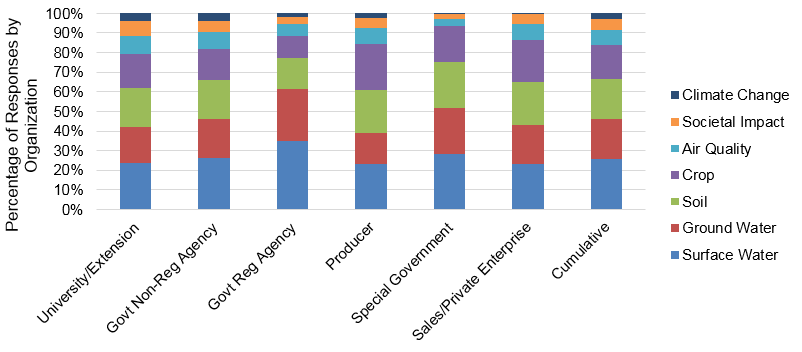
Environmental concerns. Manure nutrient management encompasses and affects many different aspects of the natural and social environment, referred to as "resources of concern" in the survey. When asked to identify resources of concern (by selecting all responses that applied), the option selected most often was surface water (67%), followed by groundwater (52%), soil (52%), and crops (45%). The remaining options accounted for less than 20% of responses. Figure 4 depicts the relative rankings of resources of concern across the organization types.
Figure 4.
Distribution of Environmental Concerns Across Key Organization Types in the Manure Nutrient Management Profession
Relevance of Information Sources by Organization Type
Survey respondents rated the relevance of 11 sources of information on manure nutrient management, from not relevant or do not use (1) to very relevant or useful (4) (Table 2). On the basis of the average mean value, a field or farm setting was the most relevant source of information for respondents in the UE (3.41), GNRA (3.35), GRA (3.28), P (3.41), and SG (3.47) organization types. Consultation was the most relevant information source for respondents in the SPE organization type (3.39).
Factor analysis indicated that the information sources could be grouped into three categories (Table 2), and the means and standard deviations of information source relevance were recalculated for each organization type. The Cronbach's alpha reliability statistics, which demonstrate how closely related a set of items are as a group, were 0.755, 0.666, and 0.662, for categories 1, 2, and 3, respectively.
Category 1 cluster variables, which we deemed technical and individual in nature, included the following components, as described in the survey:
- consultation (e.g., one-on-one contact with experienced professional/expert/peer or participation related to work groups, committees, advisory boards, technical advising);
- research paper or technical document written for technical audience (peer-reviewed);
- fact sheet, technical document, informational video, archived webinar; and
- science-based site (e.g., eXtension, University, ARS [Agricultural Research Service], NRCS [Natural Resources Conservation Service] sites).
Category 1 (technical/individual) was identified as having the greatest degree of relevance for UE (3.11), GNRE (3.00), and SG (3.11), compared to other cluster categories, and was significant for these organization types according to correlation analysis (p < .001).
Category 2 cluster variables, which we termed news and media, included the following sources:
- news or popular press article or newscast,
- social media content (e.g., Facebook, Twitter, blog), and
- decision tool (e.g., smartphone/tablet apps, models, assessment tools).
Category 2 (news/media) was significantly correlated (p < .001) with relevance responses by UE (2.35) and P (2.32) respondents. However, the mean relevance of this category was lowest among the three categories across all organization types.
Category 3 cluster variables, which we deemed formal and group-oriented in nature, included the following sources:
- classroom setting (e.g., teaching, curriculum),
- professional development setting (e.g., conference, seminar, workshop),
- field or farm setting (e.g., field day, tour), and
- web setting (e.g., webinar, video, online training).
Category 3 (formal/group) was significantly correlated (p < .001) with relevance responses by UE (3.06), GNRA (3.02), and GRA (3.10) respondents. The average relevance score for this category was lowest for the P respondents (2.65).
| M (SD) | ||||||
| Information source/category | UE | GNRA | GRA | P | SG | SPE |
| Classroom setting | 2.84 (0.876) | 2.59 (0.949) | 2.46 (0.896) | 2.37 (0.912) | 2.71 (0.917) | 2.47 (0.959) |
| Professional development setting | 3.33 (0.607) | 3.21 (0.626) | 3.24 (0.65) | 2.91 (0.786) | 3.37 (0.584) | 3.07 (0.767) |
| Field or farm setting | 3.41 (0.677) | 3.35 (0.608) | 3.28 (0.826) | 3.41 (0.734) | 3.47 (0.596) | 3.23 (0.760) |
| Web setting | 2.89 (0.671) | 2.83 (0.653) | 2.95 (0.638) | 2.57 (0.914) | 2.89 (0.599) | 2.61 (0.790) |
| Consultation | 3.15 (0.717) | 3.23 (0.771) | 3.26 (0.716) | 2.88 (0.848) | 3.03 (0.832) | 3.39 (0.666) |
| Research paper or technical document | 2.76 (0.833) | 2.65 (0.865) | 2.76 (0.889) | 2.16 (0.922) | 2.37 (0.913) | 2.52 (0.917) |
| Fact sheet, video | 3.08 (0.652) | 2.96 (0.691) | 3.13 (0.542) | 2.62 (0.783) | 2.97 (0.506) | 2.81 (0.666) |
| Science-based site | 3.27 (0.667) | 3.26 (0.645) | 3.26 (0.678) | 2.99 (0.780) | 3.12 (0.624) | 3.11 (0.682) |
| News or popular press article or newscast | 2.55 (0.710) | 2.38 (0.766) | 2.55 (0.761) | 2.31 (0.900) | 2.53 (0.768) | 2.18 (0.929) |
| Social media content | 2.15 (0.867) | 1.69 (0.813) | 1.66 (0.789) | 1.69 (0.822) | 1.95 (0.965) | 1.74 (0.891) |
| Decision tool | 2.69 (0.798) | 2.48 (0.908) | 2.30 (0.944) | 2.41 (0.935) | 2.31 (0.847) | 2.53 (0.944) |
| Other | 2.26 (1.125) | 1.69 (0.967) | 2.27 (1.077) | 2.41 (0.939) | 2.37 (1.025) | 1.78 (1.215) |
| Category 1 (technical/individual) | 3.11 (0.487) | 3.00 (0.500) | 2.98 (0.511) | 2.81 (0.582) | 3.11 (0.468) | 2.84 (0.632) |
| Category 2 (news/media) | 2.35 (0.706) | 1.86 (0.706) | 2.18 (0.674) | 2.32 (0.543) | 2.11 (0.691) | 1.97 (0.826) |
| Category 3 (formal/group) | 3.06 (0.506) | 3.02 (0.529) | 3.10 (0.502) | 2.65 (0.604) | 2.88 (0.445) | 2.94 (0.526) |
| Note. Relevance assessed on a scale of 1 (not relevant/do not use) to 4 (very relevant/useful). UE = university or Extension; GNRA = government nonregulatory agencies; GRA = government regulatory agencies; P = producers; SG = special government entities; SPE = sales or private enterprises. | ||||||
Relevance of Information Sources by Level of Knowledge
We analyzed the relevance of information sources relative to respondents' self-perceived levels of knowledge (Table 3). The field or farm setting was the most relevant source of information for respondents who indicated that they had very little knowledge (2.96), some knowledge (3.30), or a good deal of knowledge (3.35) and those who were experts (3.42). Professional development and the field or farm setting shared the highest relevance score (3.42) for expert respondents.
When we grouped the information sources into the three categories described previously, the mean relevance score for the news/media category was the lowest across all knowledge levels. For respondents who identified as having some knowledge or more, the mean relevance scores for the technical/individual and formal/group categories were within 0.02 to 0.08 of each other. When level of knowledge was correlated with relevance scores within categories of information sources, self-reported knowledge was positively correlated (p < .001) with the technical/individual category and the formal/group category; there was no correlation regarding relevance scores and the news/media category.
| M (SD) | ||||||
| Information source/category | Know nothing | Know very little | Have some knowledge | Have a good deal of knowledge | Expert | |
| Classroom setting | 2.33 (1.155) | 2.30 (1.020) | 2.46 (0.964) | 2.61 (0.898) | 2.71 (0.957) | |
| Professional development setting | 3.00 (1.000) | 2.78 (0.850) | 3.11 (0.694) | 3.19 (0.667) | 3.42 (0.563) | |
| Field or farm setting | 3.33 (0.577) | 2.96 (0.562) | 3.30 (0.781) | 3.35 (0.713) | 3.42 (0.623) | |
| Web setting | 2.67 (0.577) | 2.57 (0.788) | 2.67 (0.815) | 2.84 (0.675) | 2.93 (0.651) | |
| Consultation | 4.00 (0.000) | 2.65 (0.935) | 2.93 (0.821) | 3.26 (0.716) | 3.24 (0.802) | |
| Research paper or technical document | 2.67 (1.528) | 1.83 (0.937) | 2.39 (0.913) | 2.62 (0.885) | 2.88 (0.832) | |
| Fact sheet, video | 3.00 (1.000) | 2.52 (0.898) | 2.85 (0.740) | 2.99 (0.624) | 3.11 (0.606) | |
| Science-based site | 3.33 (0.577) | 2.70 (0.822) | 3.09 (0.644) | 3.23 (0.691) | 3.34 (0.592) | |
| News or popular press article or newscast | 3.00 (1.000) | 2.30 (0.822) | 2.48 (0.836) | 2.42 (0.799) | 2.45 (0.733) | |
| Social media content | 2.00 (1.000) | 2.04 (0.928) | 1.99 (0.951) | 1.80 (0.859) | 1.78 (0.825) | |
| Decision tool | 2.67 (0.577) | 2.13 (1.058) | 2.43 (0.934) | 2.47 (0.887) | 2.61 (0.848) | |
| Other | 2.33 (1.155) | 1.83 (0.983) | 2.00 (1.065) | 1.96 (1.044) | 2.59 (1.121) | |
| Category 1 (technical/individual) | 2.83 (0.764) | 2.65 (0.634) | 2.89 (0.558) | 2.99 (0.532) | 3.12 (0.461) | |
| Category 2 (news/media) | — | 1.71 (0.797) | 2.13 (0.694) | 2.06 (0.696) | 2.41 (0.676) | |
| Category 3 (formal/group) | 3.25 (0.750) | 2.42 (0.663) | 2.81 (0.555) | 3.02 (0.513) | 3.14 (0.463) | |
| Note. Relevance assessed on a scale of 1 (not relevant/do not use) to 4 (very relevant/useful). A dash indicates no data obtained. | ||||||
Discussion
Demographics and Workforce
The greatest number of survey respondents were in the age categories of 45–54 years (f = 153) and 55–64 years (f = 151), and 77% were male. The numbers of male and female survey respondents were identical in the younger age category of 25–34 years, with 98 total respondents. Our study did not specifically address the existence of gender differences relative to perceptions of information source relevance or other measured variables. Future research may involve consideration of whether gender and/or age demographics of the manure nutrient management network affect information transfer and, ultimately, the adoption of practices.
Regarding respondents' selections of the tasks they performed related to manure nutrient management, the variation across organization types relative to types of tasks selected was interesting, but not necessarily surprising. UE respondents chose tasks such as education of students and the agriculture community, research, and targeted group assistance with greater frequency than other respondents did, in line with the land-grant institution missions of extension, research, and teaching. Cumulatively among all survey respondents, education of the general public and agriculture community was the most frequently selected task, followed by individual assistance or consultation. This may indicate a shared feeling of responsibility across organizations for translating information both within the network and beyond.
The concentration on surface water and groundwater as environmental concerns among respondents is reasonable given that manure management is regulated to protect water quality, more so than air quality or soil fertility. Surface water protection is the overarching goal behind the Clean Water Act as it pertains to animal feeding operations (U.S. Environmental Protection Agency [EPA], 2016). Considerations for groundwater protection, soil conservation, and crop nutrient use are typical components of nutrient management planning guidance. Although there are federal and state-based air quality rules, federal air quality rules apply to fewer operations because of size exemptions (e.g., Greenhouse Gas Reporting Rule) (U.S. EPA, 2009b) or emission thresholds (e.g., Emergency Planning and Community Right to Know and Clean Air Act) (U.S. EPA, 2009a). Interestingly, despite concerted research and Extension efforts to improve knowledge and understanding of climate change implications for livestock agriculture, climate change was not highly acknowledged as an environmental concern by respondents in our survey. The top three groups who acknowledged climate change as a concern were UE, GNRA, and P types.
Information Relevance
Given the low variation across organization types regarding relevance of a specific information source, the survey results indicate that different organization types use or rely on the same types of information sources. This finding suggests that information providers could tailor the content of new informational material to the needs of multiple audiences in this field rather than package similar content in different formats. Information and technology transfer does not always need to target the producer directly but can be transferred to the end user through other groups, such as special government entities or sales or private service enterprises (Stahlman & McCann, 2012).
It stands out that the field or farm setting option was the most relevant source of information transfer for manure nutrient management professionals when categorized by both organization type and level of knowledge. This circumstance echoes the producer-audience findings by Riesenberg and Gor (1989), who surveyed 386 farmers in Idaho and found that the farmers perceived on-farm demonstrations and field trips as the most relevant ways to receive information about farming practices; several forms of traditional educational and outreach programming were moderately relevant, whereas reaction to computer-based educational material was varied. For the Pathways survey population, the relevance scores assigned to computer-based approaches varied by type and organization. Science-based sites as an information source had a higher relevance compared to social media. The relevance score for science-based sites was lower for P respondents (2.99) compared to other organization types (3.11–3.27), and the relevance score for social media was higher for UE respondents (2.15) compared to other organization types (1.66–1.95). This finding is supported by recent works by Bates and Arbuckle (2017) and Noy and Jabbour (2017), who focus on the "who" in producer networks, versus the "how" or setting.
The "decision-tools" format as an information source was rated among the least relevant to manure management professionals. Taken as-is, the results suggest that less effort should be placed on developing labor- and time-intensive decision-making products if organizations in the manure nutrient management industry do not view them as highly relevant. A possible reason for the low relevance of decision tools is that many of these tools are fairly complex, require the use of a computer and/or the Internet with sufficient capacity to efficiently run the programs, and often require frequent revisions intended to ensure that the tools continue delivering relevant outputs based on current data. With younger generations entering the workforce, increasing popularity of mobile devices (tablets and smartphones), and development of related applications, it is highly possible that the decision tool could become more widely used and be in higher demand in the future. Of note, relevance of decision-making tools as an information source increases with expertise/level of knowledge of the user. We also recognize that the types of examples used in the description of this category on the survey instrument (and perhaps other information sources listed) may have inadvertently skewed the results.
Although our survey revealed what information sources are valued most among manure nutrient management professionals when seeking information, it did not explore any reasons for relevance scores. Future research should focus on questions such as "Why do respondents value a particular information source?" and should anticipate needs for information or assistance in the future. The results of such research may provide manure management professionals with a vision for how to design future information exchange mechanisms that will achieve desired objectives. Such research would have the power to draw out accurate information and could be facilitated by either focus group discussion or semistructured interviews. The inclusion of the former method would elicit collective views, and use of the latter method would give individual professionals opportunities to express their opinions.
Implications for Complex Networks
The evaluation of the manure nutrient management network has opportunities for translation to other complex networks involving Extension. The survey provides a snapshot in time of the network, but it also provides a baseline for future measurements of demographics, tasks, and learning mechanisms. The survey identified a shared goal of education of the general public and agricultural community. This shared goal is likely present in other networks aiming to optimize agricultural productivity and environmental quality. Identifying shared goals or values is a strong starting point for programming. Finally, recognizing the commonalities and overlap in tasks and information sources is important in periods of reduced Extension workforce and resources. How can Extension contribute to the power of the masses while reducing duplication of effort? For the manure nutrient management network and other complex networks, coordination is both a challenge and an opportunity.
Summary
Results of the online Pathways survey of manure nutrient management professionals led to the following key observations:
- The relative numbers of males and females in the manure nutrient management network are equal in the 25–34 age category, and males are predominant in categories over 35 years of age.
- The education of both the general public and agricultural industry stakeholders is currently a widespread effort among manure nutrient management professionals.
- While producers focus on production, regulatory government agencies focus on their main roles of policy development and regulation enforcement, nonregulatory government agencies focus on individual assistance, and university and Extension personnel try to cover many facets and overlap (bridge) with other organizations.
- The average relevance of information sources is relatively consistent across organization types.
- Technical information sources that are individual-based or group-based are more relevant to all organization types as compared to mass media sources.
- Technical information sources that are individual-based or group-based increase in relevance as self-reported levels of knowledge on the part of the professionals increase.
The Pathways survey captured a snapshot of demographics, activities, and information source use of the vast network of individuals and organizations in the manure nutrient management network. The approach and results have potential to inform programming efforts in other complex networks that include Extension participants.
Acknowledgments
We appreciate the support of the North Central Region Water Network Seed Grant and South Dakota Sustainable Agriculture Research and Education. We give special thanks to the collaborative groups of educators, researchers, and agency personnel for improving and advocating for our survey.
References
Agresti, A., & Finlay, B. (2009). Statistical methods for the social sciences (4th ed.). Upper Saddle River, NJ: Pearson Prentice Hall.
Bates, H., & Arbuckle, J. G. (2017). Understanding predictors of nutrient management practice diversity in Midwestern agriculture. Journal of Extension, 55(6), Article 6FEA5. Available at: https://www.joe.org/joe/2017december/a5.php
Crawford, C., Grossman, J., Warren, S. T., & Cubbage, F. (2015). Grower communication networks: Information sources for organic farmers. Journal of Extension, 53(3), Article 3FEA9. Available at: https://joe.org/joe/2015june/a9.php
Korsching, P. F., IV, & Hoban, T. J. (1990). Relationships between information sources and farmers' conservation perceptions and behavior. Society & Natural Resources, 3(1), 1–10.
Napier, T. L., Thraen, C. S., & Napier, S. M. (1988). Willingness of land operators to participate in government-sponsored soil erosion control programs. Journal of Rural Studies, 4(4), 339–347.
Noy, S., & Jabbour, R. (2017). Using egocentric networks to illustrate information seeking and sharing by alfalfa farmers in Wyoming. Journal of Extension, 55(2), Article 2RIB1. Available at: https://www.joe.org/joe/2017april/rb1.php
Riesenberg, L. E., & Gor, C. O. (1989). Farmers' preferences for methods of receiving information on new or innovative farming practices. Journal of Agricultural Education, 30(3), 7–13.
Sassenrath, G. F., Heilman, P., Lusche, E., Bennett, G. L., Fitzgerald, G., Klesius, P., . . . Zimba, P. V. (2008). Technology, complexity and change in agricultural production systems. Renewable Agriculture and Food Systems, 23(4), 285–295.
Stahlman, M., & McCann, L. M. J. (2012). Technology characteristics, choice architecture, and farmer knowledge: The case of phytase. Agriculture and Human Values, 29(3), 371–379.
Tucker, M., & Napier, T. L. (2002). Preferred sources and channels of soil and water conservation information among farmers in three midwestern US watersheds. Agriculture, Ecosystems & Environment, 92(2–3), 297–313.
U.S. Environmental Protection Agency. (2009a). CERCLA/EPCRA administrative reporting exemption for air releases of hazardous substances from animal waste at farms. Federal Register, 73(244), 76948–76960.
U.S. Environmental Protection Agency. (2009b). Mandatory reporting of greenhouse gases. Federal Register, 74(209), 56337 and 56481.
U.S. Environmental Protection Agency. (2016). Animal feeding operations. Retrieved from https://www.epa.gov/npdes/animal-feeding-operations-afos