June 2018
|
June 2018 // Volume 56 // Number 3 // Feature // v56-3a3


Using Continuous Response Assessment to Evaluate the Effectiveness of Extension Education Products
Abstract
The case study addressed in this article illustrates the value of continuous response measurement (CRM) for testing and refining messages produced for distribution to Extension audiences. We used CRM to evaluate the responses of Extension educators and Natural Resources Conservation Service technical service providers to a video describing greenhouse gas mitigation techniques. By using this assessment method, message producers can identify elements in a video that elicit strong positive or negative responses and then refine communication activities accordingly. Our study highlights the potential of CRM for informing how Extension education products and materials may be preevaluated to ensure more widespread acceptance and use of final versions by intended audiences.
Since 2011, the Animal Agriculture and Climate Change project sponsored by the U.S. Department of Agriculture (USDA) National Institute for Food and Agriculture (NIFA) has encouraged livestock and poultry production practices that are environmentally sound, climatically compatible, and economically viable (Hawkins et al., 2016; Powers et al., 2013; Whitefield et al., 2016). The project's objective is to build capacity among Cooperative Extension educators and technical service providers relating to basic climate science, climate change impacts and adaptation strategies, and mitigation of greenhouse gas (GHG) emissions.
Through the project, several tools for building climate knowledge and competence among Extension educators have been used, including fact sheets, online courses, webinars, professional development workshops, and videos (Powers et al., 2013; Whitefield et al., 2016). Feedback from Extension educators suggests that despite the best intentions to present climate information objectively and in accordance with current scientific understanding, climate change is a contentious issue among agricultural producers. Regardless of the context, how climate information is communicated is critically important, and one-size-fits-all approaches to addressing the subject should be avoided in deference to messages tailored for specific audiences (Moser, 2009; Nisbet, 2010). In the context of agricultural production, messaging regarding climate change and mitigation of GHG emissions should be constructed with input from Extension educators and other stakeholders to ensure message acceptability and effectiveness. However, often absent from this process is formal assessment of communication materials during their development. In short, the oft unanswered question remains: Could these communication materials be refined to better achieve strategic goals?
Continuous Response Measurement as an Assessment Tool
A crucial precursor to the distribution of educational or persuasive communications is formative research designed to inform message development (Atkin & Freimuth, 2013). Careful testing during development could maximize the value of communications by detecting message components that vary in their usefulness or generate dislike among those in the intended audience. Although testing can take many forms, continuous response measurement (CRM) serves as a valuable tool for assessing the changing nature of individual response.
Also known as "dial testing" or "moment-to-moment" evaluation, CRM involves the continuous evaluation of a message or presentation through the use of small handheld dials or other devices that viewers continually turn to rate agreement with some evaluative statement (Biocca, David, & West, 1994). It is analogous to measurement involving a Likert-type response scale, but with CRM a message is evaluated by assessing an individual's response throughout his or her viewing of it. The nature of the evaluation can take many forms and is based on testing context. For example, researchers have used CRM to examine advertising effectiveness by monitoring positive and negative affective responses (Baumgartner, Sujan, & Padgett, 1997). In political communication, the technique has been used to assess positive or negative evaluations of a candidate or a debate (Maurer & Reinemann, 2006; Schill & Kirk, 2014). Furthermore, CRM data can be examined in various ways, including through mere visual inspection of the mean series or formal identification of peaks and troughs (Biocca et al., 1994).
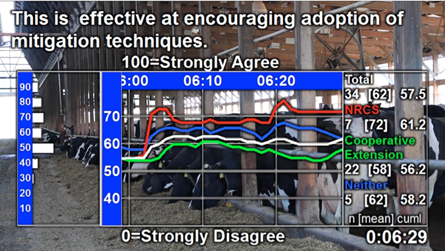
CRM offers two key benefits in the evaluation of messages for Cooperative Extension. First is the ability to isolate specific points in the message that elicit strong responses. With respect to the videos produced through the Animal Agriculture and Climate Change project, a wealth of information is contained within any single video, and posttest evaluations reflect the aggregate summary evaluation of the entirety of a message. In contrast, CRM occurs during viewing and aids message optimization by highlighting specific passages that can be refined on the basis of audience feedback (Maurer & Reinemann, 2009). Second, this tool permits real-time visualization of audience response in the form of a moving line seen by researchers that depicts the variably positive or negative evaluation by participants (see Figure 1 in the "Methods" section). This visualization facilitates rapid assessment of audience response (Baggaley et al., 1992). In addition, it allows researchers to immediately identify message elements during testing to address via posttest qualitative assessments such as in-depth interviews, surveys, or structured group discussion.
Real-Time Evaluation of GHG Mitigation Video
This article demonstrates the feasibility and benefits of using CRM together with focus group and survey methodologies to evaluate the effectiveness of Extension education videos that feature controversial subject matter. As a deliverable of the Animal Agriculture and Climate Change project, the Cattle & Climate Conversations workshop was held October 12–13, 2016, in Denver, Colorado. As part of the workshop, we employed CRM with 34 Extension agents and Natural Resources Conservation Service (NRCS) employees to measure their response while viewing a 30-min video titled "Mitigation of Greenhouse Gases in Animal Agriculture" produced by the project team. The narrated video included global and national data on GHG emissions, charts and graphics depicting GHG contribution from different animal species, interviews with academics and agricultural producers, and footage of on-farm GHG mitigation technologies. The purpose of the evaluation was to identify specific points in the video that generated strong positive and negative responses, identify common themes among those points, and examine the reasons for the responses.
Method
Participants
On average, participants were 40 years old (SD = 12.07), and they ranged from 25 to 69. All were college graduates, with 22.6% having a bachelor's degree and 74.2% having a postgraduate degree. Most participants were male (76.7%), and most identified as active agricultural producers, with 73.3% reporting that they raised livestock and 26.7% reporting that they grew crops. Of the 34 participants, 22 (64.7%) identified as working for Cooperative Extension, seven (20.6%) indicated that they were current NRCS employees, and five (14.7%) reported working in neither category.
CRM Testing
First, we applied CRM to assess evaluations of the video. In this phase, workshop attendees viewed the video while using handheld dials to rate agreement with the statement "This is effective at encouraging adoption of mitigation techniques." Reponses ranged from 0 (strongly disagree) to 100 (strongly agree). We sampled responses once per second. Before showing the video, we explained the procedure and presented output from a past study to encourage active participation.
The video was tested in two segments with a break in the middle, and participants began each segment with their dials at the scale's midpoint (i.e., 50). We monitored response via a separate video display (Figure 1) and noted elements of strong positive or negative response for further exploration in a semistructured focus group discussion.
Figure 1.
Sample Visual Overlay of Dial Response
Focus Group Discussion
Participants next took part in a focus group discussion to provide qualitative feedback. We invited workshop attendees to offer overall thoughts regarding the video and elements they found effective or not useful. Next, segments identified during CRM testing were shown one at a time, and group members discussed why each segment elicited a strong positive or negative response. The discussion lasted approximately 30 min. A moderator took notes, and an audio recording of the discussion was later reviewed for additional analysis.
Posttest Questionnaire
Finally, participants completed a posttest survey we implemented to gather additional open-ended and forced-choice summary evaluations and demographic information. Whereas the CRM measurement focused on a single-item evaluative measure and the group discussion provided qualitative assessment, the survey allowed us to collect individual feedback via a battery of predetermined questions formulated to gather a broader form of assessment.
Results
The CRM testing identified a series of moments in the GHG mitigation video during which workshop attendees indicated strong agreement or disagreement with the statement "This is effective at encouraging adoption of mitigation techniques." We identified these moments during testing via inspection of audience response using the aforementioned visual output (Figure 1). In addition, we formally analyzed response data after testing to further identify peaks and troughs in the video that were alternately highly or least effective. To do this, we calculated the group mean for each second of the video and then converted the series means to standardized or z scores to identify moments where mean audience response was more than 1 standard deviation above or below the standardized mean of 0 (Biocca et al., 1994). Thus, these elements were outliers representing strong points of agreement or disagreement.
This analysis yielded 11 short passages of the video that the audience rated as highly effective and 12 short passages that they rated as least useful. Additional insights from both the focus group discussion and posttest survey responses served to validate and further support findings from the CRM testing.
Finding 1: Preference for Actionable Insights and Real-World Applications
Passages rated as most useful during CRM testing generally fell into two categories: (a) enumerated/bulleted presentation of GHG mitigation techniques or benefits and (b) real-world application of GHG mitigation activities. Presentation of specific, actionable techniques for GHG mitigation comprised the most common type of content that elicited a strong positive response. Figure 2 depicts a series of images from the video that participants rated as highly useful.
Figure 2.
Positive Video Highlights Emphasizing Bulleted, Actionable Suggestions
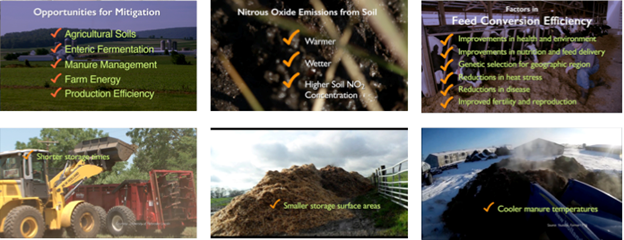
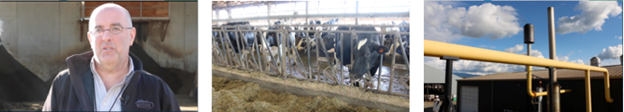
The second type of information that elicited strong positive moment-to-moment response related to real-world applications. Specifically, participants responded positively to a brief passage that depicted on-location footage and interviews with an agricultural producer who had adopted a series of GHG mitigation techniques or technologies (Figure 3).
Figure 3.
Positive Video Highlights Featuring Real-World Applications
These findings were generally supported and expanded through the supplemental focus group discussion and posttest survey. The focus group session began with an initial free-form discussion of likes and dislikes regarding the video and then shifted to cued recall of positive and negative highlights. In both parts of the discussion, workshop attendees stressed the value of highlighting practical benefits for agricultural producers, suggesting, in particular, that emphasis on practical and/or economic benefits was more useful than emphasis on environmental benefits. As one attendee noted, "The strengths are showing that best management can lead to economic benefit. Show that these actions are good for cattle producers." Workshop attendees also pointed out that the portions of the video illustrated by Figure 2 featured actionable suggestions that could be passed along to and adopted by agricultural producers.
These positive critical moments identified through CRM testing were further validated through posttest survey data. In the questionnaire, participants were asked to identify specific passages in the video that they found most convincing. The three attributes mentioned most frequently in their responses were (a) that the video focused on how mitigation practices could lead to economic/efficiency benefit (32.2%); (b) that the video provided facts and data rather than opinions (22.6%); and (c) that farmers/producers provided the testimonials (12.9%).
Finding 2: Preference for Peers as Information Sources
Focus group discussion also revealed consensus that the video should focus less on academics and more on agricultural producers as information sources. CRM responses revealed that participants rated short "talking head" interviews with academics throughout the video as least useful. Workshop attendees suggested that those speakers offered little useful information beyond what was presented through narration.
In contrast, workshop attendees reported strong preference for peer agricultural producers as information sources. For example, the portion of the video that featured a producer discussing adoption of manure treatment technology, shown in Figure 3, generated a strong positive response. Although that response was partially due to the focus on a real-world application, the use of an agricultural producer as an information source was viewed very positively. This perspective was further evidenced in the focus group discussion when one workshop attendee noted, "The overall focus should be more on the producers and not on researchers talking in their offices." Another added, "The best spokespersons are honest, authentic producers."
Posttest survey data likewise supported this finding. Participants were asked to indicate whether a scientist, a farmer/rancher/ag worker, a government USDA employee, or someone in another role would be the best spokesperson for the type of information conveyed in the video. Most (80.6%) of respondents believed that the best source would be a farmer/rancher/ag worker, whereas 12.9% selected scientist. Two respondents wrote in "all three" and "any and all" after selecting "Other." Notably, no respondent selected government USDA employee as a single response.
Finding 3: Dislike of Charts and Graphs Featuring Quantitative Data
Regarding negative responses, CRM data revealed dislike for the presentation of data visualizations and charts. For example, the first two graphics in Figure 4 were taken from the initial 10 min of the video that served as an introduction to the topic, and audio narration accompanying these graphs provided explanation of the material. The third image in Figure 4 described a Food and Agriculture Organization (FAO) study examining emission intensities of livestock production across different species (Gerber et al., 2013). Narration accompanying that third graphic stated, "The same FAO study highlighted dramatic differences in emission intensities per country, with beef ranging from about 15 to 75 kg of CO2 equivalent per 100 kg of live weight."
Figure 4.
Negative Video Highlights Featuring Charts and Data Visualizations
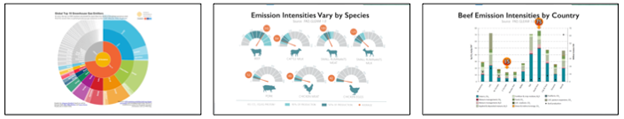
This particular finding illustrates the benefit of pairing CRM testing with additional forms of message evaluation because cued discussion in the focus group session added explanation for the negative responses. One concern with these elements was their global or international focus. Participants found little value in charts and graphs with a diverse, global focus. Instead, they suggested selectively using data that focused on the United States.
Results from the posttest questionnaire further suggested that such data visualizations should be used with caution. When asked to list what parts of the video would be received poorly, the only response category where we found any level of agreement among participants centered on the statistics/tables/data that were presented, with 16.1% of respondents indicating that these would be poorly received.
Finding 4: Need for Greater Tailoring and Alternate Presentation Forms
One key benefit of conducting this type of testing is being able to refine messaging during the development stage prior to distribution, and our study results yielded numerous suggestions beyond those already mentioned. For example, workshop attendees noted that one concern was the length of the video. Rather than a single 30-min presentation, they suggested that content could be distributed in multiple 5-min videos with greater focus on specific topics or types of production. Second, a common suggestion related to greater tailoring of the message to specific types of production (e.g., beef, poultry) or geographic regions. Rather than take a one-size-fits-all approach, video producers could optimize message content and increase benefits by presenting information directly relevant to specific audiences.
The posttest questionnaire also yielded additional insights. The survey included three items aimed at gauging overall opinion of the video where respondents were asked to evaluate the video as "useful," "convincing," and "trustworthy" using a response-option scale of 0 (not at all) to 10 (extremely). Responses were positive overall with "useful" garnering a 7.17 (SD = 1.60), "convincing" a 6.96 (SD = 1.51), and "trustworthy" a 7.48 (SD = 1.63). In terms of distribution, the posttest questionnaire asked participants what they believed would be the best means for sharing information regarding GHG emissions. For this item, respondents commonly selected several options. The most popular distribution technique was "in-person presentations to groups," selected by 61.3% of respondents, followed by "one-on-one presentations to farmers one at a time" (38.7%), "YouTube/Web videos" (19.4%), "website/blog" (9.7%), and "magazine articles" (9.7%).
Discussion
Our study illustrates the benefits of moment-to-moment CRM testing as a tool for assessing audience response to one product of the Animal Agriculture and Climate Change project, a 30-min video focusing on GHG mitigation techniques for agricultural producers. This dial testing was supplemented by additional evaluation through focus group discussion and a posttest survey. The results presented here illustrate passages in the video that were viewed as highly useful for encouraging adoption of techniques as well as those that were less useful.
Communication activities are at the heart of Cooperative Extension (Leeuwis, 2004). Thus, research to understand and refine communication activities and products should be a primary goal of Extension efforts. Although our case study provided useful insight into existing educational content, application of CRM has greater value to Extension educators as a product development tool that could optimize communication efforts. Although the subject matter of our study, climate change, serves as an ideal topic given its polarizing nature (McCright & Dunlap, 2016), there is no limit to the topics that could be addressed through this form of testing. For example, CRM could be used to improve educational television programming concerning agricultural issues (Wagenet et al., 2005), videos designed to train agriculture workers on farm safety (Mathiasen, Morley, Chapman, & Powell, 2012), videos designed to generate young adults' awareness of Extension activities (Loizzo & Lillard, 2015), and more. Rather than rely on intuition when developing materials, Extension professionals should bear in mind theory advocating persuasion through communication that considers salient message and audience variables (Shen & Bigsby, 2012). CRM could then be employed as an assessment of message effectiveness early in the design stage, and insights gained from testing could lead to refinement before final distribution of content. Those conducting future research should consider performing similar testing during production to evaluate the effectiveness of educational content for intended audiences, thereby improving the usefulness of the final product.
Limitations
Although our study illustrates the benefits of CRM testing as a means of identifying specific moments within a message that elicit strong responses, a key limitation of this form of testing is that it generally does not make a claim to statistical generalizability to a broader population. This measurement technique does yield quantitative data suitable for statistical analysis, including the "peaks and troughs" approach reported here. However, generalization of such findings to a broad population requires both random selection of study participants from a larger population as well as a considerably larger sample. Thus, these findings must be interpreted in light of the unique properties of the Extension and NRCS personnel who took part in our study. The combination of CRM along with other qualitative and quantitative techniques makes this a unique hybrid form of research.
A second challenge of the type of testing described here is participant fatigue. This condition could be reflected in diminished response variability as testing progresses, which could make identification of strong positive and negative responses more challenging. However, our testing was conducted in two stages to minimize this threat. Furthermore, active participation was stressed to study participants prior to testing to encourage audience response.
Despite these concerns, our study illustrates the value of CRM as an assessment technique both during and after message development. To our knowledge, this is the first application of this form of testing in the context of Extension education, but it presents a rich opportunity to study perceptions of Extension activities across a variety of topics and contexts, including video content and face-to-face presentations to groups.
Acknowledgments
Funding for this effort was provided by USDA NIFA Competitive Grant No. 2011-67003-30206. Special thanks to the Texas Tech University College of Media & Communication for conducting the CRM activity.
References
Atkin, C. K., & Freimuth, V. S. (2013). Guidelines for formative evaluation research in campaign design. In R. E. Rice & C. K. Atkin (Eds.), Public communication campaigns (4th ed., pp. 53–68). Los Angeles, CA: Sage.
Baggaley, J., Salmon, C., Siska, M., Lewis-Hardy, R., Tambe, P. B., Jorgensen, C., . . . Jason, J. (1992). Automated evaluation of AIDS messages with high-risk, low-literacy audiences. Journal of Educational Television, 18(2–3), 83–95.
Baumgartner, H., Sujan, H., & Padgett, D. (1997). Patterns of affective response to advertisements: The integration of moment-to-moment responses into overall judgments. Journal of Marketing Research, 34, 219–232.
Biocca, F., David, P., & West, M. (1994). Continuous response measurement (CRM): A computerized tool for research on the cognitive processing of communication messages. In A. Lang (Ed.), Measuring psychological responses to the media (pp. 15–64). Hillsdale, NJ: Erlbaum.
Gerber, P. J., Steinfeld, H., Henderson, B., Mottet, A., Opio, C., Dijkman, J., . . . Tempio, G. (2013). Tackling climate change through livestock—A global assessment of emissions and mitigation opportunities. Rome, Italy: Food and Agriculture Organization of the United Nations.
Hawkins, G., Smith, D., Stowell, R., Powers, C., Heemstra, J., Harrison, J., . . . Jacobson, L. (2016, July). Animal agriculture and climate change: Building capacity among Extension educators working with livestock and poultry. Paper presented at the ASABE International Meeting, Orlando, Florida. doi:10.13031/aim.20162458283
Leeuwis, C. (2004). Communication for rural innovation: Rethinking agricultural extension (3rd ed.). Hoboken, NJ: Wiley-Blackwell.
Loizzo, J., & Lillard, P. (2015). In the field: Undergraduate students' awareness of Extension through a blended project-based multimedia production course. Journal of Extension, 53(1), Article 1RIB3. Available at: https://www.joe.org/joe/2015february/rb3.php
Mathiasen, L., Morley, K., Chapman, B., & Powell, D. (2012). Using a training video to improve agricultural workers' knowledge of on-farm food safety. Journal of Extension, 50(1), Article 1FEA6. Available at: https://www.joe.org/joe/2012february/a6.php
Maurer, M., & Reinemann, C. (2006). Learning versus knowing: Effects of misinformation in televised debates. Communication Research, 33, 489–506.
Maurer, M., & Reinemann, C. (2009). RTR measurement in the social sciences: Applications, benefits, and some open questions. In J. Maier, M. Maier, M. Maurer, & C. Reinemann (Eds.), Real-time response measurement in the social sciences: Methodological perspectives and applications (pp. 1–13). New York, NY: Peter Lang Publishing.
McCright, A. M., & Dunlap, R. E. (2016). The politicization of climate change and polarization in the American public's views of global warming, 2001–2010. Sociological Quarterly, 52, 155–194.
Moser, S. C. (2009). Communicating climate change: History, challenges, process and future directions. Wiley Interdisciplinary Reviews: Climate Change, 1, 31–53. doi:10.1002/wcc.11
Nisbet, M. C. (2010). Communicating climate change: Why frames matter for public engagement. Environment: Science and Policy for Sustainable Development, 51, 12–23. doi:10.3200/ENVT.51.2.12-23
Powers, C., Whitefield, L., Smith, D., Schmidt, D., Knox, P., Pronto, J., & Heemstra, J. (2013, July). Animal agriculture in a changing climate—Using new ways of educating Extension educators. Paper presented at ASABE International Meeting, Kansas City, Missouri. doi:10.13031/aim.20131619963
Schill, D., & Kirk, R. (2014). Courting the swing voter: "Real time" insights into the 2008 and 2012 U.S. presidential debates. American Behavioral Scientist, 58, 536–555.
Shen, L., & Bigsby, E. (2012). The effects of message features: Content, structure, and style. In The SAGE handbook of persuasion: Developments in theory and practice (pp. 20–35). Thousand Oaks, CA: SAGE Publications Inc. doi:10.4135/9781452218410.n2
Wagenet, L. P., Lemley, A. T., Grantham, D. G., Harrison, E. Z., Hillman, K., Mathers, K., & Younge, L. H. (2005). Evaluating the effectiveness of public television as a method for watershed education. Journal of Extension, 54(2), Article 2FEA5. Available at: https://joe.org/joe/2005april/a5.php
Whitefield, E., Schmidt, D., Witt-Swanson, L., Smith, D., Pronto, J., Knox, P., & Powers, C. (2016). Animal Agriculture in a Changing Climate online course: An effective tool for creating Extension competency. Journal of Extension, 54(2), Article 2TOT6. Available at: http://joe.org/joe/2016april/tt6.php