December 2018
|
December 2018 // Volume 56 // Number 7 // Research In Brief // v56-7 rb3


What Influences Whether Family Forest Owners Participate in Outreach Campaigns?
Abstract
We used an experimental design to analyze factors affecting participation rates for family forest owner outreach campaigns. Through logistic regression, we assessed the participation rates as a function of campaign and landowner attributes. Participation rates ranged from 3% to 14%. Owners offered a publication were on average 4.3 times more likely to participate than those offered a forester visit. Owners with a college degree were on average 1.5 times more likely to participate than those with lower levels of formal education. Extension and other outreach professionals can use knowledge of these factors to design more effective outreach campaigns.
Introduction
Across the United States, 290 million ac of forestland are owned by an estimated 10.7 million families, individuals, trusts, and estates, collectively referred to as family forest owners (Butler et al., 2016a). This represents 36% of the forestland in the United States. The fate of these family forests lies in the hands of the owners, but most of them are not engaged with the forest conservation community, at least not according to traditional engagement metrics. Of family forest owners with 10+ ac of forestland, only 13% have a written forest management plan and only 20% have received forest management advice (Butler et al., 2016a).
To engage more owners, many conservation-related groups, including Extension professionals, other governmental agencies, and nongovernmental organizations, are reaching out to family forest owners (Downing & Finley, 2005; Kaetzel, Fly, & Hodges, 2010; Magill, McGill, & Fraser, 2004). The outreach methods vary substantially, but the overall goal of "increasing engagement" is very common. Traditional timber management is a common objective of much of this outreach, but the objectives have evolved to address other topics, such as invasive species (Ma, Clarke, & Church, 2018; Steele, McGill, Chandran, Grafton, & Huebner, 2008), nontimber forest products (McLain, 2013), estate planning (Catanzaro, Markowski-Lindsay, Milman, & Kittredge, 2014), and woody biomass harvesting (Joshi, Grebner, Henderson, & Gruchy, 2015). A number of articles attend to the concepts of improving outreach efforts through segmenting (Davis, Asah, & Fly, 2015; Kittredge, 2004; Metcalf, Gruver, Finley, & Luloff, 2016; Starr, McConnell, Bruskotter, & Williams, 2015) and honing messages (Ma, Kittredge, & Catanzaro, 2012; Morris, Megalos, Hubbard, & Boby, 2016; Starr & McConnell, 2014), but most do not explicitly address the mechanisms for communicating the information. Two exceptions are Butler et al. (2016b) and Magill et al. (2004). Butler et al. (2016b) found written materials to be the preferred method. Magill et al. (2004) found that preferred methods varied somewhat by topic, but of the three methods tested—technical aid, workshops, and financial assistance—technical aid was consistently preferred.
Social marketing, sometimes called targeted marketing, techniques are increasingly being used to improve the effectiveness of outreach activities. This type of marketing combines the traditional commercial marketing concepts of product, price, place, and promotion with the additional considerations of publics, partnerships, policies, and purse strings, with the aim of inducing a voluntary change in behavior (Weinreich, 2011). This technique is common in public health fields and has been adapted for forestry (Butler et al., 2007; Snyder & Broderick, 1992).
Building and expanding on the work of Rickenbach et al. (2017), we carried out a study in which we quantified factors affecting participation rates for 10 landowner outreach campaigns conducted by the American Forest Foundation and its partners. We used an experimental design to test campaign attributes combined with landowner attribute data to model participation.
Methods
Data
The data we used were from 10 campaigns conducted across six geographies (Figure 1). (For a list of the American Forest Foundation partners who assisted with implementing the campaigns, see Appendix A.) Although the specifics varied (Table 1), the overall purpose of the campaigns was to increase landowner engagement. For each campaign, landowners were randomly assigned to campaign treatments and contacted via mail. The primary outcome monitored was whether the owner indicated he or she would accept the offer (i.e., participate in the campaign).
Figure 1.
Geographies Targeted by the Outreach Campaigns Analyzed
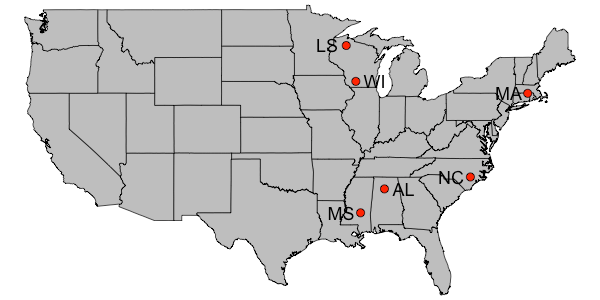
Note: Abbreviations correspond to those used to identify the campaigns in this article.
| Identifier | Geography | Target population | Objective |
| AL | Alabama Cumberland | Family forest owners with 40+ ac of forestland | Increase sustainable forest management with an emphasis on riparian forest improvements, prescribed fire, and shortleaf pine management |
| LS | Wisconsin Lake Superior Basin | Family forest owners with 10+ ac of forestland | Improve water quality and supply, mitigate wildfire risks, and restore wildlife habitat for at-risk species |
| MA | Massachusetts and Connecticut | Family forest owners with 10+ ac of forestland | Increase conservation and sustainable management for the support of a wildlife corridor |
| MS | Mississippi Piney Woods | Family forest owners with 40+ ac of forestland | Conduct sustainable forest management with an emphasis on, but not exclusive to, longleaf pine management |
| NC | North Carolina | Participants in the North Carolina Forest Stewardship Program | Increase membership in the Tree Farm program |
| WI | Wisconsin Driftless Area | Family forest owners with 10+ ac of forestland | Improve landscape health and increase sustainable forest management, including through reestablishing native oak trees |
The information used to model participation is summarized in Table 2, and a full list of variables is available in Appendix B. The offers in the mailings typically included a visit from an expert, a publication, or "multiple" (i.e., recipients were offered a site visit, a publication, or both). Message refers to the feel and tone of the mailings. Appended data varied by campaign but included variables such as size of holdings, participation in forestry programs, demographics, and outdoor/conservation-oriented interests and activities. The appended data came from local partners and commercial marketing data clearinghouses.
| Geography | Campaign | Season and year | Offer(s) | Message(s) | Sources and number of appends | Number of contacts |
| Alabama Cumberland | AL.F15 | Fall 2015 |
|
|
|
4,001 |
| Lake Superior Basin (Wisconsin) | LS.S15 | Spring 2015 |
|
|
|
1,237 |
| Massachusetts and Connecticut | MA.F14 | Fall 2014 |
|
|
|
996 |
| MA.S15 | Spring 2015 |
|
|
|
1,003 | |
| Mississippi Piney Woods | MS.S13 | Spring 2013 |
|
|
|
3,916 |
| MS.F13 | Fall 2013 |
|
|
|
4,786 | |
| North Carolina | NC.F14 | Fall 2014 |
|
|
|
1,758 |
| Wisconsin Driftless Area | WI.S12 | Spring 2012 |
|
|
|
3,422 |
| WI.F12 | Fall 2012 |
|
|
|
2,013 | |
| WI.F13 | Fall 2013 |
|
|
|
2,999 |
Analyses
Through logistic regression models (Hosmer, Lemeshow, & Sturdivant, 2013), we tested the relationships between participation and the campaign attributes and appended data. The participation variables were defined as 1 if the landowner replied that he or she would like to receive the specified offer and 0 otherwise. We used lasso variable selection to avoid model overfitting (Tibshirani, 1996). To avoid multicollinearity, we dropped variables in the reduced models with variance inflation factors over 2.5 (Allison, 1999). We assessed goodness of fit using the le Cessie-van Houwelingen-Copas-Hosmer sum of squares test (Hosmer, Hosmer, le Cessie, & Lemeshow, 1997). All analyses were conducted through use of the R statistical software computing environment (R Development Core Team, 2016).
Results
Participation Rates
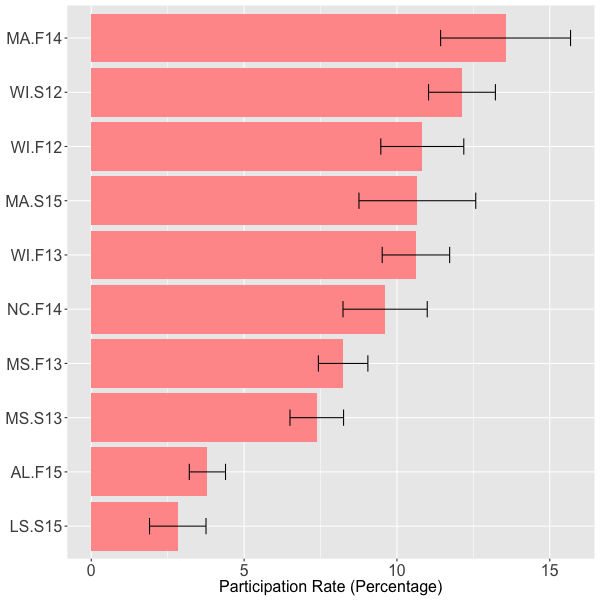
The percentages of landowners contacted who indicated they wanted to participate varied from 3% to 14% (Figure 2). Within a geographic region, the participation rates across campaigns did not vary substantially. For example, the Wisconsin Driftless Area participation rates ranged from 11% to 12%, and the Mississippi rates were 7% and 8%.
Figure 2.
Participation Rates, with 95% Confidence Intervals, by Outreach Campaign
Participation Models
All of the campaigns produced significant models. The lasso technique reduced the number of variables to two to 12 variables per model.
Offer and education level were the most consistently significant variables (p-value < .05) across models (Table 3). Offer was significant in all the models in which it was available; landowners receiving the offer of a publication were 2.5 to 7.9 times more likely to participate. Education was significant in six of the seven models in which it was available; landowners with a college education were 1.5 to 3.4 times more likely to participate. Other variables were less consistent in terms of significance.
| Campaign | Shooting license | Size (log of ac) | ATV owner | Donor to environmental groups | Donor to wildlife groups | Education: College | Income: $100k+ | Receives fishing information | Offer: Publication |
| AL.F15 | 1.54* | — | — | 1.58* | — | ||||
| LS.S15 | - | — | 3.37** | — | |||||
| MA.F14 | — | 1.46*** | — | 1.78* | — | — | |||
| MA.S15 | — | — | — | 2.01* | |||||
| MS.S13 | 1.20** | — | — | — | — | 2.51*** | |||
| MS.F13 | — | — | 1.60** | 1.59*** | 1.03** | 2.47*** | |||
| NC.F14 | — | 4.31*** | 4.58*** | ||||||
| WI.S12 | — | — | 1.45*** | 4.21*** | |||||
| WI.F12 | — | 1.82** | 1.55* | 3.93*** | |||||
| WI.F13 | — | 1.44* | 1.50** | 7.85*** | |||||
|
Note. Only values for significant variables are reported. Dashes indicate variables that were available, but not significant. Blank cells indicate variables that were not available for a specific model. Full results for models are available in Appendix C.
*p < .05. **p < .01. ***p < .001. |
|||||||||
Discussion
As one might expect, the type of service or product offered had the greatest impact on participation rates, but the preferred offer was less intuitive. The offers tested were two commonly used in forestry outreach: publications and site visits. Offering a handbook versus offering a forester or wildlife biologist visit increased the participation rate by an average of 10 percentage points (Figure 3). This circumstance is in spite of the commonly held sentiment that owners want more site visits. The higher participation rates associated with the publications may be related to the lower time commitments required from the owners as compared to the subsequent steps that occur with a site visit. The preference for publications is reinforced by results from the National Woodland Owner Survey (Butler et al., 2016b) (Figure 4).
Figure 3.
Participation Rates, with 95% Confidence Intervals, by Outreach Campaign and Offer
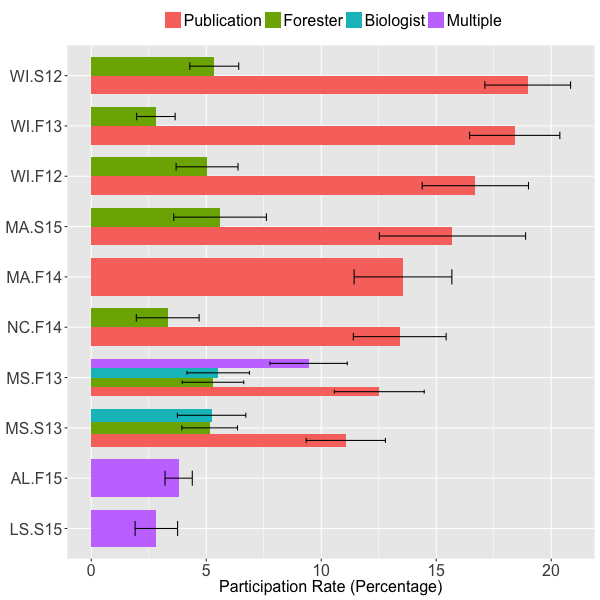
Figure 4.
Percentages of Family Forest Owners (10+ ac) Across the United States by Preferred Methods for Receiving Forest Management Information
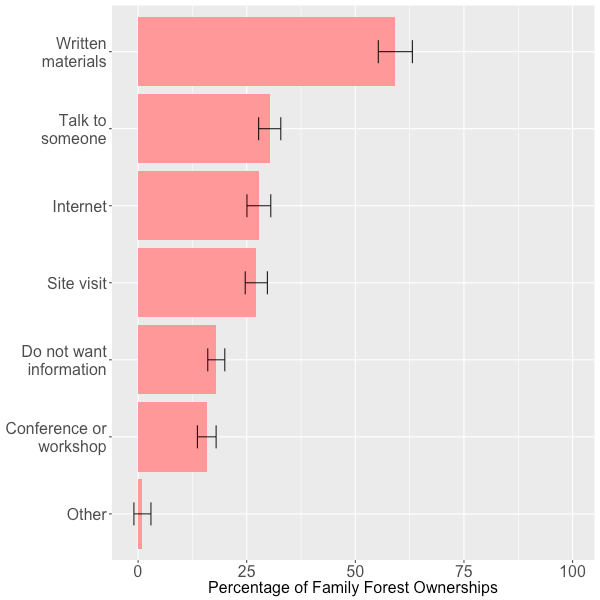
Note: Numbers refer to owners rating a method as very useful or useful on a 5-point Likert scale. Source: Butler et al., 2016b.
The scope of our study was limited to testing campaigns offering publications and site visits, but other options, including social media and other electronic communications, are tools commonly used by many Extension professionals. The efficacies of these additional options, to our knowledge, have not been empirically tested for family forest owners. This circumstance is especially relevant given that resources for Extension programs are diminishing (Sagor, Kueper, Blinn, & Becker, 2014) and many professionals increasingly rely on these other tools. According to results from the National Woodland Owner Survey (Butler et al., 2016b) (Figure 4), traditional written materials are preferred over other resources, including the Internet, but these trends need to be monitored over time as newer generations, who are increasingly comfortable and reliant on electronic communications, become larger proportions of the family forest owner population.
One factor we did not consider in our analysis is the likelihood of the given offer leading to behavioral change, the ultimate goal of most outreach campaigns. Although participation rates for the forester offers were lower, the return on investment could be higher, but this possibility needs to be further investigated. However, in contrast to widely held beliefs, Kilgore et al. (2015) found that participation in educational campaigns may have larger impacts on landowner behaviors than having a management plan or having received cost-share assistance. In addition, publication offers can be seen as a "foot-in-the-door" technique where a modest, low-threshold offer helps build trust and increases the likelihood of later participation in higher threshold, larger offers (Burger, 1999).
Besides type of service or product offered, level of education was the only other variable that was consistently significant across models. Owners with a college degree were on average 1.5 times more likely to participate than owners with lower educational attainment levels. Organizations that are interested in interacting with a broad range of owners may want to consider that educational level may be a barrier for reaching some owners.
There was some evidence that owners who contribute to environmental or wildlife causes were more likely to participate, but the influence of these variables was less consistent, and additional research is needed to confirm or refute this association. It is plausible that owners who are inclined to donate to conservation organizations also are inclined to accept information from them.
The message variable did not have a significant impact on participation rates across the multiple campaigns we studied. In theory, distinct messages should resonate differently with different people (Weinreich, 2011). One reason for message not being significant could be related to how distinct the messages are. For the campaigns addressed here, the primary difference among messages was the pictures used on the materials being delivered.
Although size of holdings is correlated with many landowner behaviors and attitudes, such as timber harvesting (Beach, Pattanayak, Yang, Murray, & Abt, 2005; Silver, Leahy, Weiskittel, Noblet, & Kittredge, 2015), owning for timber or land investment purposes (Butler et al., 2016a), and participation in management activities and programs (Butler et al., 2016a), it was not a consistent indicator of participation in outreach campaigns in our study. This attribute may be of use for targeting owners with larger (or smaller) holdings depending on the goals of the campaign, but it does not appear to be of great help in identifying who will participate.
The participation models presented here do not explain all the differences across the campaigns. The quality of the outreach materials, the timing of the outreach efforts, the number of contacts, and the trustworthiness of the partners are a few of the untested variables that may help further explain differences.
Conclusions
Participation rates for the outreach campaigns we studied ranged from 3% to 14%. Through an experimental design, we showed that offer had the greatest influence on participation rates, followed by education level. More specifically, offering a family forest owner a publication is much more likely to solicit a positive response than offering a site visit from a professional. Publications offer owners opportunities to learn new information at their own rate. The potential that acceptance of publications will lead to future interactions with professional foresters is an important topic for future research.
Education is the only variable other than offer that consistently affected participation rates. The implications for Extension foresters and others for more readily reaching less educated owners should be factored into outreach efforts.
Most of the other appended data were not significantly correlated with participation rates. This result may be because the appended data were not specifically collected for understanding family forest owners or because these broad indicators simply are not great predictors of actual conservation-related behavior.
Our study was made possible by the foresight and commitment of those implementing the campaigns and a willingness to evaluate their efforts and test different approaches. This desire for evidence-based results and continual learning should be encouraged in all outreach projects and could be facilitated by the development of simple tools for participation tracking and automated analyses.
We hope that professionals use the information provided here with insights from other studies and their own experiences to design more efficient and more effective outreach programs.
Acknowledgments
Our research would not have been possible without the commitment of the American Forest Foundation to engage with us to set up our experiments and allow us to analyze and share the results. The American Forest Foundation provided funding for the research, but full editorial rights remained with us. We also are thankful to the partners who implemented the campaigns and the reviewers who provided constructive comments.
References
Allison, P. D. (1999). Logistic regression using the SAS system: Theory and applications. Cary, NC: SAS Institute.
Beach, R. H., Pattanayak, S. K., Yang, J. C., Murray, B. C., & Abt, R. C. (2005). Econometric studies of non-industrial private forest management: A review and synthesis. Forest Policy and Economics, 7(3), 261–281.
Burger, J. M. (1999). The foot-in-the-door compliance procedure: A multiple-process analysis and review. Personality and Social Psychology Review, 3(4), 303–325. https://doi.org/doi:10.1207/s15327957pspr0304_2
Butler, B. J., Hewes, J. H., Dickinson, B. J., Andrejczyk, K., Butler, S. M., & Markowski-Lindsay, M. (2016a). Family forest ownerships of the United States, 2013: Findings from the USDA Forest Service's National Woodland Owner Survey. Journal of Forestry, 114(6), 638–647. http://dx.doi.org/10.5849/jof.15-099
Butler, B. J., Hewes, J. H., Dickinson, B. J., Andrejczyk, K., Butler, S. M., & Markowski-Lindsay, M. (2016b). USDA Forest Service National Woodland Owner Survey: National, regional, and state statistics for family forest and woodland ownerships with 10+ acres, 2011–2013 (No. Res. Bull. NRS-99) (p. 39). Newtown Square, PA: U.S. Department of Agriculture, Forest Service, Northern Research Station. Retrieved from http://dx.doi.org/10.2737/NRS-RB-99
Butler, B. J., Tyrrell, M., Feinberg, G., VanManen, S., Wiseman, L., & Wallinger, S. (2007). Understanding and reaching family forest owners: Lessons from social marketing research. Journal of Forestry, 105(7), 348–357.
Catanzaro, P., Markowski-Lindsay, M., Milman, A., & Kittredge, D. (2014). Assisting family forest owners with conservation-based estate planning: A preliminary analysis. Journal of Extension, 52(2), Article 2FEA9. Available at: http://www.joe.org/joe/2014april/a9.php
Davis, M. L. E. S., Asah, S. T., & Fly, J. M. (2015). Family forest owners & forest management understandings: Identifying opportunities and audiences for effective outreach and education. Forest Science, 61(1), 105–113. https://doi.org/10.5849/forsci.13-014
Downing, A. K., & Finley, J. C. (2005). Private forest landowners: What they want in an educational program. Journal of Extension, 43(1), Article 1RIB4. Available at: http://www.joe.org/joe/2005february/rb4.php
Hosmer, D. W., Hosmer, T., le Cessie, S., & Lemeshow, S. (1997). A comparison of goodness-of-fit tests for the logistic regression model. Statistics in Medicine, 16(9), 965–980. https://doi.org/10.1002/(SICI)1097-0258(19970515)16:9<965::AID-SIM509>3.0.CO;2-O
Hosmer, D. W., Lemeshow, S., & Sturdivant, R. X. (2013). Applied logistic regression. Hoboken, NJ: John Wiley & Sons.
Joshi, O., Grebner, D. L., Henderson, J. E., & Gruchy, S. R. (2015). Landowners, bioenergy, and Extension strategies. Journal of Extension, 53(2), Article 2FEA3. Available at: http://www.joe.org/joe/2015april/a3.php
Kaetzel, B. R., Fly, J. M., & Hodges, D. G. (2010). Non-industrial private forest landowner use of information sources concerning management of their woodland on the Tennessee Northern Cumberland Plateau. Journal of Extension, 48(4), Article 4RIB4. Available at: https://www.joe.org/joe/2010august/rb4.php
Kilgore, M. A., Snyder, S. A., Eryilmaz, D., Markowski-Lindsay, M. A., Butler, B. J., Kittredge, D. B., . . . Andrejczyk, K. (2015). Assessing the relationship between different forms of landowner assistance and family forest owner behaviors and intentions. Journal of Forestry, 113(1), 12–19. https://doi.org/10.5849/jof.13-059
Kittredge, D. B. (2004). Extension/outreach implications for America's family forest owners. Journal of Forestry, 102(7), 15–18.
Ma, Z., Clarke, M., & Church, S. P. (2018). Insights into individual and cooperative invasive plant management on family forestlands. Land Use Policy, 75, 682–693. https://doi.org/10.1016/j.landusepol.2018.02.010
Ma, Z., Kittredge, D. B., & Catanzaro, P. (2012). Challenging the traditional forestry extension model: Insights from the Woods Forum Program in Massachusetts. Small-Scale Forestry, 11(1), 87–100. https://doi.org/10.1007/s11842-011-9170-2
Magill, D. J., McGill, D. W., & Fraser, R. F. (2004). Refining outreach to woodland owners in West Virginia—Preferred topics and assistance methods. Journal of Extension, 42(4), Article 4RIB5. Available at: https://www.joe.org/joe/2004august/rb5.php
McLain, R. J. (2013). Characteristics of non-industrial private forest owners interested in managing their land for nontimber forest products. Journal of Extension, 51(5), Article 5RIB6. Available at: https://www.joe.org/joe/2013october/rb6.php
Metcalf, A. L., Gruver, J. B., Finley, J. C., & Luloff, A. E. (2016). Segmentation to focus outreach: Behavioral intentions of private forest landowners in Pennsylvania. Journal of Forestry, 114(4), 466–473. https://doi.org/10.5849/jof.15-030
Morris, H. L. C., Megalos, M. A., Hubbard, W. G., & Boby, L. A. (2016). Climate change attitudes of southern forestry professionals: Outreach implications. Journal of Forestry, 114(5), 532–540. https://doi.org/10.5849/jof.14-148
R Development Core Team. (2016). R: A language and environment for statistical computing. Vienna, Austria: R Foundation for Statistical Computing. Retrieved from http://www.R-project.org
Rickenbach, M., Greenberg, J., Huffaker, B., Knoot, T., Koshollek, A., Nielsen, C., . . . Swenson, S. (2017). Using social marketing to engage Extension audiences: Lessons from an effort targeting woodland owners. Journal of Extension, 55(3), Article 3FEA2. Available at: https://www.joe.org/joe/2017june/a2.php
Sagor, E. S., Kueper, A. M., Blinn, C. R., & Becker, D. R. (2014). Extension forestry in the United States: A national review of state-level programs. Journal of Forestry, 112(1), 15–22. https://doi.org/10.5849/jof.13-007
Silver, E. J., Leahy, J. E., Weiskittel, A. R., Noblet, C. L., & Kittredge, D. B. (2015). An evidence-based review of timber harvesting behavior among private woodland owners. Journal of Forestry, 113(5), 490–499.
Snyder, L. B., & Broderick, S. H. (1992). Communicating with woodland owners. Journal of Forestry, 90(3), 33–37.
Starr, S. E., & McConnell, T. E. (2014). Changes in Ohio tree farmers' forest management strategies and outreach needs. Forest Science, 60(4), 811–816. https://doi.org/10.5849/forsci.13-718
Starr, S. E., McConnell, T. E., Bruskotter, J. S., & Williams, R. A. (2015). Typology of Ohio, USA, tree farmers based upon forestry outreach needs. Environmental Management, 55(2), 308–320. https://doi.org/10.1007/s00267-014-0382-z
Steele, J., McGill, D. W., Chandran, R. S., Grafton, W. N., & Huebner, A. E. (2008). Landowner characteristics associated with receiving information about invasive plants and implications for outreach providers. Journal of Extension, 46(6), Article 6FEA7. Available at: https://www.joe.org/joe/2008december/a7.php
Tibshirani, R. (1996). Regression shrinkage and selection via the lasso. Journal of the Royal Statistical Society, Series B (Methodological), 58(1), 267–288.
Weinreich, N. K. (2011). Hands-on social marketing: A step-by-step guide to designing change for good (2nd ed.). Los Angeles, CA: Sage.
Appendix A
Outreach Campaign Partners
- Alabama A&M and Auburn University Extension
- Alabama Department of Conservation and Natural Resources
- Alabama Forestry Association
- Alabama Forestry Commission
- Alabama Invasive Plant Council
- Alabama Treasured Forests Association
- Aldo Leopold Foundation
- American Forest Foundation
- Auburn University School of Forestry and Wildlife Sciences
- International Paper
- Kickapoo Woods Cooperative
- `Kü-lē Region Forestry Inc.
- MassConn Sustainable Forest Partnership
- Mississippi Forestry Association
- Mississippi Forestry Commission
- My Lake Superior Northwoods
- National Fish and Wildlife Foundation
- National Wild Turkey Federation
- Nature Conservancy
- New England Forestry Foundation
- North Carolina Tree Farm Program
- Oregon Department of Forestry
- Oregon Forest Resources Institute
- Oregon State University Extension Service
- Pheasants Forever
- Ruffed Grouse Society
- Southwest Badger Resource Conservation and Development District
- Trout Unlimited
- University of Wisconsin Extension
- University of Wisconsin Madison
- U.S. Department of Agriculture Forest Service
- U.S. Department of Agriculture Natural Resources Conservation Service
- U.S. Fish and Wildlife Service
- Wallowa Resources
- Walnut Council
- Wisconsin Bird Conservation Initiative
- Wisconsin Department of Natural Resources
Appendix B
Variables Appended to One or More Campaigns Analyzed
| Category | Variable | AL.F15 | LS.S15 | MA.F14 | MA.S15 | MS.S13 | MS.F13 | NC.F14 | WI.S12 | WI.F12 | WI.F13 | |
| Activity | ATV owner | X | X | |||||||||
| Activity | Big game hunting | X | X | |||||||||
| Activity | Boat owner | X | X | X | ||||||||
| Activity | Boating | X | X | X | X | |||||||
| Activity | Camping | X | X | X | X | X | ||||||
| Activity | Fishing | X | X | X | X | X | ||||||
| Activity | Hunting | X | X | X | X | X | ||||||
| Activity | Shooting | X | X | X | ||||||||
| Activity | Skiing | X | X | X | X | X | ||||||
| Campaign | Message | X | X | X | X | X | X | X | X | X | ||
| Campaign | Offer | X | X | X | X | X | X | |||||
| Demographics | Age | X | X | X | ||||||||
| Demographics | Education | X | X | X | X | X | X | X | ||||
| Demographics | Gender | X | X | |||||||||
| Demographics | Income | X | X | X | X | X | X | |||||
| Demographics | Married | X | X | X | X | X | X | X | ||||
| Donor | Environmental | X | X | X | X | X | X | |||||
| Donor | Wildlife | X | X | X | X | X | ||||||
| Forestry | Program participation | X | X | X | X | X | X | |||||
| General | County | X | X | |||||||||
| Information | Birds | X | X | |||||||||
| Information | Fishing | X | X | |||||||||
| Information | Hunting | X | X | |||||||||
| Information | State conservation magazine | X | X | |||||||||
| Information | Wildlife | X | X | |||||||||
| Interest | Birds | X | X | X | X | X | X | X | ||||
| Interest | Boating | X | ||||||||||
| Interest | Camping | X | X | X | ||||||||
| Interest | Fishing | X | X | X | X | |||||||
| Interest | Hunting | X | X | X | X | |||||||
| Interest | Outdoors | X | ||||||||||
| Interest | Photography | X | X | X | X | X | X | |||||
| Interest | Wildlife | X | X | |||||||||
| Land | All land | X | X | X | X | X | ||||||
| Land | ear=all style='page-break-before:always'> orestland | X | X | X | X | X | X | X | X | |||
| License | Deer | X | X | X | X | X | ||||||
| License | Deer (archery) | X | X | X | ||||||||
| License | Deer (gun) | X | X | X | ||||||||
| License | Doe | |||||||||||
| License | Fishing | X | X | X | X | X | X | X | X | |||
| License | Fishing (nonresident) | X | X | X | ||||||||
| License | Fishing (other) | X | X | X | ||||||||
| License | Hunting | X | X | |||||||||
| License | Other hunting | X | X | X | ||||||||
| License | Patrons | X | X | X | ||||||||
| License | Shooting | X | X | X | ||||||||
| License | Small game | X | X | X | ||||||||
| License | Sportsman | X | X | X | ||||||||
| License | Turkey | X | X | X | ||||||||
| Registration | ATV | X | X | X | ||||||||
| Registration | Snowmobile | X | X | X | ||||||||
Appendix C
Outreach Campaign Logistic Regression Model Summaries
Alabama – Fall 2015 (AL.F15)
glm(formula = RESPONSE ~ EDU + LICENSE_SHOOTING, family = "binomial", data = AL.F15)
| Min | 1Q | Median | 3Q | Max |
| -0.3810 | -0.3056 | -0.2470 | -0.2470 | 2.6477 |
| Estimate | Std. Error | z value | Pr(>|z|) | ||
| (Intercept) | -3.4746 | 0.1146 | -30.327 | <2e-16 | *** |
| EDU1 | 0.4545 | 0.1769 | 2.569 | 0.0102 | * |
| LICENSE_SHOOTING1 | 0.4337 | 0.1799 | 2.411 | 0.0159 | * |
Signif. codes: 0 '***' 0.001 '**' 0.01 '*' 0.05 '.' 0.1 ' ' 1
Residual deviance: 1280.5 on 3998 degrees of freedom
AIC: 1286.5
Sum of squares: 145.796 p-value: 0.291
Lake Superior Basin – Spring 2015 (LS.S15)
glm(formula = RESPONSE ~ ACRES_LOG + INCOME + EDUCATION_HIGHER + INTEREST_BIRDS + INTEREST_CAMPING, family = "binomial", data = LS.S15)
| Min | 1Q | Median | 3Q | Max |
| -0.5916 | -0.2638 | -0.1804 | -0.1369 | 3.1838 |
| Estimate | Std. Error | z value | Pr(>|z|) | ||
| (Intercept) | -6.511712 | 1.112741 | -5.852 | 4.86e-09 | *** |
| ACRES_LOG | 0.341513 | 0.226218 | 1.510 | 0.13113 | |
| INCOME | 0.006906 | 0.005410 | 1.277 | 0.20177 | |
| EDUCATION_HIGHER1 | 1.215152 | 0.465109 | 2.613 | 0.00899 | ** |
| INTEREST_BIRDS1 | 0.617252 | 0.719183 | 0.858 | 0.39074 | |
| INTEREST_CAMPING1 | 0.282568 | 0.634817 | 0.445 | 0.65623 |
Signif. codes: 0 '***' 0.001 '**' 0.01 '*' 0.05 '.' 0.1 ' ' 1
Residual deviance: 219.06 on 994 degrees of freedom
AIC: 231.06
Sum of squares: 23.899 p-value: 0.669
Massachusetts – Fall 2014 (MA.F14)
glm(formula = RESPONSE ~ ACRES_LOG + MESSAGE + DONOR_WILDLIFE + INFO_WILDLIFE + INFO_BIRDS + INTEREST_CAMPING + SPORT_CAMPING + SPORT_SKIING, family = "binomial", data = MA.F14)
| Min | 1Q | Median | 3Q | Max |
| -1.1726 | -0.5887 | -0.4806 | -0.3921 | 2.3478 |
| Estimate | Std. Error | z value | Pr(>|z|) | ||
| (Intercept) | -3.6056 | 0.4537 | -7.948 | 1.9e-15 | *** |
| ACRES_LOG | 0.3816 | 0.1146 | 3.329 | 0.000871 | *** |
| MESSAGEWP | 0.3545 | 0.2104 | 1.685 | 0.091933 | . |
| DONOR_WILDLIFE1 | 0.5752 | 0.2652 | 2.169 | 0.030103 | * |
| INFO_WILDLIFE1 | 0.5032 | 0.3126 | 1.610 | 0.107486 | |
| INFO_BIRDS1 | 0.1444 | 0.3629 | 0.398 | 0.690709 | |
| INTEREST_CAMPING1 | 0.3137 | 0.3890 | 0.806 | 0.420033 | |
| SPORT_CAMPING1 | 0.1474 | 0.3209 | 0.459 | 0.646121 | |
| SPORT_SKIING1 | 0.2348 | 0.3503 | 0.670 | 0.502636 |
Signif. codes: 0 '***' 0.001 '**' 0.01 '*' 0.05 '.' 0.1 ' ' 1
Residual deviance: 609.10 on 749 degrees of freedom
AIC: 627.1
Sum of squares: 92.551 p-value: 0.424
Massachusetts – Spring 2015 (MA.S15)
glm(formula = RESPONSE ~ ACRES_LOG + INFO_FISHING + HOBBY_BIRDS, family = "binomial", data = MA.S15)
| Min | 1Q | Median | 3Q | Max |
| -0.8822 | -0.4936 | -0.4423 | -0.4126 | 2.2569 |
| Estimate | Std. Error | z value | Pr(>|z|) | ||
| (Intercept) | -2.9325 | 0.4566 | -6.422 | 1.34e-10 | *** |
| ACRES_LOG | 0.2022 | 0.1241 | 1.630 | 0.1032 | |
| INFO_FISHING1 | 0.6997 | 0.3453 | 2.026 | 0.0427 | * |
| HOBBY_BIRDS1 | 0.3685 | 0.3079 | 1.197 | 0.2313 |
Signif. codes: 0 '***' 0.001 '**' 0.01 '*' 0.05 '.' 0.1 ' ' 1
Residual deviance: 525.28 on 767 degrees of freedom
AIC: 533.28
Sum of squares: 74.547 p-value: 0.737
Mississippi – Spring 2013 (MS.S13)
glm(formula = RESPONSE ~ TIMBER_ACRES_LOG + INCOME + OFFER + EDU + SPORTS_CAMPING + SPORTS_FISHING + DONOR_WILDLIFE + HUNT_LICENSE_DEER + HUNT_LICENSE, family = "binomial", data = MS.S13)
| Min | 1Q | Median | 3Q | Max |
| -1.0090 | -0.4198 | -0.3295 | -0.2697 | 2.6799 |
| Estimate | Std. Error | z value | Pr(>|z|) | ||
| (Intercept) | -4.12672 | 0.32779 | -12.590 | < 2e-16 | *** |
| TIMBER_ACRES_LOG | 0.17981 | 0.06799 | 2.645 | 0.00818 | ** |
| INCOME | 0.02553 | 0.01420 | 1.798 | 0.07222 | . |
| OFFERForester | 0.01887 | 0.20939 | 0.090 | 0.92819 | |
| OFFERPublication | 0.91941 | 0.18655 | 4.929 | 8.28e-07 | *** |
| EDU1 | 0.30398 | 0.15864 | 1.916 | 0.05535 | . |
| SPORTS_CAMPING1 | 0.26827 | 0.19594 | 1.369 | 0.17096 | |
| SPORTS_FISHING1 | 0.06049 | 0.15488 | 0.391 | 0.69614 | |
| DONOR_WILDLIFE1 | 0.21225 | 0.19192 | 1.106 | 0.26876 | |
| HUNT_LICENSE_DEER1 | 0.23881 | 0.38864 | 0.614 | 0.53889 | |
| HUNT_LICENSE1 | 0.28337 | 0.19487 | 1.454 | 0.14590 |
Signif. codes: 0 '***' 0.001 '**' 0.01 '*' 0.05 '.' 0.1 ' ' 1
Residual deviance: 1644.6 on 3373 degrees of freedom
AIC: 1666.6
Sum of squares: 215.687 p-value: 0.544
Mississippi – Fall 2013 (MS.F13)
glm(formula = RESPONSE ~ TIMBER_ACRES_LOG + INCOME + MESSAGE + OFFER + ATV + SPORTS_CAMPING + SPORTS_SKIING + EDU + DONOR_WILDLIFE + STATE_CONS_MAG + HOBBY_BIRDS + HUNT_LICENSE_DEER, family = "binomial", data = MS.F13)
| Estimate | Std. Error | z value | Pr(>|z|) | ||
| (Intercept) | -4.01421 | 0.34844 | -11.520 | < 2e-16 | *** |
| TIMBER_ACRES_LOG | 0.12410 | 0.06366 | 1.949 | 0.051237 | . |
| INCOME | 0.03004 | 0.01115 | 2.695 | 0.007047 | ** |
| MESSAGEG | 0.18338 | 0.13663 | 1.342 | 0.179535 | |
| MESSAGEW | 0.04639 | 0.14058 | 0.330 | 0.741428 | |
| OFFERForester | -0.16638 | 0.19487 | -0.854 | 0.393216 | |
| OFFERMultiple | 0.54489 | 0.16912 | 3.222 | 0.001274 | ** |
| OFFERPublication | 0.90566 | 0.16343 | 5.542 | 2.99e-08 | *** |
| ATV1 | 1.45999 | 0.34381 | 4.246 | 2.17e-05 | *** |
| SPORTS_CAMPING1 | 0.24769 | 0.16496 | 1.502 | 0.133210 | |
| SPORTS_SKIING1 | 0.51938 | 0.28473 | 1.824 | 0.068132 | . |
| EDU1 | 0.46138 | 0.12651 | 3.647 | 0.000265 | *** |
| DONOR_WILDLIFE1 | 0.46837 | 0.15490 | 3.024 | 0.002498 | ** |
| STATE_CONS_MAG1 | 0.11431 | 0.22077 | 0.518 | 0.604610 | |
| HOBBY_BIRDS1 | 0.22773 | 0.16881 | 1.349 | 0.177319 | |
| HUNT_LICENSE_DEER1 | 0.31683 | 0.36882 | 0.859 | 0.390320 |
Signif. codes: 0 '***' 0.001 '**' 0.01 '*' 0.05 '.' 0.1 ' ' 1
Residual deviance: 2354.8 on 4387 degrees of freedom
AIC: 2386.8
Sum of squares: 317.706 p-value: 0.117
North Carolina – Fall 2014 (NC.F14)
glm(formula = MODEL, family = "binomial", data = NC.F14)
| Min | 1Q | Median | 3Q | Max |
| -0.6033 | -0.5393 | -0.4879 | -0.2567 | 2.6491 |
| Estimate | Std. Error | z value | Pr(>|z|) | ||
| (Intercept) | -2.86003 | 0.39529 | -7.235 | 4.65e-13 | *** |
| OFFERPublication | 1.52116 | 0.23460 | 6.484 | 8.92e-11 | *** |
| TOTAL_ACRES_LOG | -0.11835 | 0.07772 | -1.523 | 0.128 |
Signif. codes: 0 '***' 0.001 '**' 0.01 '*' 0.05 '.' 0.1 ' ' 1
Residual deviance: 1054.7 on 1755 degrees of freedom
AIC: 1060.7
Sum of squares: 148.354 p-value: 0.617
Wisconsin – Spring 2012 (WI.S12)
glm(formula = RESPONSE ~ OFFER + EDU + CONTRIB_ENV, family = "binomial", data = WI.S12)
| Min | 1Q | Median | 3Q | Max |
| -0.7764 | -0.5992 | -0.3625 | -0.3022 | 2.4937 |
| Estimate | Std. Error | z value | Pr(>|z|) | ||
| (Intercept) | -3.0636 | 0.1199 | -25.558 | < 2e-16 | *** |
| OFFERPublication | 1.4372 | 0.1244 | 11.550 | < 2e-16 | *** |
| EDU1 | 0.3742 | 0.1103 | 3.392 | 0.000693 | *** |
| CONTRIB_ENV1 | 0.2075 | 0.1309 | 1.585 | 0.112871 |
Signif. codes: 0 '***' 0.001 '**' 0.01 '*' 0.05 '.' 0.1 ' ' 1
Residual deviance: 2350.7 on 3413 degrees of freedom
AIC: 2358.7
Sum of squares: 346.333 p-value: 0.246
Wisconsin – Fall 2012 (WI.F12)
glm(formula = RESPONSE ~ MESSAGE + OFFER + EDU + CONTRIB_ENV + LICENSE_SPORTSMAN + LICENSE_FISHING_RESIDENT, family = "binomial", data = WI.F12)
| Estimate | Std. Error | z value | Pr(>|z|) | ||
| (Intercept) | -3.21865 | 0.19153 | -16.805 | < 2e-16 | *** |
| MESSAGEGENE | 0.20155 | 0.17929 | 1.124 | 0.26094 | |
| MESSAGEWILD | -0.02308 | 0.18637 | -0.124 | 0.90145 | |
| OFFERPublication | 1.36832 | 0.16989 | 8.054 | 8.01e-16 | *** |
| EDU1 | 0.44129 | 0.17264 | 2.556 | 0.01058 | * |
| CONTRIB_ENV1 | 0.59720 | 0.18869 | 3.165 | 0.00155 | ** |
| LICENSE_SPORTSMAN1 | 1.34639 | 0.70247 | 1.917 | 0.05528 | . |
| LICENSE_FISHING_RESIDENT1 | 0.44033 | 0.37945 | 1.160 | 0.24587 |
Signif. codes: 0 '***' 0.001 '**' 0.01 '*' 0.05 '.' 0.1 ' ' 1
Residual deviance: 1247.6 on 1917 degrees of freedom
AIC: 1263.6
Sum of squares: 180.376 p-value: 0.901
Wisconsin – Fall 2013 (WI.F13)
glm(formula = RESPONSE ~ OFFER + EDU + CONTRIB_ENV + LICENSE_SMALLGAME + LICENSE_FISHING_RESIDENT + CE_LHI_BIRDS, family = "binomial", data = WI.F13)
| Min | 1Q | Median | 3Q | Max |
| -1.1117 | -0.5860 | -0.2648 | -0.2172 | 2.7419 |
| Estimate | Std. Error | z value | Pr(>|z|) | ||
| (Intercept) | -3.7354 | 0.1673 | -22.331 | < 2e-16 | *** |
| OFFERPublication | 2.0606 | 0.1726 | 11.939 | < 2e-16 | *** |
| EDU1 | 0.4024 | 0.1435 | 2.803 | 0.00506 | ** |
| CONTRIB_ENV1 | 0.3628 | 0.1644 | 2.207 | 0.02735 | * |
| LICENSE_SMALLGAME1 | 0.4032 | 0.7406 | 0.544 | 0.58614 | |
| LICENSE_FISHING_RESIDENT1 | 0.3500 | 0.3322 | 1.054 | 0.29204 | |
| CE_LHI_BIRDS1 | 0.2649 | 0.2173 | 1.219 | 0.22293 |
Signif. codes: 0 '***' 0.001 '**' 0.01 '*' 0.05 '.' 0.1 ' ' 1
Residual deviance: 1745.7 on 2884 degrees of freedom
AIC: 1759.7
Sum of squares: 256.355 p-value: 0.535