April 2018
|
April 2018 // Volume 56 // Number 2 // Research In Brief // v56-2rb7


Producers' Opinions on What Makes Demonstrations Effective
Abstract
Despite the widespread and long-standing use of demonstration sites in Extension, there is little empirical evidence to inform how best to design them. We report data from 513 producers in three regions of Indiana whom we surveyed about sources of information for farm management decisions, the usefulness of demonstrations, and preferences and factors that influence their attendance at demonstrations. In general, respondents had positive opinions about demonstration events and high levels of agreement regarding their usefulness. Lack of awareness of demonstrations was the greatest single factor leading to nonattendance. We provide recommendations for organizing demonstration events based on the preferences of producers we surveyed.
Introduction
Demonstration projects have long been a cornerstone of Extension programming efforts. The use of demonstration projects began with Seaman A. Knapp, a special agent with the U.S. Department of Agriculture often referred to as the "Father of Extension" (Hancock, 1992; Rasmussen, 1989; Texas A&M University, n.d.). In 1903, Knapp established the first demonstration project on the Porter farm in Texas (Texas A&M University, n.d.). Later, he led an effort to establish demonstration plots on over 7,000 cotton farms in the South to expand adoption of techniques to improve weevil control (Hancock, 1992).Today, site-based demonstrations are still used to bring about desired changes in how food and fiber are produced (Dickey, Shelton, & Jasa, 1991; Glen, Moore, Jayaratne, & Bradley, 2014; Harmon & Jones, 1997).
The purpose of a demonstration project is to influence not only a cooperating producer's decisions on how his or her farm is planned and managed but also decisions by other producers in the community who see the demonstration and communicate with the cooperator (Kittrell, 1974). The use of demonstrations is also compatible with how producers learn, but the information presented should be relevant and include financial costs and benefits (Franz, Piercy, Donaldson, Richard, & Westbrook, 2010). Demonstration events also offer opportunities for producers to have personal contact with other producers, natural resources advisors, and technical experts. Personal contact is an effective and preferred strategy for communicating management advice that results in adoption of desirable practices (Licht & Martin, 2007; West, Fly, Blahna, & Carpenter, 1988).
Several factors contribute to the success of demonstrations (i.e., the rate of adoption), including characteristics of the practices demonstrated, the demonstrators, the audience, and the community (Bailey, 1964). However, the organization and delivery of demonstration events may also be important in determining their success. Some published reports present considerations for aspects of planning and conducting field and demonstration tours, including planning timelines, program delivery, plot delivery, and evaluation (Boleman & Dromgoole, 2007; Hancock, 1992; Hawkins & Southard, 2001; Maddy, Gerber, & Hillger, 2015). Although demonstrations have the potential to facilitate adoption of desired practices by producers (Singh, MacGowan, Ulrich-Schad, Dunn, & Prokopy, in press), we found little published literature providing empirical evidence to inform how best to organize and carry out those demonstrations. We surveyed producers in three areas of Indiana to elicit information about their use of demonstrations and other information sources and their preferences and opinions related to demonstrations in general and local cover crop field days and demonstrations organized by Purdue Extension and soil and water conservation districts in 2014. Herein, we present the results from the survey, which we used to develop recommendations for future demonstration field days targeted toward producers.
Methods
Between July and October 2015, we mailed a questionnaire to (a) a random sample of landowners who received federal payments and (b) all agricultural producers who attended local field days and demonstration events. After obtaining contact information by making a Freedom of Information Act request through the Farm Services Agency and using mailing lists from county Extension offices, we used a modified five-wave tailored design method (Dillman, Smyth, & Christian, 2014) for the survey. In total, 2,417 producers received the questionnaire: 856 producers in the Delaware County area, 677 in the Jasper County area, and 884 in the Ripley County area.
With the first part of the survey instrument, we asked producers about the types of information sources they use for farm management decisions, the extent to which they use field days and demonstration sites, and characteristics of field days and demonstrations that may influence their attendance. With the second part of the instrument, we posed questions about several local field days/tours of demonstration sites that had occurred in the regions we surveyed (see Table 1). These demonstration events were held during summer and fall 2014 and addressed cover crop varieties and values, the relationship between cover crops and nitrogen production, and/or cover crop management. Demonstration field days also featured soil pit tours that involved agricultural producers' going to different farms in a county. On these tours, producers could see how soil structure can be improved due to factors that accompany the use of cover crops and conservation tillage practices (e.g., root penetration, organic matter, and earthworm activity). Although we do not have the attendance totals from individual events, we estimate on the basis of our mailing list that approximately 25 to 40 producers attended each event. We asked producers whether they attended one of these local events (name, date, time, topics addressed); if they did not attend, why they did not attend; and if they did attend, their opinions about the event.
| Title and location | Date | Topic |
| Southeast Purdue Ag Center Field Day, Butlerville, IN | Jul 1 | Cover crops and comparison of soil pits (tillage vs. no-till) |
| "As the Worm Turns—A Soil Health Saga" Field Day, Greensburg, IN | Aug 25 | Benefits of no-till and cover crop systems |
| Davis Purdue Ag Center Field Day, Farmland, IN | Aug 28 | Plot walk and information on cover crop use and termination |
| Riggin Barn Cover Crop and Nutrient Management Meeting, Muncie, IN | Sept 4 | Cover crop demonstration plot on site with various cover crop species |
| Agronomy Field Day, Agronomy Center for Research and Education, West Lafayette, IN | Sept 5 | Mix of demonstrations—soil health and cover crops, management of nitrogen and other nutrients |
| Cover Crop and Soil Dig Tour, various locations in Jasper, Newton, and Lake Counties, IN | Nov 13, 14, & 18 | Yield increases and rooting depths |
Results
Of the 2,225 landowners who could participate in the survey, 745 (33.5%) returned the questionnaire. We report data from 513 producers who indicated that they actively make farm decisions. In total, respondents owned 200,906 ac (M = 446.5 ac) and rented 174,319 ac (M = 678.0 ac) of farmland (Table 2). They also owned 23,085 ac (M = 45.0 ac) of woodlands (Table 2). Respondents were mostly (86%) male and were aged 23 to 93 years (M = 61.5, SD = 12.7). Only 4% were under the age of 35. Over half (56.2%) attended at least some college; 3.8% did not have a high school diploma or equivalent.
| Number of producers by crop/land use | |||||||
| Number of farmland acres (owned or rented) | Corn | Soybean | Small grains | Canning crops | Clover/alfalfa | Pasture | Wooded land |
| <50 ac | 59 | 54 | 43 | 6 | 113 | 131 | 244 |
| 50–99 ac | 49 | 48 | 19 | 0 | 16 | 36 | 69 |
| 100–499 ac | 161 | 174 | 11 | 1 | 5 | 15 | 46 |
| 500–999 ac | 68 | 70 | 0 | 0 | 3 | 1 | 5 |
| 1,000–4,999 ac | 33 | 32 | 0 | 0 | 0 | 0 | 3 |
| ≥5,000 ac | 0 | 1 | 0 | 0 | 0 | 0 | 0 |
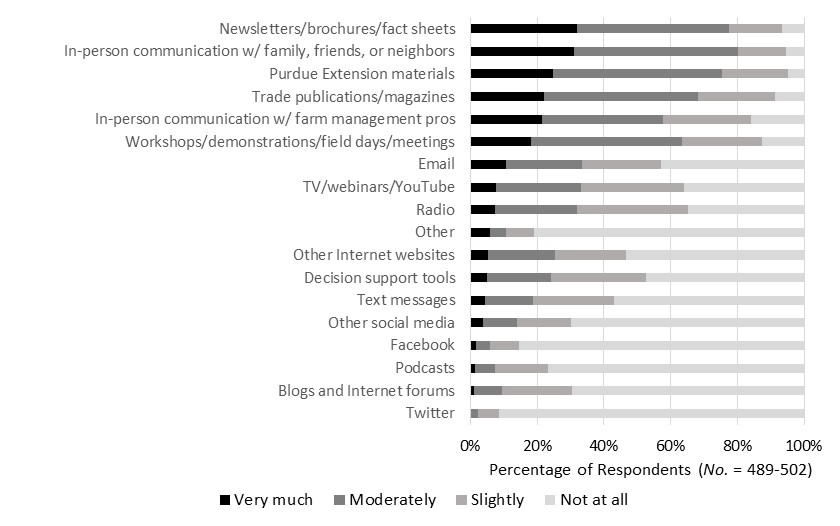
Demonstrations are one of many potential types of information sources producers may use to inform their farm management decisions. With regard to use of and preference for information sources, respondents rated the options "in-person communication with family, friends, or neighbors" and "newsletters/brochures/fact sheets" highest among several types of sources (Figures 1 and 2). Over half of the respondents used sources from the category "workshops/demonstrations/field days/meetings" often or sometimes. We listed "Purdue Extension materials" separate from other sources of information because we were interested in producers' use of and preference for those materials relative to others. Although "Purdue Extension materials" ranked high in both use and preference, that category was not mutually exclusive of other information sources. Types of telecommunication, such as radio, TV, webinars, online videos (YouTube), and text messages as well as decision support tools (e.g., Climate FieldView, N-Rate Calculator) were rarely used for farm management decisions. Respondents also indicated less use of or preference for social media (Facebook, Twitter), podcasts, and blogs and Internet forums.
Figure 1.
Frequency of Use of Information Source Types for Farm Management Decisions
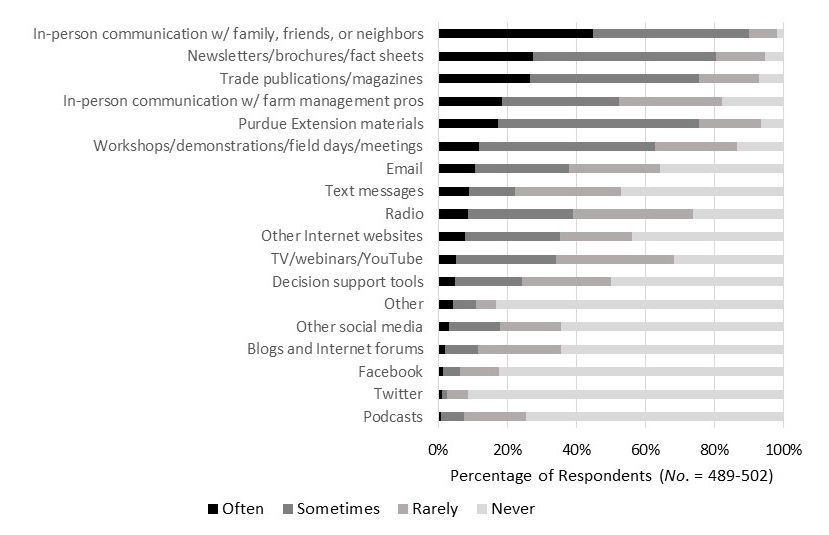
Figure 2.
Preferences for Information Sources for Farm Management Decisions
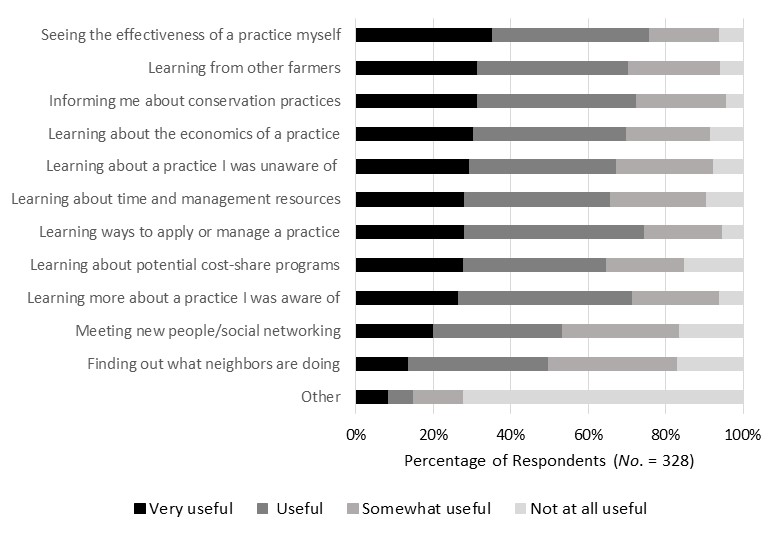
One hundred forty-five respondents, or just over one fourth, had never attended any field day or demonstration on agricultural conservation practices. Most respondents who had attended such demonstrations indicated that they were useful to some extent due to a variety of factors (Figure 3). Demonstrations were more useful to producers for learning about unfamiliar conservation practices, how to apply such practices, and their associated costs/benefits than for factors not directly associated with demonstrating the results of the practices (e.g., social networking, cost-share opportunities).
Figure 3.
Usefulness of Demonstration Sites and Field Days Addressing Agricultural Conservation Practices
A producer's decision to attend demonstrations may be affected by logistics of attendance or organization of the demonstration. The maximum distance respondents considered to be convenient for attending a field day or demonstration event varied widely (Table 3). About half (51%) were willing to travel at least 40 mi. The vast majority of respondents (84%) preferred field days or demonstration events to last a half day or less (Table 4). Respondents expressed the highest degrees of preference for demonstration events held during the morning and for those held in the middle of the week (Figure 4). About three fourths of respondents indicated a preference for the number of practices demonstrated at a given event. Of this group, 94% preferred events at which multiple practices were demonstrated. Just over 40% had no preference regarding group size for a demonstration event. However, about half preferred group sizes between 10 and 50, 6% preferred small groups (<10 people), and 3% preferred larger groups (>50 people).
| Distance (mi) | Frequency | Percentage of respondents |
| 0 to 19 | 22 | 5 |
| 20 to 29 | 114 | 25 |
| 30 to 39 | 81 | 18 |
| 40 to 49 | 52 | 11 |
| 50 to 59 | 100 | 22 |
| 60 to 100 | 81 | 18 |
| More than 100 | 12 | 3 |
| Duration | Frequency | Percentage of respondents |
| Less than 1 hr | 16 | 3 |
| Between 1 and 3 hr | 193 | 40 |
| Half day | 193 | 40 |
| Full day | 31 | 7 |
| Several days | 1 | 0 |
| No preference | 44 | 9 |
Figure 4.
Preferred Times of Day and Days of Week for Field Days or Demonstrations

Note: Bar labels indicate the number of responses for each answer. Respondents could select multiple choices for time and day.
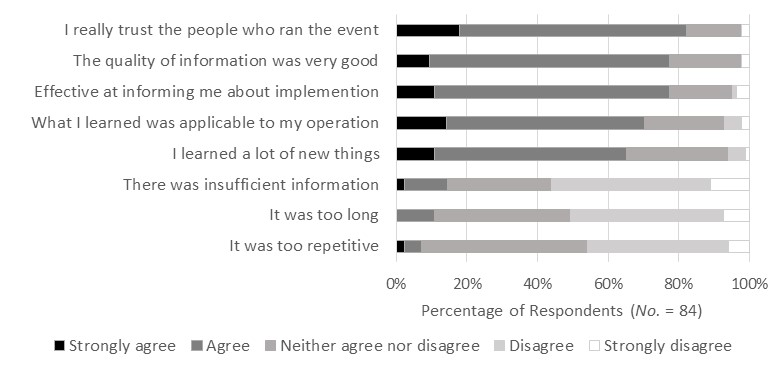
Most respondents (89%) had not attended any of the six cover crop demonstrations listed in Table 1. Almost half of this group (46%) indicated that they never heard or saw information about any of the events (Figure 5). Lack of available time and scheduling conflicts were also important reasons for nonattendance. Specifically, 30% did not have time to attend, and 26% indicated that an event was at a bad time for them. The 84 respondents who did attend at least one of the cover crop demonstrations generally had positive opinions regarding what they learned and of the event itself (Figure 6). Over 80% agreed that they trusted the people who ran the event. Approximately three out of four thought that the event was effective at informing them about implementation of cover crops and that the quality of information was very good. However, respondents were relatively indecisive regarding the appropriateness of the event's length or the repetition of information provided.
Figure 5.
Reasons Producers Did Not Attend Cover Crop Demonstration Events
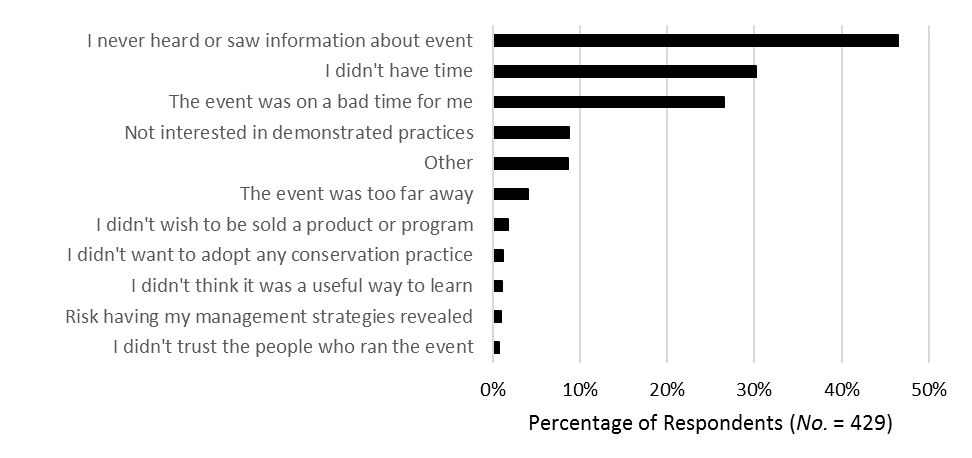
Figure 6.
Producer Opinions About Cover Crop Demonstrations They Attended
Discussion and Applications
For over 100 years, Extension has used demonstrations as a means of communicating a variety of land management practices to producers. Whereas some published reports promote the use of demonstrations and provide guidelines for developing effective demonstrations (Hancock, 1992; Maddy et al., 2015), our work adds additional insights into their use based on empirical data collected from the target audience. In general, respondents had positive opinions about the demonstration events and high levels of agreement regarding their usefulness.
Producers we surveyed used a variety of information sources, and no single source was clearly more preferred over others (see Figures 1 and 2). Demonstration events were comparable in use and preference to other top information sources. As in other studies (Bardon, Hazel, & Miller, 2007; Radhakrishna, Nelson, Franklin, & Kessler, 2003; Schnitkey, Batte, Jones, & Botomogno, 1992), producers in our study clearly preferred and used more traditional information sources, including printed media and in-person communication. Given that only 4% of our respondents were under the age of 35, we were unable to determine how the use and preferences of more nontraditional sources may differ for younger producers.
One could argue that the reason demonstration events received high marks is that we were engaging an already predisposed audience. That is, people who attended did so because they already held a favorable view of demonstration events and were interested in cover crops. Even so, this possibility does not discount that demonstration events are an effective means of reaching producers about cover crops or other conservation practices. For the six cover crop demonstrations in our study, Singh et al. (in press) found an association between attendance and adoption of conservation practices. Elements of demonstrations that are potential mechanisms for influencing adoption of a practice include locally tailored information, decision criteria for managing risks associated with implementation, and recommendations on effectively implementing the practice (Singh et al., in press).
Improved advertisement holds the most potential for increasing attendance at local demonstrations. The most common reason producers did not attend one of the cover crop demonstrations was that they never saw information about the event. Practitioners should also consider the design of demonstrations, and particularly the timing of an event. Guidelines based on expressed information use and preferences of producers surveyed include
- selecting practices of interest;
- demonstrating multiple practices at a single event;
- advertising in adjacent counties in addition to in the host county;
- holding events in the middle of the week, for 2 to 4 hr in the morning; and
- keeping group sizes to 10–50 producers, or 10–25 if possible.
We caution that these guidelines are part of a broader picture of how to organize a demonstration event. Following them does not guarantee success. In addition to the logistical arrangements, the host of the demonstration event is an important factor. Eighty-two percent of the producers we surveyed agreed or strongly agreed that they trusted the people who ran the events they attended. Producers' trust in an information source is associated with the influence that source has on farm management decisions (Singh et al., in press). Those organizing and facilitating demonstrations should also include partners who are trusted by the targeted community or are seen as legitimate and credible sources of information, such as certified crop advisors (Prokopy et al., 2015). Overall, by attending to producer input, Extension personnel can build on the organization's tradition of demonstration to align contemporary events with the needs and preferences of today's producers.
Acknowledgments
This project was funded by the Purdue University Agricultural Science and Education for Economic Development grant program and the Department of Forestry and Natural Resources at Purdue University. We thank Natural Resource Social Science lab personnel for feedback on and support of the survey. This research was approved by the Purdue University Human Research Protection Program, IRB protocol #15060160175.
References
Bailey, W. C. (1964). Result demonstrations and education. Journal of Extension, 2(1). Available at: https://joe.org/joe/1964spring/1964-1-a3.pdf
Bardon, R., Hazel, D., & Miller, K. (2007). Preferred information delivery methods of North Carolina forest landowners. Journal of Extension, 49(6), Article 5FEA3. Available at: https://www.joe.org/joe/2007october/a3.php
Boleman, C., & Dromgoole, D. A. (2007). Result demonstration: A method that works. Texas Cooperative Extension Publication, E-449. Retrieved from http://hdl.handle.net/1969.1/87475
Dickey, E. C., Shelton, D. P., & Jasa, P. J. (1991). Enhancing soil conservation practice adoption with targeted educational programs. Biological Systems Engineering: Papers and Publications, Paper 251.
Dillman, D. A., Smyth, J. D., & Christian, L. M. (2014). Internet, phone, mail, and mixed-mode surveys: The tailored design method. Hoboken, NJ: John Wiley & Sons.
Franz, N., Piercy, F., Donaldson, J., Richard, R., & Westbrook, J. (2010). How producers learn: Implications for agricultural educators. Journal of Rural Social Sciences, 25(1), 37–59.
Glen, C. D., Moore, G. E., Jayaratne, K. S. U., & Bradley, L. K. (2014). Use of demonstration gardens in Extension: Challenges and benefits. Journal of Extension, 52(4), Article 4FEA6. Available at: http://www.joe.org/joe/2014august/a6.php
Hancock, J. (1992). Extension education: Conducting effective agricultural demonstrations. University of Kentucky Cooperative Extension Service Publication, ID-111.
Harmon, A. H., & Jones, S. B. (1997). Forestry demonstration: What good is a walk in the woods? Journal of Extension, 35(1), Article 1RIB3. Available at: http://www.joe.org/joe/1997february/rb3.php
Hawkins, S. E., & Southard, B. (2001). Field tours—An old tool that can still work. Journal of Extension, 39(1), Article 1TOT4. Available at: https://joe.org/joe/2001february/tt4.php
Kittrell, B. U. (1974). Result demonstration technique—History, philosophy, and contemporary nature. Journal of Agronomic Education, 3, 90–94.
Licht, M. A. R., & Martin, R. A. (2007). Communication channel preferences of corn and soybean producers. Journal of Extension, 45(6), Article 6RIB2. Available at: http://www.joe.org/joe/2007december/rb2.php
Maddy, B., Gerber, C. K., & Hillger, D. (2015). Planning and conducting field demonstration tours. Journal of Extension, 53(5), Article 5TOT10. Available at: https://joe.org/joe/2015october/tt10.php
Prokopy, L. S., Carlton, J. S., Arbuckle, J. G. Jr., Haigh, T., Lemos, M. C., Masse, A. S., . . . Power, R. (2015). Extension's role in disseminating information about climate change to agricultural stakeholders in the United States. Climatic Change, 130, 261–272.
Radhakrishna, R., Nelson, L., Franklin, R., & Kessler, G. (2003). Information sources and Extension delivery methods used by private longleaf pine landowners. Journal of Extension, 41(4), Article 4RIB3. Available at: http://www.joe.org/joe/2003august/rb3.shtml
Rasmussen, W. D. (1989). Taking the university to the people: Seventy-five years of Cooperative Extension. Ames, IA: Iowa State University Press.
Schnitkey, G., Batte, M., Jones, E., & Botomogno, J. (1992). Information preferences of Ohio commercial producers: Implications for Extension. American Journal of Agricultural Economics, 74(2), 486–496.
Singh, A. S., MacGowan, B. J., Ulrich-Schad, J. D., Dunn, M., & Prokopy, L. S. (in press). Do demonstration sites and field days influence decisions to adopt conservation practices? Journal of Soil and Water Conservation.
Texas A&M University. (n.d.). 1896–1950 Show me how: The demonstration concept and the birth of Cooperative Extension. Retrieved from http://agrilifecdn.tamu.edu/wp-content/uploads/1896-1905.pdf
West, P. C., Fly, J. M., Blahna, D. J., & Carpenter, E. M. (1988). The communication and diffusion of NIPF management strategies. Northern Journal of Applied Forestry, 5, 265–270.