October 2017
|
October 2017 // Volume 55 // Number 5 // Tools of the Trade // v55-5tt5


Maximizing Use of an Extension Beef Cattle Data Set: Part 3—Weights and Growth
Abstract
Previously, we described calving distribution and reproductive rates from CHAPS20Y, an Extension beef cattle data set. In this article, we describe CHAPS20Y data on birth weight, weaning weight, pounds weaned per cow exposed, calf age at weaning/weighing, average daily gain, weight per day age, frame score, and cow age, weight, and condition. Yearly mean weights and growth are consistent over the 20-year period, with variation among herds. Breed, management, and environmental differences may explain some of the variation. Our analysis of the CHAPS20Y data provides Extension professionals with expanded knowledge of beef cattle weights and growth and, accordingly, improved ability to help producers more effectively manage their herds.
Introduction
We used data from Cow Herd Appraisal Performance Software (CHAPS) to create CHAPS20Y, a 20-year data set spanning from 1994 through 2013, as an Extension tool for understanding trends in beef production (Ramsay, Hulsman Hanna, & Ringwall, 2016). In Parts 1 and 2 of this series, we described CHAPS20Y calving distribution and reproductive rate data (Ramsay, Hulsman Hanna, & Ringwall, 2017a, 2017b). In this article, we describe data related to
- birth weight;
- weaning weight (actual and adjusted);
- calf age at weaning/weighing (days), hereafter referred to as calf age;
- average daily gain (ADG);
- weight per day age (WDA);
- pounds weaned per cow exposed to bull(s), hereafter referred to as pounds weaned;
- frame score;
- cow age (years);
- cow weight; and
- cow condition.
Knowledge gained from examining CHAPS20Y weight and growth data will allow Extension professionals to help producers set and achieve herd management goals. Herein, we present yearly means, 20-year averages, and linear trends over time.
Describing Weight and Growth Data
Weight and Growth Calculations
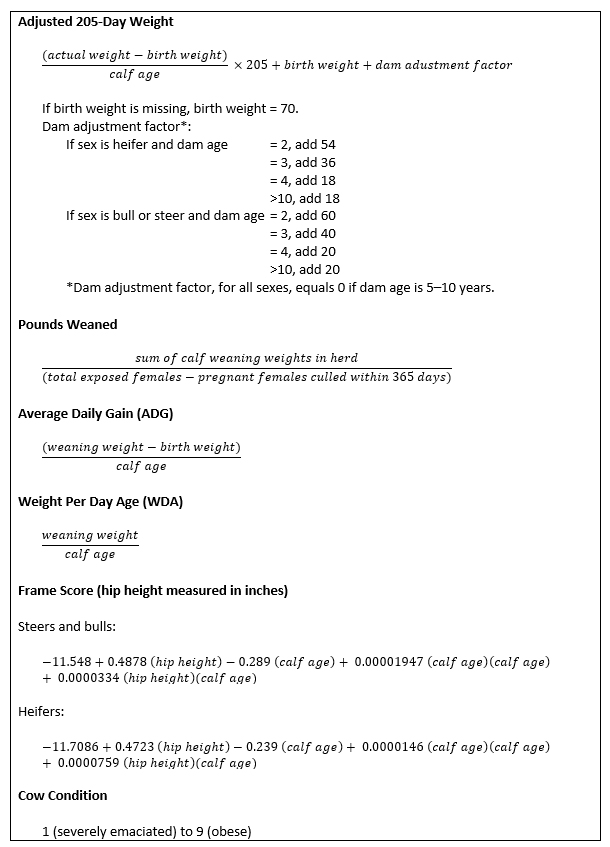
The CHAPS program calculates values for weight and growth variables according to Beef Improvement Federation (2010) guidelines and recommendations put forth by Ringwall and Berg (1990). Those variables and the applicable calculations are shown in Figure 1.
Figure 1.
Calculations for Weight and Growth Variables
Calf Weights
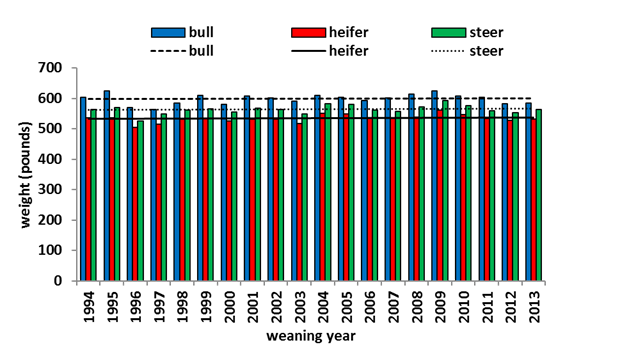
Figures 2–4 show CHAPS20Y birth and weaning weight data. Yearly mean birth weights ranged from 81 to 90 lb, with a 20-year average of 86 lb. Yearly mean actual weaning weights ranged from 518 to 580 lb, with a 20-year average of 551 lb. Adjusted 205-day weights ranged from 580 to 646 lb, with a 20-year average of 621 lb. Pounds weaned ranged from 453 to 512 lb, with a 20-year average of 490 lb. Bull weaning weights ranged from 564 to 624 lb, with a 20-year average of 598 lb. Heifer weights ranged from 504 to 560 lb, with a 20-year average of 533 lb. And, finally, steer weights ranged from 525 to 593 lb, with a 20-year average of 563 lb.
Figure 2.
Yearly Mean Birth Weights with 20-Year Average Trend Line
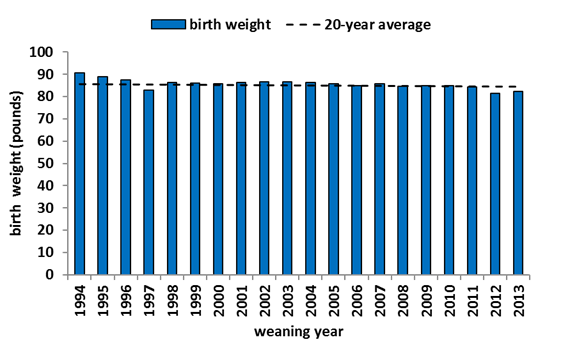
Figure 3.
Yearly Mean Actual and Adjusted 205-Day Weaning Weights and
Pounds Weaned per Cow Exposed (Pounds Weaned)
with 20-Year Average Trend Lines
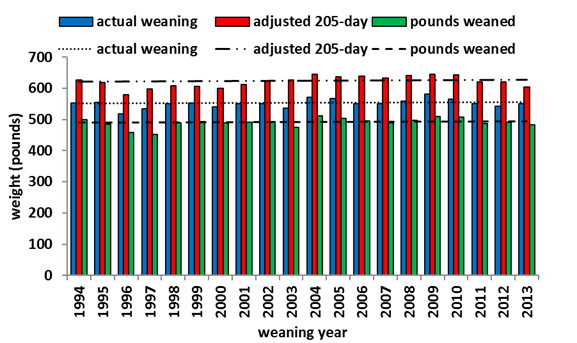
Figure 4.
Yearly Mean Bull, Heifer, and Steer Weaning Weights with 20-Year Average Trend Lines
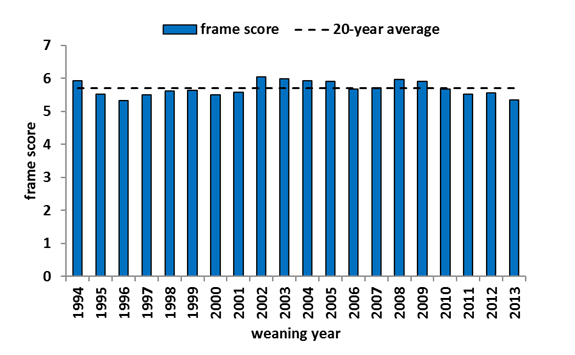
Calf Age and Growth
Data related to calf age and growth are shown in Figures 5–7. Yearly mean calf ages ranged from 182 to 198 days, with a 20-year average of 191 days. Yearly mean ADGs ranged from 2.3 to 2.6 lb, with a 20-year average of 2.5 lb, and WDAs ranged from 2.7 to 3.0 lb, with a 20-year average of 2.9 lb. Frame scores ranged from 5.3 to 6.1, with a 20-year average of 5.7.
Figure 5.
Yearly Mean Calf Ages at Weaning/Weighing with 20-Year Average Trend Line
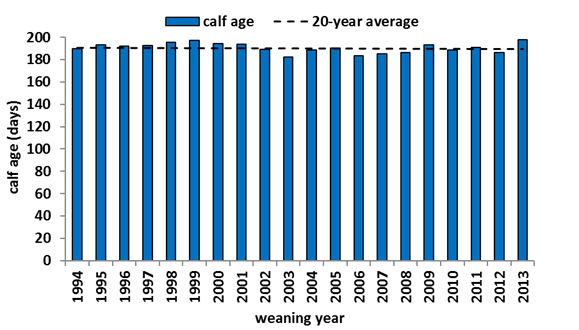
Figure 6.
Yearly Mean Average Daily Gains (ADGs) and Weights per Day Age (WDAs) with 20-Year Average Trend Lines
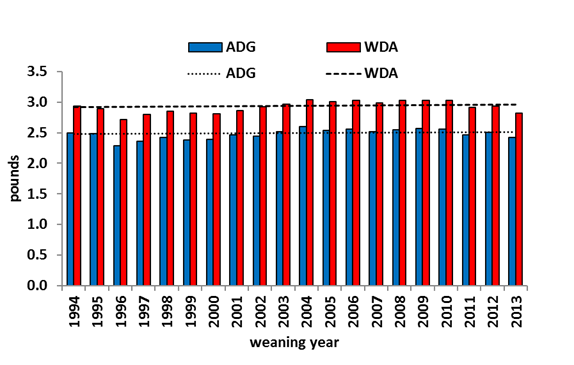
Figure 7.
Yearly Mean Frame Scores with 20-Year Average Trend Line
Cow Age, Weight, and Condition
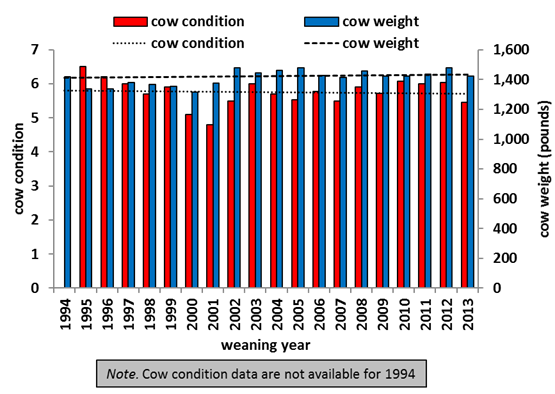
Figures 8 and 9 show data for cow age, weight, and condition. Yearly mean cow ages ranged from 5.3 to 5.8 years, with a 20-year average of 5.6 years. Yearly mean cow weights ranged from 1,315 to 1,479 lb, with a 20-year average of 1,412 lb, and cow conditions ranged from 4.8 to 6.5, with a 20-year average of 5.8.
Figure 8.
Yearly Mean Cow Ages (Years) with 20-Year Average Trend Line
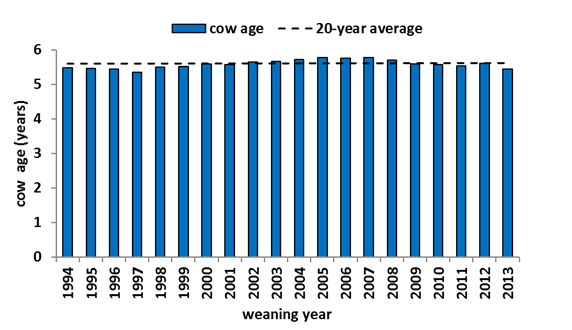
Figure 9.
Yearly Mean Cow Conditions and Weights with 20-Year Average Trend Lines
Variation in Herd Numbers
Not all producers providing data for CHAPS measure birth weights, bull and steer weights, frame scores, and cow weights and condition scores. Table 1 shows numbers of herds for which these weight and growth data were available as compared to the numbers of herds for which other types of data, discussed here and in Parts 1 and 2 of this series, were available.
| Year | Birth weight | Bull weight | Steer weight | Frame score | Cow weight | Cow condition score | Other data |
| 1994 | 22 | 7 | 31 | 10 | 1 | 0 | 33 |
| 1995 | 24 | 8 | 38 | 10 | 3 | 1 | 39 |
| 1996 | 27 | 8 | 41 | 12 | 3 | 1 | 43 |
| 1997 | 34 | 12 | 44 | 14 | 4 | 1 | 49 |
| 1998 | 34 | 12 | 46 | 12 | 4 | 1 | 51 |
| 1999 | 34 | 14 | 52 | 13 | 3 | 1 | 54 |
| 2000 | 39 | 15 | 52 | 12 | 6 | 1 | 56 |
| 2001 | 36 | 16 | 54 | 14 | 7 | 3 | 59 |
| 2002 | 38 | 15 | 56 | 12 | 5 | 2 | 59 |
| 2003 | 40 | 13 | 61 | 13 | 3 | 1 | 64 |
| 2004 | 45 | 16 | 62 | 11 | 7 | 3 | 65 |
| 2005 | 49 | 20 | 64 | 10 | 6 | 3 | 70 |
| 2006 | 49 | 21 | 61 | 9 | 7 | 4 | 65 |
| 2007 | 48 | 18 | 62 | 8 | 7 | 3 | 68 |
| 2008 | 49 | 16 | 60 | 11 | 7 | 4 | 66 |
| 2009 | 40 | 13 | 56 | 9 | 7 | 4 | 62 |
| 2010 | 38 | 12 | 54 | 8 | 6 | 4 | 58 |
| 2011 | 37 | 14 | 51 | 9 | 5 | 3 | 56 |
| 2012 | 30 | 14 | 45 | 7 | 5 | 3 | 49 |
| 2013 | 25 | 11 | 36 | 5 | 3 | 2 | 40 |
Yearly Minimums and Maximums
To demonstrate herd-to-herd variation in the CHAPS20Y data set, we present yearly herd minimums and maximums for birth weight (Table 2), weaning weight and pounds weaned (Table 3), bull, steer, and heifer weight (Table 4), calf age, ADG, and WDA (Table 5), frame score (Table 6), and cow age, weight, and condition (Table 7).
| Year | Birth weight | |
| Min. | Max. | |
| 1994 | 78 | 100 |
| 1995 | 77 | 102 |
| 1996 | 75 | 101 |
| 1997 | 70 | 97 |
| 1998 | 75 | 99 |
| 1999 | 75 | 97 |
| 2000 | 76 | 96 |
| 2001 | 76 | 96 |
| 2002 | 77 | 96 |
| 2003 | 75 | 99 |
| 2004 | 75 | 100 |
| 2005 | 68 | 98 |
| 2006 | 65 | 98 |
| 2007 | 70 | 97 |
| 2008 | 70 | 97 |
| 2009 | 71 | 99 |
| 2010 | 71 | 99 |
| 2011 | 68 | 98 |
| 2012 | 64 | 92 |
| 2013 | 73 | 91 |
| Year | Actual weaning weight | Adjusted 205-day weight | Pounds weaned per cow exposed | |||
| Min. | Max. | Min. | Max. | Min. | Max. | |
| 1994 | 431 | 674 | 526 | 730 | 384 | 613 |
| 1995 | 414 | 721 | 541 | 696 | 336 | 641 |
| 1996 | 397 | 690 | 485 | 658 | 305 | 605 |
| 1997 | 390 | 755 | 441 | 681 | 283 | 647 |
| 1998 | 448 | 680 | 455 | 701 | 345 | 652 |
| 1999 | 427 | 685 | 456 | 694 | 364 | 625 |
| 2000 | 418 | 658 | 448 | 681 | 317 | 629 |
| 2001 | 449 | 654 | 466 | 691 | 362 | 588 |
| 2002 | 420 | 689 | 488 | 707 | 374 | 656 |
| 2003 | 433 | 652 | 492 | 743 | 356 | 625 |
| 2004 | 416 | 740 | 511 | 737 | 360 | 663 |
| 2005 | 483 | 675 | 500 | 726 | 285 | 618 |
| 2006 | 424 | 710 | 515 | 741 | 380 | 666 |
| 2007 | 435 | 708 | 502 | 754 | 364 | 647 |
| 2008 | 419 | 687 | 499 | 795 | 363 | 630 |
| 2009 | 453 | 777 | 488 | 749 | 338 | 720 |
| 2010 | 440 | 726 | 511 | 730 | 349 | 666 |
| 2011 | 453 | 673 | 516 | 718 | 313 | 618 |
| 2012 | 424 | 649 | 516 | 743 | 368 | 602 |
| 2013 | 463 | 668 | 502 | 712 | 320 | 642 |
| Year | Bull weight | Steer weight | Heifer weight | |||
| Min. | Max. | Min. | Max. | Min. | Max. | |
| 1994 | 454 | 713 | 419 | 698 | 423 | 649 |
| 1995 | 573 | 711 | 431 | 737 | 395 | 706 |
| 1996 | 532 | 639 | 401 | 737 | 390 | 650 |
| 1997 | 404 | 654 | 410 | 787 | 372 | 716 |
| 1998 | 455 | 697 | 305 | 699 | 420 | 664 |
| 1999 | 454 | 708 | 439 | 680 | 413 | 708 |
| 2000 | 456 | 673 | 431 | 687 | 407 | 633 |
| 2001 | 493 | 688 | 457 | 692 | 436 | 622 |
| 2002 | 435 | 686 | 449 | 709 | 404 | 669 |
| 2003 | 400 | 683 | 445 | 686 | 420 | 618 |
| 2004 | 431 | 710 | 419 | 767 | 413 | 693 |
| 2005 | 444 | 718 | 459 | 703 | 465 | 649 |
| 2006 | 425 | 744 | 423 | 727 | 408 | 687 |
| 2007 | 507 | 694 | 448 | 733 | 411 | 681 |
| 2008 | 526 | 752 | 433 | 723 | 400 | 655 |
| 2009 | 537 | 689 | 470 | 798 | 451 | 752 |
| 2010 | 485 | 690 | 430 | 765 | 423 | 688 |
| 2011 | 533 | 691 | 421 | 682 | 445 | 662 |
| 2012 | 439 | 702 | 440 | 681 | 416 | 628 |
| 2013 | 524 | 659 | 477 | 691 | 445 | 646 |
| Year | Calf age | ADG | WDA | |||
| Min. | Max. | Min. | Max. | Min. | Max. | |
| 1994 | 148 | 238 | 2.1 | 3.0 | 2.4 | 3.5 |
| 1995 | 152 | 243 | 2.1 | 2.8 | 2.5 | 3.3 |
| 1996 | 146 | 235 | 1.8 | 2.7 | 2.2 | 3.1 |
| 1997 | 149 | 265 | 1.6 | 2.7 | 2.1 | 3.3 |
| 1998 | 159 | 250 | 1.8 | 2.9 | 2.1 | 3.3 |
| 1999 | 156 | 244 | 1.7 | 2.7 | 2.1 | 3.3 |
| 2000 | 154 | 235 | 1.9 | 2.8 | 2.0 | 3.3 |
| 2001 | 150 | 233 | 2.0 | 2.8 | 2.2 | 3.3 |
| 2002 | 150 | 240 | 2.0 | 2.9 | 2.3 | 3.4 |
| 2003 | 139 | 224 | 1.9 | 3.1 | 2.3 | 3.7 |
| 2004 | 136 | 238 | 2.1 | 3.0 | 2.4 | 3.5 |
| 2005 | 151 | 232 | 1.9 | 2.9 | 2.3 | 3.4 |
| 2006 | 133 | 240 | 1.9 | 3.1 | 2.4 | 3.6 |
| 2007 | 134 | 268 | 2.0 | 3.1 | 2.2 | 3.5 |
| 2008 | 137 | 241 | 2.0 | 3.3 | 2.3 | 3.7 |
| 2009 | 154 | 271 | 1.9 | 3.0 | 2.2 | 3.5 |
| 2010 | 139 | 255 | 1.8 | 3.0 | 2.3 | 3.5 |
| 2011 | 150 | 265 | 1.7 | 2.9 | 2.4 | 3.4 |
| 2012 | 157 | 227 | 1.8 | 3.1 | 2.4 | 3.5 |
| 2013 | 158 | 259 | 1.8 | 2.9 | 2.3 | 3.3 |
| Year | Frame score | |
| Min. | Max. | |
| 1994 | 4.3 | 7.6 |
| 1995 | 4.4 | 6.3 |
| 1996 | 4.7 | 6.1 |
| 1997 | 3.7 | 7.3 |
| 1998 | 4.4 | 6.4 |
| 1999 | 4.4 | 6.4 |
| 2000 | 4.5 | 6.1 |
| 2001 | 4.6 | 6.1 |
| 2002 | 4.8 | 7.9 |
| 2003 | 4.6 | 7.5 |
| 2004 | 4.9 | 6.8 |
| 2005 | 5.0 | 6.7 |
| 2006 | 5.0 | 6.3 |
| 2007 | 4.8 | 6.5 |
| 2008 | 4.1 | 8.1 |
| 2009 | 4.3 | 6.5 |
| 2010 | 4.9 | 6.4 |
| 2011 | 4.2 | 6.6 |
| 2012 | 5.2 | 5.9 |
| 2013 | 4.4 | 6.0 |
| Year | Cow age | Cow weight | Cow condition | |||
| Min. | Max. | Min. | Max. | Min. | Max. | |
| 1994 | 3.2 | 6.6 | 1,421 | 1,421 | ||
| 1995 | 3.9 | 6.8 | 1,266 | 1,407 | 6.5 | 6.5 |
| 1996 | 3.9 | 6.6 | 1,218 | 1,457 | 6.2 | 6.2 |
| 1997 | 3.8 | 6.5 | 1,316 | 1,456 | 6.0 | 6.0 |
| 1998 | 4.0 | 7.0 | 1,293 | 1,442 | 5.7 | 5.7 |
| 1999 | 3.6 | 7.0 | 1,279 | 1,492 | 5.9 | 5.9 |
| 2000 | 4.0 | 7.9 | 1,195 | 1,487 | 5.1 | 5.1 |
| 2001 | 3.5 | 7.5 | 1,304 | 1,497 | 4.3 | 5.5 |
| 2002 | 4.0 | 8.1 | 1,279 | 1,599 | 4.9 | 6.1 |
| 2003 | 4.0 | 7.6 | 1,231 | 1,618 | 6.0 | 6.0 |
| 2004 | 2.7 | 8.0 | 1,335 | 1,589 | 5.3 | 6.2 |
| 2005 | 2.8 | 7.8 | 1,272 | 1,599 | 5.0 | 6.1 |
| 2006 | 2.9 | 7.9 | 1,243 | 1,609 | 5.4 | 6.0 |
| 2007 | 4.2 | 8.5 | 1,218 | 1,559 | 5.2 | 5.9 |
| 2008 | 4.3 | 8.2 | 1,276 | 1,591 | 5.1 | 6.5 |
| 2009 | 4.4 | 8.2 | 1,169 | 1,598 | 5.0 | 6.7 |
| 2010 | 4.6 | 8.3 | 1,252 | 1,581 | 5.2 | 7.0 |
| 2011 | 4.4 | 7.8 | 1,290 | 1,574 | 5.3 | 7.0 |
| 2012 | 4.6 | 7.5 | 1,351 | 1,681 | 5.1 | 7.1 |
| 2013 | 2.8 | 6.8 | 1,339 | 1,527 | 5.1 | 5.8 |
Using CHAPS20Y Weight and Growth Data to Increase Extension Knowledge
Weights, growth, and ages were consistent across the years addressed by CHAPS20Y, as indicated by the horizontal trend lines throughout the figures, but we identified wide ranges between herd minimums and maximums. Herein we outline some possible causes of these variations.
Calf Weight and Growth
CHAPS20Y weights and growth figures varied up to twofold between herds. Pre- and postnatal calf nutrition is important in determining calf weights and growth potential (Greenwood & Cafe, 2007) and may explain some of the variation in the data. CHAPS20Y producers used numerous breeds, and breed affects weights and growth potential (Gregory, Cundiff, & Koch, 1991; Szabó et al., 2006). Weather, which varied across years and herd locations, also affects weights and growth. Cooler growing seasons increase growth rate from birth to weaning (MacNeil & Vermeire, 2012), whereas elevated temperatures can cause maternal heat stress, decreasing birth weight (Hansen, 2009). Moreover, calf age at weaning affects weight gains and yields. Research has shown that steer calves weaned early gain more body weight over time, resulting in greater ADGs and WDAs (Llewellyn et al., 2013).
Cow Age, Weight, and Condition
Cow age affects cow weight and condition. Younger and older cows have special nutritional requirements related to attaining or maintaining weight and condition (Ringwall, 2014). Cow weight and condition, in turn, affect calf weight and growth. Cows that are 5 to 8 years old tend to produce and wean heavier calves than younger or older cows do (Renquist, Oltjen, Sainz, & Calvert, 2006).
Reduced Herd Data
The reduced number of producers who measured all weight benchmarks reflects the time, expense, and difficulty of record keeping (Ringwall, 2015). However, Extension professionals should encourage producers to measure these benchmarks because they affect growth and reproduction. Calves with above-average birth weights have greater survival, growth, and reproductive potential than calves with below-average birth weights (Funston, Larson, & Vonnahme, 2010). In addition, reproductive performance is optimal in cows with a condition score of at least 5 (Herd & Sprott, 1998).
Conclusion
The CHAPS20Y tool has yielded data that we have used to increase the Extension knowledge base. We have outlined some of the factors affecting weights and growth, providing information Extension professionals can use to help beef producers set and achieve herd management goals.
Acknowledgments
We thank Lee Tisor, Wanda Ottmar, and Michelle Stolz for their management of the CHAPS database.
References
Beef Improvement Federation. (2010). Guidelines for uniform beef improvement programs (9th ed.) (revised September 2016). Retrieved from http://beefimprovement.org/content/uploads/2013/07/BIFGuidelinesFinal_updated0916.pdf
Funston, R. N., Larson, D. M., & Vonnahme, K. A. (2010). Effects of maternal nutrition on conceptus growth and offspring performance: Implications for beef cattle production. Journal of Animal Science, 88, E205–E215. Retrieved from https://dl.sciencesocieties.org/publications/jas/abstracts/88/13/E205
Greenwood, P. L., & Cafe, L. M. (2007). Prenatal and pre-weaning growth and nutrition of cattle: Long-term consequences for beef production. Animal, 1, 1283–1296. Retrieved from http://journals.cambridge.org/action/displayAbstract?fromPage=online&aid=1358284&fileId=S175173110700050X
Gregory, K. E., Cundiff, L. V., & Koch, R. M. (1991). Breed effects and heterosis in advanced generations of composite populations for birth weight, birth date, dystocia, and survival as traits of dam in beef cattle. Journal of Animal Science, 69, 3574–3589. Retrieved from https://www.animalsciencepublications.org/publications/jas/pdfs/69/9/3574
Hansen, P. J. (2009). Effects of heat stress on mammalian reproduction. Philosophical Transaction of the Royal Society B, 364, 3341–3350. Retrieved from http://rstb.royalsocietypublishing.org/content/364/1534/3341.short
Herd, D. B., & Sprott, L. R. (1998). Body condition, nutrition and reproduction of beef cows. Retrieved from http://animalscience.tamu.edu/wp-content/uploads/sites/14/2012/04/nutrition-body-condition-nutrition.pdf
Llewellyn, D., Schlickau, E., Marston, T., Harborth, K., Breiner, R., Unruh, J., & Dikeman, M. (2013). Influence of early weaning beef cows on the performance of male progeny and the need for winter protein supplementation. Agricultural Sciences, 4, 701–708. Retrieved from http://file.scirp.org/pdf/AS_2013122510122484.pdf
MacNeil, M. D., & Vermeire, L. T. (2012). Effect of weather patterns on preweaning growth of beef calves in the northern Great Plains. Agricultural Sciences, 3, 929–935. Retrieved from http://dx.doi.org/10.4236/as.2012.37113
Ramsay, J. M., Hulsman Hanna, L. L., & Ringwall, K. A. (2016). Maximizing use of Extension beef cattle benchmarks data derived from Cow Herd Appraisal Performance Software. Journal of Extension, 54(3), Article 3TOT5. Available at: https://www.joe.org/joe/2016june/tt5.php
Ramsay, J. M., Hulsman Hanna, L. L., & Ringwall, K. A. (2017a). Maximizing use of an Extension beef cattle data set: Part 1—Calving distribution. Journal of Extension, 55(3), Article 3TOT5. Available at: https://www.joe.org/joe/2017june/tt5.php
Ramsay, J. M., Hulsman Hanna, L. L., & Ringwall, K. A. (2017b). Maximizing use of an Extension beef cattle data set: Part 2—Reproductive rates. Journal of Extension, 55(4), Article 4TOT6. Available at: https://www.joe.org/joe/2017august/tt6.php
Renquist, B. J., Oltjen, J. W., Sainz, R. D., & Calvert, C. C. (2006). Effects of age on body condition and production parameters of multiparous beef cows. Journal of Animal Science, 84, 1890–1895. Retrieved from https://dl.sciencesocieties.org/publications/jas/abstracts/84/7/0841890
Ringwall, K. A. (2014). BeefTalk: Age and weight are cow herd dynamics. Retrieved from https://www.ag.ndsu.edu/news/columns/beeftalk/beeftalk-age-and-weight-are-cow-herd-dynamics/
Ringwall, K. A. (2015). BeefTalk: Are cattle records worth the effort? Retrieved from https://www.ag.ndsu.edu/news/columns/beeftalk/beef-talk-are-cattle-records-worth-the-effort/
Ringwall, K. A., & Berg, P. M. (1990). CHAPS II: Cow Herd Appraisal Performance Software user guide. Retrieved from https://library.ndsu.edu/repository/handle/10365/22560
Szabó, F., Nagy, L., Dákay, I., Márton, D., Török, M., & Bene, Sz. (2006). Effects of breed, age of dam, birth year, birth season and sex on weaning weight of beef calves. Livestock Science, 103, 181–185. Retrieved from http://www.livestockscience.com/article/S1871-1413(06)00030-8/abstract