June 2017
|
June 2017 // Volume 55 // Number 3 // Tools of the Trade // v55-3tt5


Maximizing Use of an Extension Beef Cattle Data Set: Part 1—Calving Distribution
Abstract
Previously, we created a 20-year data set, CHAPS20Y, from historical data generated by Cow Herd Appraisal Performance Software, a beef management program. In this article, we describe CHAPS20Y calving distributions, including yearly means and 20-year averages. Yearly mean calving distributions are consistent over the 20-year period, but yearly herd minimum and maximum values vary greatly. Herd-to-herd differences in nutrition, breed, environment, and management may explain this variation. We used CHAPS20Y as a tool for understanding calving distribution and increasing the Extension knowledge base. Extension professionals can use this knowledge to help beef producers set and achieve their herd management goals.
Introduction
Cow Herd Appraisal Performance Software (CHAPS) is an Extension-developed beef herd management program that has been used by producers for over 30 years (Ramsay, Hulsman Hanna, & Ringwall, 2016). The program has allowed the CHAPS team at the North Dakota State University Extension Service to assemble substantial historical beef herd data that include calving distribution, reproduction, and growth data. Previously, we reported a process for selecting herds from CHAPS historical data to create CHAPS20Y, a 20-year data set spanning from 1994 through 2013, as an Extension tool for understanding trends in beef production (Ramsay et al., 2016).
In this article, we describe calving distribution data obtained from CHAPS20Y, including yearly means and the averages of the yearly means (20-year averages). Additionally, we describe linear trends over time based on the 20-year averages. Those of us working in applicable areas of Extension can use knowledge gained from CHAPS20Y calving distribution data to help producers set relevant herd management goals and adjust management plans as needed to achieve those goals.
Describing Calving Distribution Data
Trigger and Calving Dates
CHAPS defines the date that the third mature cow in a herd calves as the trigger date (Day 0), or the start of the calving period for the herd. We report the trigger date and each calving date on a day-of-year calendar, ranging from 1 to 365(366) days, to understand when calving occurs during the year.
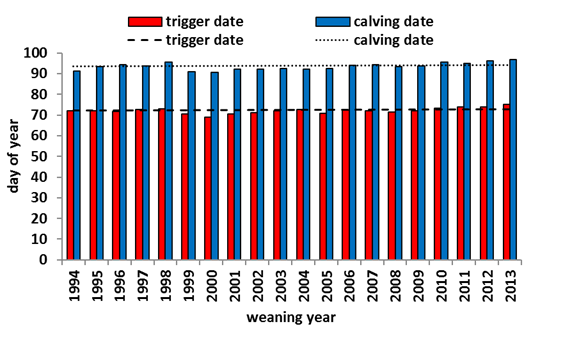
Yearly mean trigger dates for CHAPS20Y ranged from day 69 to day 75 (March 10–17), with a 20-year average of day 72 (March 13) (Figure 1). Yearly mean calving dates ranged from day 91 to day 97 (April 1–8), with a 20-year average of day 94 (April 4) (Figure 1).
Figure 1.
Yearly Mean Trigger and Calving Dates (Day of Year) with 20-Year Average Trend Lines
Overall Calving Distribution
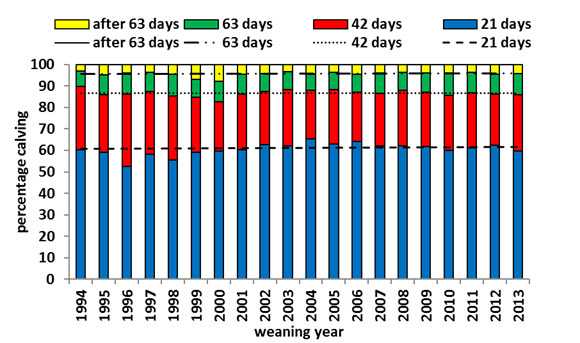
CHAPS defines calving distribution as the percentages of individuals calving by certain times during the calving period (Ramsay et al., 2016). Each year, for each herd, CHAPS calculates calving distributions by first determining the number of days between the trigger date and each individual's calving date and then determining the percentages of individuals in the herd that calved within 21 days, within 42 days, within 63 days, and after 63 days relative to the trigger date (Day 0). Figure 2 shows cumulative yearly calving distributions with 20-year average trend lines. Yearly mean calving distributions ranged from 53% to 65% at 21 days, with a 20-year average of 61%; 83% to 90% at 42 days, with a 20-year average of 87%; 92% to 97% at 63 days, with a 20-year average of 96%; and 3% to 8% after 63 days, with a 20-year average of 4%.
Figure 2.
Cumulative Yearly Mean Calving Distribution with 20-Year Average Trend Lines
Heifer and Mature Cow Calving Distribution
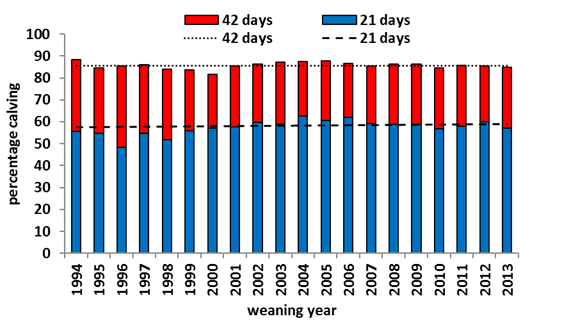
CHAPS also calculates the calving distributions of heifers (cow age ≤ 2 years) and mature cows separately. Heifers can calve early, prior to the trigger date (Day 0), because CHAPS bases the trigger date on the calving dates of only mature cows. Cumulative yearly calving percentages are shown for heifers in Figure 3 and for cows in Figure 4. The percentages of heifers that calved early ranged from 24% to 41%, with a 20-year average of 36%. For heifers that did not calve early, yearly mean calving distributions ranged from 69% to 77% at 21 days, with a 20-year average of 73%, and 82% to 93% at 42 days, with a 20-year average of 88%. The percentage of mature cows that calved by 21 days ranged from 48% to 63%, with a 20-year average of 57%. By 42 days, 82% to 88% of cows calved, with a 20-year average of 86%.
Figure 3.
Cumulative Yearly Mean Heifer Calving Distribution with 20-Year Average Trend Lines
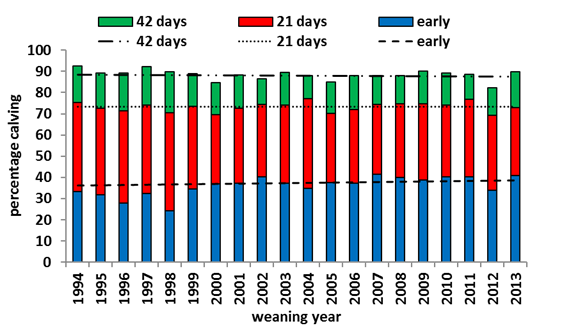
Figure 4.
Cumulative Yearly Mean Cow Calving Distribution with 20-Year Average Trend Lines
Heifer Calving Distribution Versus Mature Cow Calving Distribution
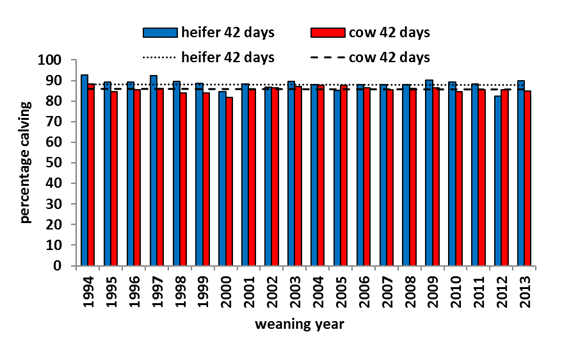
Heifer calving distribution and mature cow calving distribution differed over time. Almost 20% more heifers calved by 21 days compared to mature cows (Figure 5), whereas the percentages of heifers and mature cows that calved by 42 days were similar (Figure 6).
Figure 5.
Yearly Mean Calving Distribution at 21 Days: Heifer Versus Cow, with 20-Year Average Trend Lines
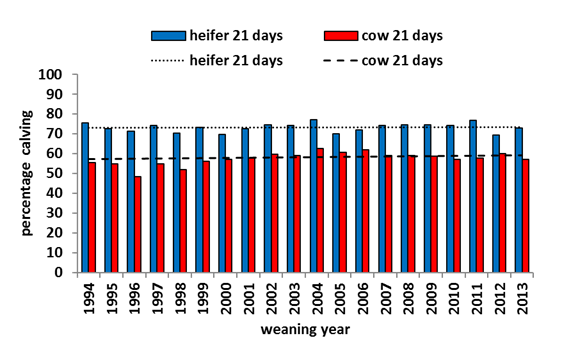
Figure 6.
Yearly Mean Calving Distribution at 42 Days: Heifer Versus Cow, with 20-Year Average Trend Lines
Yearly Minimums and Maximums
To better demonstrate the herd-to-herd variation in the CHAPS20Y data set, we present yearly herd minimums and maximums for trigger and calving dates (calendar dates) (Table 1) and yearly herd minimum and maximum calving distribution percentages for all heifers and cows (Table 2), for heifers only (Table 3), and for mature cows only (Table 4).
| Year | Trigger date | Calving date | ||
| Min. | Max. | Min. | Max. | |
| 1994 | Feb 13 | Apr 9 | Mar 7 | Apr 28 |
| 1995 | Jan 27 | Apr 8 | Mar 8 | Apr 28 |
| 1996 | Feb 18 | Mar 30 | Mar 6 | Apr 27 |
| 1997 | Feb 10 | Apr 10 | Mar 6 | Apr 28 |
| 1998 | Feb 8 | Apr 11 | Mar 4 | Apr 26 |
| 1999 | Feb 6 | Apr 12 | Feb 23 | Apr 29 |
| 2000 | Feb 6 | Apr 11 | Feb 25 | Apr 24 |
| 2001 | Jan 25 | Apr 13 | Mar 1 | Apr 29 |
| 2002 | Jan 24 | Apr 12 | Mar 1 | Apr 25 |
| 2003 | Feb 2 | Apr 12 | Mar 6 | May 3 |
| 2004 | Feb 11 | Apr 11 | Mar 2 | Apr 29 |
| 2005 | Feb 7 | Apr 15 | Feb 28 | Apr 27 |
| 2006 | Feb 8 | Apr 14 | Mar 7 | Apr 30 |
| 2007 | Feb 12 | Apr 14 | Feb 25 | May 11 |
| 2008 | Feb 8 | Apr 21 | Mar 8 | May 16 |
| 2009 | Feb 1 | Apr 19 | Mar 10 | May 14 |
| 2010 | Feb 2 | Apr 15 | Mar 8 | May 14 |
| 2011 | Feb 10 | Apr 29 | Mar 10 | May 8 |
| 2012 | Feb 7 | Apr 19 | Mar 6 | May 17 |
| 2013 | Feb 8 | Apr 22 | Mar 6 | May 11 |
| Year | 21 days | 42 days | 63 days | > 63 days | ||||
| Min. | Max. | Min. | Max. | Min. | Max. | Min. | Max. | |
| 1994 | 32 | 73 | 79 | 97 | 88 | 100 | 0 | 12 |
| 1995 | 4 | 78 | 10 | 97 | 62 | 100 | 0 | 38 |
| 1996 | 14 | 78 | 68 | 96 | 86 | 100 | 0 | 14 |
| 1997 | 26 | 80 | 62 | 97 | 84 | 100 | 0 | 16 |
| 1998 | 20 | 77 | 63 | 95 | 77 | 100 | 0 | 23 |
| 1999 | 4 | 91 | 4 | 99 | 11 | 100 | 0 | 89 |
| 2000 | 2 | 90 | 2 | 100 | 2 | 100 | 0 | 98 |
| 2001 | 1 | 88 | 6 | 100 | 66 | 100 | 0 | 34 |
| 2002 | 2 | 96 | 30 | 99 | 77 | 100 | 0 | 23 |
| 2003 | 6 | 91 | 46 | 99 | 75 | 100 | 0 | 25 |
| 2004 | 3 | 89 | 3 | 100 | 3 | 100 | 0 | 98 |
| 2005 | 6 | 93 | 11 | 99 | 68 | 100 | 0 | 32 |
| 2006 | 12 | 93 | 36 | 100 | 71 | 100 | 0 | 29 |
| 2007 | 1 | 100 | 43 | 100 | 81 | 100 | 0 | 19 |
| 2008 | 4 | 88 | 56 | 100 | 78 | 100 | 0 | 22 |
| 2009 | 5 | 86 | 15 | 99 | 62 | 100 | 0 | 38 |
| 2010 | 5 | 82 | 29 | 99 | 76 | 100 | 0 | 24 |
| 2011 | 16 | 89 | 57 | 100 | 86 | 100 | 0 | 14 |
| 2012 | 12 | 88 | 37 | 100 | 81 | 100 | 0 | 19 |
| 2013 | 4 | 86 | 38 | 99 | 82 | 100 | 0 | 18 |
| Year | Early | 21 days | 42 days | |||
| Min. | Max. | Min. | Max. | Min. | Max. | |
| 1994 | 0 | 90 | 40 | 100 | 76 | 100 |
| 1995 | 0 | 86 | 14 | 100 | 60 | 100 |
| 1996 | 0 | 89 | 22 | 97 | 67 | 100 |
| 1997 | 0 | 89 | 27 | 100 | 56 | 100 |
| 1998 | 0 | 91 | 0 | 100 | 0 | 100 |
| 1999 | 0 | 92 | 27 | 100 | 69 | 100 |
| 2000 | 0 | 100 | 0 | 100 | 0 | 100 |
| 2001 | 0 | 100 | 0 | 100 | 0 | 100 |
| 2002 | 0 | 100 | 0 | 100 | 0 | 100 |
| 2003 | 0 | 94 | 14 | 100 | 64 | 100 |
| 2004 | 0 | 97 | 0 | 100 | 0 | 100 |
| 2005 | 0 | 100 | 0 | 100 | 0 | 100 |
| 2006 | 0 | 100 | 0 | 100 | 32 | 100 |
| 2007 | 0 | 100 | 4 | 100 | 67 | 100 |
| 2008 | 0 | 100 | 0 | 100 | 58 | 100 |
| 2009 | 0 | 97 | 3 | 100 | 28 | 100 |
| 2010 | 0 | 100 | 0 | 100 | 0 | 100 |
| 2011 | 0 | 93 | 22 | 100 | 57 | 100 |
| 2012 | 0 | 96 | 0 | 100 | 0 | 100 |
| 2013 | 0 | 94 | 0 | 100 | 62 | 100 |
| Year | 21 days | 42 days | ||
| Min. | Max. | Min. | Max. | |
| 1994 | 12 | 75 | 63 | 99 |
| 1995 | 5 | 78 | 13 | 96 |
| 1996 | 9 | 77 | 62 | 95 |
| 1997 | 22 | 76 | 54 | 98 |
| 1998 | 10 | 78 | 61 | 95 |
| 1999 | 7 | 89 | 7 | 99 |
| 2000 | 1 | 88 | 1 | 100 |
| 2001 | 1 | 89 | 4 | 100 |
| 2002 | 3 | 96 | 29 | 99 |
| 2003 | 3 | 89 | 45 | 100 |
| 2004 | 3 | 91 | 3 | 100 |
| 2005 | 6 | 99 | 12 | 99 |
| 2006 | 7 | 100 | 29 | 100 |
| 2007 | 1 | 100 | 38 | 100 |
| 2008 | 2 | 86 | 54 | 100 |
| 2009 | 2 | 86 | 12 | 98 |
| 2010 | 2 | 81 | 19 | 99 |
| 2011 | 1 | 86 | 47 | 100 |
| 2012 | 1 | 87 | 27 | 100 |
| 2013 | 4 | 87 | 32 | 99 |
Using CHAPS20Y Calving Distribution Data to Increase Extension Knowledge
We have shown yearly mean trigger dates, calving dates, and calving distributions to be consistent over the 20-year period, as indicated by horizontal linear trend lines in Figures 1–6. However, yearly minimums and maximums vary greatly, indicating herd-to-herd variability. Although it is not our intention to determine cause and effect, we outline here possible causes of this variation to expand the Extension knowledge base, providing information Extension professionals can use to help producers manage their herds to meet their goals.
Numerous factors affect calving distribution and can result in variability within and between herds. Proper nutrition is important to successful reproduction, and producers should evaluate nutrition practices when calving is not timely (Hess et al., 2005). Breed and genetics affect the timing and reproductive capacity of beef cattle (Gregory, Cundiff, & Koch, 1991). Cool wet springs and warm wet summers, associated with increased forage production, tend to increase cow-calf production (Reeves et al., 2015). Hot weather and drought can cause heat stress and impair reproduction (Carroll & Hoerlein, 1966; St-Pierre, Cobanov, & Schnitkey, 2003). The age of a cow is also an important consideration. First-calf heifers often require more time than older cows to recover from calving before subsequent rebreeding (Ringwall, Berg, & Boggs, 1992).
Timely calving ensures ample time for rebreeding, allowing each cow to produce a calf every 365 days (Ringwall, 2014). Ideally, 60% of heifers and cows in a herd should calve in the first 21 days of the calving season, and 86% in the first 42 days (Ringwall, 2013). Producers may need to adjust breeding plans to achieve this goal; adjustments may include culling of late-calving cows (Ringwall, 2014).
Conclusion
Using data from CHAPS20Y, we have added to the Extension knowledge base and broadened Extension thinking on beef cattle reproductive management. We have outlined the numerous factors that affect calving distribution. With this knowledge, Extension professionals can help producers set herd management goals and adjust management plans to achieve those goals.
Acknowledgments
We thank Lee Tisor, Wanda Ottmar, and Michelle Stolz for their management of the CHAPS database.
References
Carroll, E. J., & Hoerlein, A. B. (1966). Reproductive performance of beef cattle under drought conditions. Journal of the American Veterinary Medical Association, 148, 1030–1033.
Gregory, K. E., Cundiff, L. V., & Koch, R. M. (1991). Breed effect and heterosis in advanced generations of composite populations for birth weight, birth date, dystocia, and survival as traits of dam in beef cattle. Journal of Animal Science, 69, 3574–3589. Retrieved from https://www.animalsciencepublications.org/publications/jas/pdfs/69/9/3574
Hess, B. W., Lake, S. L., Scholljegerdes, E. J., Weston, T. R., Nayigihugu, V., Molle, J. D. C., & Moss, G. E. (2005). Nutritional controls of beef cow reproduction. Journal of Animal Science, 83(E. Suppl.), E90–E106. Retrieved from https://www.animalsciencepublications.org/publications/jas/pdfs/83/13_suppl/0830090
Ramsay, J. M., Hulsman Hanna, L. L., & Ringwall, K. A. (2016). Maximizing use of Extension beef cattle benchmarks data derived from Cow Herd Appraisal Performance Software. Journal of Extension, 54(3), Article 3TOT5. Available at: http://www.joe.org/joe/2016june/tt5.php
Reeves, J. L., Derner, J. D., Sanderson, M. A., Hendrickson, J. R., Kronberg, S. L., Vermeire, L. T., . . . Irisarri, J. G. (2015). Seasonal weather-related decision making for cattle production in the Northern Great Plains. Rangelands, 37(5), 119–124. Retrieved from https://www.researchgate.net/publication/274737471
Ringwall, K. A. (2013). BeefTalk: To pass, 60 percent must calve in 21 days. Retrieved from https://www.ag.ndsu.edu/news/columns/beeftalk/beeftalk-to-pass-60-percent-must-calve-in-21-days/
Ringwall, K. A. (2014). BeefTalk: Are 60 percent calving in first 21 days? Retrieved from https://www.ag.ndsu.edu/news/columns/beeftalk/beeftalk-are-60-percent-calving-in-first-21-days/
Ringwall, K. A., Berg, P. M., & Boggs, D. L. (1992). A computer program for appraising and increasing productivity in beef cattle. Veterinary Medicine, 87, 706–718.
St-Pierre, N. R., Cobanov, B., & Schnitkey, G. (2003). Economic losses from heat stress by US livestock industries. Journal of Dairy Science 86, E52–E77. Retrieved from http://www.journalofdairyscience.org/article/S0022-0302(03)74040-5/pdf