June 2017
|
June 2017 // Volume 55 // Number 3 // Tools of the Trade // v55-3tt3


Using Geospatial Analysis to Align Little Free Library Locations with Community Literacy Needs
Abstract
We used geospatial analysis tools to develop community maps depicting fourth-grade reading proficiency test scores and locations of facilities offering public access to reading materials (i.e., public libraries, elementary schools, and Little Free Libraries). The maps visually highlighted areas with struggling readers and areas without adequate public access to reading materials, providing information useful for executing a strategic response to literacy issues. Community development Extension professionals can use geospatial analysis to educate, inform, and create targeted actions related to a range of social issues. Applying geospatial analysis can make data more engaging, understandable, and impactful and can assist communities in seeing the bigger picture of an issue.
Literacy is an important issue in Nevada. Nevada is ranked 43rd in the nation for elementary school reading proficiency (U.S. Department of Education Institute of Education Sciences, National Center for Education Statistics, 2013), and research strongly indicates a direct relationship between grade-level reading proficiency and high school graduation (Annie E. Casey Foundation, 2013).
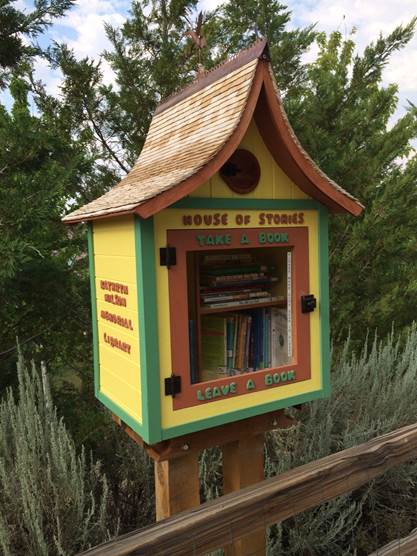
Little Free Libraries (LFLs) provide opportunities for increased access to books and reading material for children. LFLs are small custom-built free-standing boxes that house 20 to 100 books (Figure 1). Over 32,000 officially registered LFLs exist; they are in all 50 states and over 70 countries worldwide (Little Free Library, n.d.). LFLs embody the "take a book, leave a book" philosophy. They are placed in neighborhoods and are accessible to anyone who wants to stop, browse, and select books.
Figure 1.
Little Free Library in a Community
Increased access to books for youths can have a direct impact on literacy rates (Annie E. Casey Foundation, 2013). Extension personnel and others involved in addressing community needs can use LFLs as the basis for a project that effectively promotes community pride and encourages literacy. A first step in starting an LFL project is finding a suitable location for each LFL. Determining the locations of LFLs is an important decision that can have a positive impact in the community and provide increased access to books. In this article, we explain how we used geospatial analysis in one community to foster stronger awareness of literacy issues and identify strategic potential locations for LFLs.
Geographic information system (GIS) technology and geospatial analysis are tools frequently used by Extension professionals and others to identify and visualize spatial data (Longley, Goodchild, Maguire, & Rhind, 2011). Typically these spatial technologies are associated with natural and environmental sciences, such as landscape design, agricultural sciences, forestry, wildlife, geology, and so on (Milla, Lorenzo, & Brown, 2005). However, location-based data tools, such as geospatial analysis, can be effectively used in the social sciences as well (Gentile, 2012). If one has location data, one can use geospatial analysis to map social issues and help residents gain a bigger picture of a community issue.
Given today's increasing reliance on geo-reference data, and open access databases, an endless supply of data is available on a variety of issues. As part of a collective impact approach to the issue of literacy, a partnership involving University of Nevada Cooperative Extension, United Way, and the Department of Geography at University of Nevada, Reno was formed. Through this partnership, we conducted a community-based research project that examined reading proficiency test scores and public access to reading materials. We used the information we collected to identify strategic future locations for LFLs to provide increased access to books for youths in the community who might benefit the most.
Methods
Three sources of data were explored and analyzed.
- Zip code tabulation area spatial data were created (U.S. Census Bureau, 2010).
- GIS locations were plotted to reflect public access to reading material in regard to (a) public libraries, (b) elementary schools, and (c) Little Free Libraries (U.S. Census Bureau, 2010).
- Test score data from fourth-grade reading proficiency tests were obtained (Nevada Legislature Legislative Counsel Bureau, 2015).
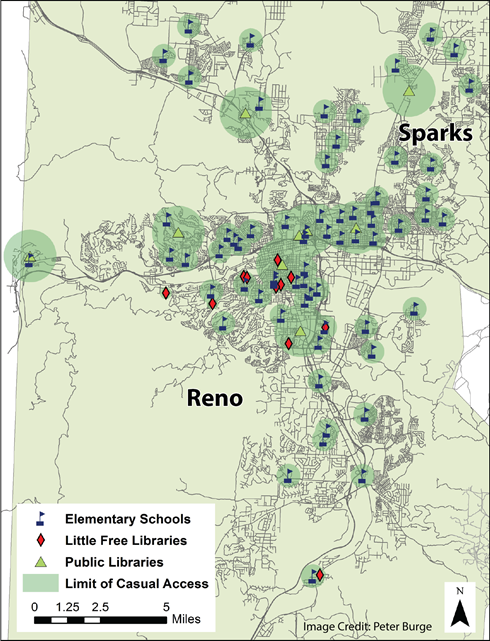
We determined a limit of "casual access"—how far an individual might casually travel to obtain reading material—for each of three types of sites offering public access to books (i.e., public library, elementary school, and LFL). Casual access was calculated as 1 mi for a public library, 2,400 ft for an elementary school, and 1,200 ft for an LFL. Casual access to reach a community LFL was assumed as a leisurely neighborhood walk.
After we plotted locations of public libraries, elementary schools, and existing LFLs and the limit of casual access for each on a GIS map, an image unfolded that depicted the limit of casual access to reading material for elementary school students in the community (Figure 2).
Figure 2.
Casual Access to Reading Material
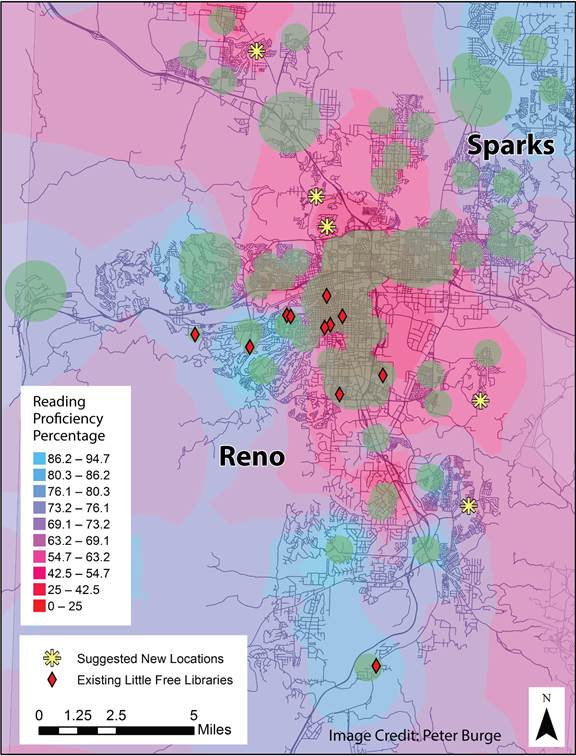
Next, we conducted a geospatial analysis to examine fourth-grade reading proficiency test scores by elementary school. Each elementary school is required by the Nevada Department of Education to administer standardized reading proficiency tests. The resulting data are freely available and located on the department's website. On a GIS map showing these data, reading proficiency test scores were color-coded and displayed in a progression from blue to red to reflect reading proficiency. Blue spheres identified schools that had obtained an average score of 70% or above, with brighter blue reflecting higher scores (i.e., 90th percentile). Schools that had obtained an average score below 70% were noted by gray to red spheres, with darker red reflecting lower scores (i.e., 35th percentile).
Results
We overlaid the map showing access to reading materials (Figure 2) and the map showing reading proficiency test score data to create a color-coded map that depicted community zones according to reading proficiency levels and residential areas targeted for potential LFL placement (Figure 3). On that map, geographic zones colored blue are areas in which students have higher reading proficiency test scores. Geographic zones colored pink to red are areas in which students have lower reading proficiency test scores. By including locations of existing LFLs, we were able to plot suggested LFL locations. Suggested LFL sites are potential locations where stewards or hosts, such as businesses in the area, could consider placing an LFL to most effectively benefit struggling readers in the community. We have shared the information from our analysis with targeted schools and other stakeholders working on literacy issues.
Figure 3.
Reading Proficiencies and Strategic Potential Locations for LFLs
Implications
Extension professionals, and in particular community development Extension professionals, can use geospatial analysis such as the example described in this article to help align community actions with felt needs. Geospatial analysis presents data in a context that is visually appealing and understandable to decision makers and community groups. The method described herein highlighted a community need and provided information for strategic action community members could take to help address that need. In our case, the intent was to identify one action that could help get more books into the hands of the young readers who would benefit most in the community. However, the potential applications of geospatial analysis are wide ranging. Extension professionals can use geospatial analysis across a range of social issues to educate, inform, and spur effective community actions.
References
Annie E. Casey Foundation. (2013). Early warning confirmed: A research update on third grade reading. Retrieved from http://www.aecf.org/m/resourcedoc/AECF-EarlyWarningConfirmed-2013.pdf
Gentile, M. (2012). Geospatial analytics: The three-minute guide. Retrieved from http://www2.deloitte.com/content/dam/Deloitte/global/Documents/Deloitte-Analytics/dttl-analytics-us-ba-geospatial3minguide.pdf
Little Free Library. (n.d.). Little Free Library. Retrieved September 23, 2015, from https://littlefreelibrary.org/#
Longley, P., Goodchild, M., Maguire, D., & Rhind, D. (2011). Geographic information systems and science 3e. Hoboken, NJ: John Wiley & Sons.
Milla, K., Lorenzo, A., & Brown, C. (2005). GIS, GPS, and remote sensing technologies in Extension services: Where to start, what to know. Journal of Extension, 43(3), Article 3FEA6. Available at: https://joe.org/joe/2005june/a6.php
Nevada Legislature Legislative Counsel Bureau. (2015). 2015 Nevada education data book. Retrieved from http://www.nvasb.org/assets/2015_educationdatabook.pdf
U.S. Census Bureau. (n.d.). Zip code tabulation area (ZCTA). http://www.census.gov/geo/maps-data/data/zcta_rel_download.html
U.S. Department of Education Institute of Education Sciences, National Center for Education Statistics. (2013). Nation's report card: mathematics and reading assessments. Washington, DC: Author.