February 2017
|
February 2017 // Volume 55 // Number 1 // Feature // v55-1a1


Using Cluster Analysis to Target Educational Messages to Consumers
Abstract
Cluster analysis is a common marketing tool for identifying groups of customers, clients, or consumers similar enough in demographics, behaviors, or attitudes to warrant specialized methods for targeting them with a desired message. We used cluster analysis on data from an integrated pest management (IPM) survey of the general public to categorize groups by their similarities with regard to IPM-related attitudes and behaviors. We describe how we used these data to target critical IPM messages in ways most likely to elicit positive behavior change. The methods we used could be applied in many disciplines to target Extension educational messages to diverse client groups.
Introduction
Extension educators assess and prioritize the needs of their stakeholder groups to develop educational programming for those audiences. However, rarely do they consider the unique perspectives, behaviors, and attitudes of different target audience members when designing such programs. This additional effort can be accomplished through audience segmentation, and it can make educational programs more efficient and effective.
Social marketers use audience segmentation as a first step toward designing programs for influencing behavior change (Andreason, 1995; Lefebvre, 2013; McKenzie-Mohr, 2011; Wilbur, 2006). Target audiences can be parceled into smaller, discrete units with common characteristics (Wilbur, 2006). Barriers and benefits to learning and behavior change can then be identified for each unit, allowing development of more effective programming strategies (Lefebvre, 2013; McKenzie-Mohr, 2011).
Audience segmentation also has been used by Extension workers to identify effective delivery methods for forestry information (Bardon, Hazel, & Miller, 2007), to organize homeowners into groups according to their values and knowledge about lawn care (Mangiafico, Obropta, & Rossi-Griffin, 2012), to evaluate the information communication system of a network of community gardens (Loria, 2013), and to identify groups for landscape water conservation programs (Monaghan, Ott, Wilber, Gouldthorpe, & Racevskis, 2013).
One way to segment target audiences is by using cluster analysis, an established statistical technique used in many disciplines as an exploratory tool (Antonenko, Toy, & Niederhauser, 2012). Data are grouped by common characteristics so that subjects within a group are more similar to one another than they are to subjects in other groups. Cluster analysis can be used by Extension professionals to identify differences in behaviors, motivations, and learning styles within a target audience. In this way, strategies can be developed for more efficiently and effectively focusing and delivering educational messages (Skelly, Hill, & Singletary, 2014).
Here we demonstrate how we used results of a cluster analysis to target population segments with strategic messages to result in positive behavior change. We used cluster analysis to group participants in an integrated pest management (IPM) survey by traits revealed through their survey responses. We looked for common responses within each cluster that would provide insight into the behaviors and values of that group. Our goal was to use this information to design messages that would motivate our clients to make positive changes in pest management practices. We also describe the methods we developed to target each segment with strategic IPM messages. Extension professionals in many disciplines may use our example to perform similar analyses of survey data and devise educational strategies suitable for their unique situations.
Methods
We partnered with the Center for Program Evaluation at the University of Nevada, Reno to administer our IPM survey to a random sample of the general public in four Nevada counties: Washoe, Carson City, Douglas, and Storey. An introductory letter was mailed to 3,000 residents on February 8, 2012. The survey was distributed 1 week later. Reminder postcards were mailed on February 15 and February 22. After we removed 261 returned mailings for which no forwarding address was available and 27 incomplete responses from the original 3,000 surveys sent, the response rate was 21.4% (580 total usable surveys out of 2,712). A pilot test of the survey was sent to a subset of master gardeners, and responses were used to improve the validity and reliability of survey questions. Institutional review board approval was attained prior to administering the survey.
Cluster analysis was used as a post hoc tool for sorting survey data by response patterns. K-means, nonhierarchical clustering was selected due to the size of the data set and the desire to identify a limited number of clusters. We also were seeking a centroid method of identifying clusters rather than attempting to obtain a large number of clusters, which would be difficult to classify for educational program targeting. With this method, the number of clusters is specified (forced), and we used centroids/clusters of four, five, and six. The calculations were completed through the use of SPSS. The program calculates centroids for a trial set of clusters (four, five, or six, in our case) and places each item in the cluster that has the nearest centroid. The program then recalculates the centroids and, again, allocates each item to its closest centroid. This recalculation-and-reallocation process continues until there are no more changes in the cluster membership, resulting in greater homogeneity of the final clusters (Antonenko et al., 2012). After reviewing data from the three possible cluster solutions, we chose the five-cluster solution on the basis of its disaggregated means. The differences among clusters were confirmed through the use of this method.
We did not conduct post hoc statistical analyses of our cluster data because statistical differences among clusters were not relevant to our goal. Our intent was to develop strategic educational messages that could be delivered across our entire audience, with different messages resonating with members of the different subgroups.
Results
Analysis of our survey data uncovered five groups of respondents who were clustered by their similarities in demographics and IPM-related attitudes, beliefs, and behaviors.
Demographic data organized by cluster are displayed in Table 1. Sixty percent of respondents were either beginner or avid, but not professional gardeners. For the purposes of our survey, professional gardeners were certified master gardeners or Green Industry professionals. They constituted only 14.6% of total survey respondents, but over 35% of cluster 4. Eighty percent of survey respondents were 45 years of age or older. Well over one third of respondents were age 60 or older. Respondents aged 60 or older had the proportionally greatest representation in cluster 1 (62%). Overall, gender distribution was relatively equal, with 48% female respondents and 52% male respondents. However, cluster 4 had a proportionally greater number of females, and cluster 5 had a proportionally greater number of males. Overall, survey respondents were highly educated. Nearly 90% had an undergraduate college degree or higher. Highly educated survey respondents were especially concentrated in cluster 4. In this cluster, fewer than 2% of members had less than a college degree. Most survey respondents owned their homes (98%), and annual household incomes were divided fairly evenly across and within clusters.
| Characteristic |
Cluster 1 n = 78 |
Cluster 2 n = 160 |
Cluster 3 n = 152 |
Cluster 4 n = 131 |
Cluster 5 n = 59 |
Overall N = 580 |
| Gardening interest | ||||||
| I don't garden | 19.2% | 11.9% | 15.6% | 4.0% | 22.4% | 13.1% |
| Reluctant | 19.2% | 15.2% | 12.8% | 11.9% | 15.5% | 14.4% |
| Beginner | 24.7% | 28.5% | 29.6% | 18.3% | 25.9% | 25.7% |
| Avid, but not master gardener | 26.0% | 31.8% | 39.0% | 29.4% | 31.0% | 32.2% |
| Certified master gardener | 9.6% | 10.6% | 2.1% | 31.7% | 3.4% | 12.4% |
| Green Industry professional | 1.4% | 2.0% | 1.0% | 4.8% | 1.7% | 2.2% |
| Age (years) | ||||||
| 18–24 | 0.0% | 0.0% | 0.0% | 0.0% | 0.0% | 0.0% |
| 25–44 | 10.0% | 22.2% | 23.4% | 15.7% | 27.7% | 19.9% |
| 45–59 | 28.3% | 36.5% | 36.3% | 42.6% | 38.3% | 37.1% |
| 60+ | 61.7% | 41.3% | 40.3% | 41.7% | 34.0% | 43.0% |
| Gender | ||||||
| Female | 40.6% | 50.7% | 40.2% | 65.5% | 32.7% | 48.4% |
| Male | 59.4% | 49.3% | 59.8% | 34.5% | 67.3% | 51.6% |
| Education | ||||||
| High school | 14.9% | 12.1% | 17.0% | 1.6% | 9.6% | 11.1% |
| College | 52.7% | 60.4% | 55.3% | 53.6% | 63.5% | 56.7% |
| Postgraduate | 32.4% | 27.5% | 27.7% | 44.8% | 26.9% | 32.2% |
| Homeownership | ||||||
| Homeowner | 97.4% | 96.9% | 98.6% | 98.4% | 98.3% | 97.9% |
| Renter | 2.6% | 3.1% | 1.4% | 1.6% | 1.7% | 2.1% |
| Annual household income | ||||||
| <$40,000 | 22.5% | 15.4% | 15.6% | 16.0% | 15.4% | 16.5% |
| $40,000–$59,999 | 23.9% | 21.7% | 16.3% | 25.2% | 11.5% | 20.3% |
| $60,000–$79,999 | 19.7% | 18.9% | 24.1% | 16.0% | 23.1% | 20.2% |
| $80,000–$99,999 | 11.3% | 22.4% | 17.0% | 12.6% | 17.3% | 16.7% |
| $100,000+ | 22.5% | 21.7% | 27.0% | 30.3% | 32.7% | 26.2% |
Survey respondents were asked a variety of questions about IPM and pesticide use. Representative questions and their answers organized by cluster are summarized in Table 2. For the question "Have you heard of IPM?" the median response across most clusters was "No." Similarly, for the question "How often do you use IPM on your landscape?" the median response was "Sometimes." Respondents grouped in cluster 4 answered those questions with "Maybe" and "Most of the time," respectively. The next two questions—"How often are pesticides are applied on your lawn?" and "How often are weed-and-feed-type products applied on your lawn?"—were included to help us discover whether respondents understood that weed-and-feed-type products contain a pesticide (weed killer). Respondents in clusters 1 through 4 reported that pesticides were seldom applied to their lawns and that weed-and-feed-type products were used on their lawns three times or less per year. Respondents in cluster 5 reported that pesticides were never applied to their lawns, yet they also reported that weed-and-feed-type products were used on their lawns one to three times per year. This response from cluster 5 indicates a lack of understanding about the content of weed-and-feed-type products and what a pesticide is. When asked whether they agreed with the statement "I prefer not to use pesticides," respondents in clusters 2 and 4 were more likely to answer "Yes" than respondents in other clusters.
| Questions |
Cluster 1 n = 78 |
Cluster 2 n = 160 |
Cluster 3 n = 152 |
Cluster 4 n = 131 |
Cluster 5 n = 59 |
| Have you heard of IPM? | No | No | No | Maybe | No |
| How often do you use IPM on your landscape? | Sometimes | Sometimes | Sometimes | Most of the time | Never |
| How often are pesticides applied on your lawn? | Seldom | Seldom | Seldom | Seldom | Never |
| How often are weed-and-feed-type products used on your lawn? | Less than once per year | 1 to 3 times per year | 1 to 3 times per year | Never | 1 to 3 times per year |
| I prefer not to use pesticides. | Maybe | Yes | Maybe | Yes | Maybe |
| Note. Reported responses are based on the median within each cluster. | |||||
Survey respondents were asked to indicate their degrees of agreement or disagreement with a number of statements about lawns and lawn care (Figure 1). Answers above 3 indicate general agreement with the statement. Answers below 3 indicate disagreement. The questions were designed to help us understand the degree to which respondents aspired to a perfect lawn and what they believed is needed to achieve it. Respondents in cluster 4 were least likely to have attitudes indicating desire for a perfect lawn. Similar to respondents in cluster 5, they generally did not believe that managing a lawn without using pesticides was time-consuming. Respondents in clusters 2 through 4 were the most interested in learning more about less toxic lawn care methods and the most willing to pay more for less toxic products. Respondents in cluster 5 were the least interested in learning more about, and paying more for, less toxic methods or products.
Figure 1.
Respondents' Attitudes About Lawns and Lawn Care by Cluster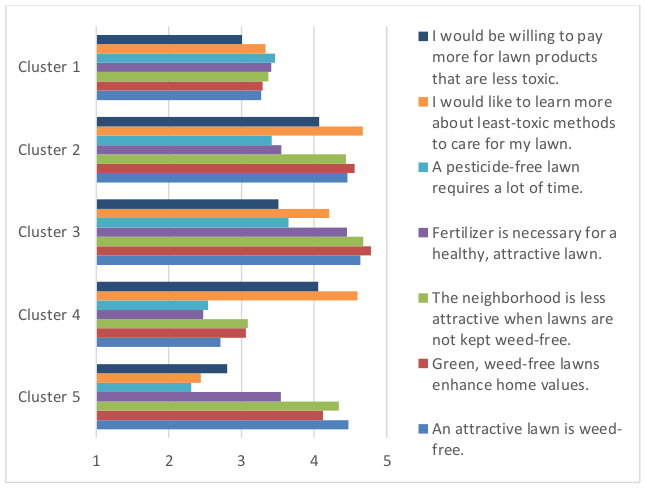
Note: Responses were on a Likert-type scale where
1 = strongly disagree and 5 = strongly agree.
Respondents were asked to indicate which of several statements about IPM were true by checking a box in front of the statement (Figure 2). Numerical values below 1.5 indicate that more of the respondents in that cluster believed a statement was true. Values above 1.5 indicate that more respondents in the cluster believed it to be not true. All of the statements shown in Figure 2 are true except the statement "Pests should be treated as soon as you discover them," which is false (the correct answer is not to check the box). Respondents across all five clusters correctly responded to four of the five statements (according to the median answer within each cluster). However, more respondents in cluster 4 checked the correct boxes than respondents in other clusters did. With a median response of 1.5, respondents in cluster 5 were on the fence about whether pests should be managed only if they are causing significant damage.
Figure 2.
Respondents' Knowledge of Integrated Pest Management (IPM) Principles by Cluster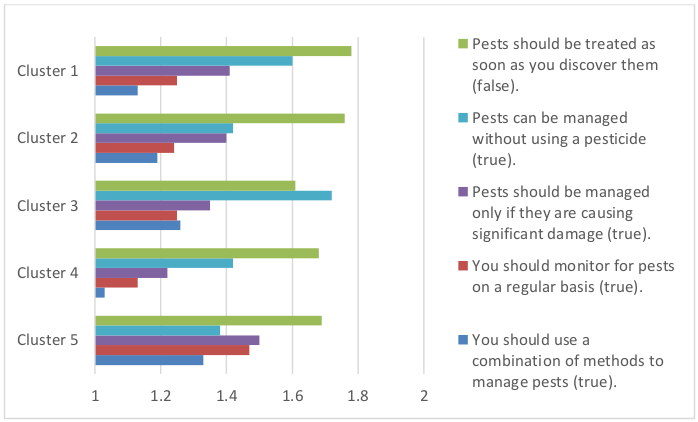
Note: Respondents were asked to check a box to indicate that they thought a statement about IPM was true. 1 = box checked and indicates true; 2 = box not checked and indicates false.
Discussion
We used our analysis to uncover IPM-related knowledge deficits and demonstrated interests of cluster members to design educational messages and delivery methods (Andreasen, 1995). In this section, we describe these elements for each cluster (background) and identify examples of how we used the information from our analysis (educational strategy).
Cluster 1: Insect-Averse
Background
Cluster 1 had proportionally more members 60 years of age or older than the other clusters did, and nearly 40% were avid or professional gardeners (Table 1). This group was less likely than others to believe that a green, weed-free lawn enhances home values and was less concerned about weeds reducing the neighborhood's attractiveness (Figure 1). However, they used insecticides more frequently than other groups (data not shown). Members of this group were not as open as others to learning about less toxic pest control methods and were not as likely as others to pay more for less toxic pest control products (Figure 1). This group was more likely to try to eradicate all insects rather than manage their numbers in the landscape (data not shown). They were less likely to believe that pests can be managed without using pesticides (Figure 2).
Educational Strategy
Existing knowledge can make it difficult to learn new information, especially if it is in conflict with what was previously learned (National Research Council, 2000). Members of cluster 1 are older and, therefore, may have had more experiences in conflict with our IPM messages. Absorbing those messages may pose a challenge. To overcome this resistance, carefully selecting the voice behind the message is important (Andreasen, 1995). Members of cluster 1 may respond positively to personal one-on-one interactions with friends, family, neighbors, or nursery employees—people whose opinions they value and trust. Inroads may be made by focusing on using pesticides safely. We targeted this group by developing a public service announcement (PSA) featuring a man spraying his wife's roses. His wife interrupts to remind him that he sprayed the roses the previous week and that overuse of pesticides could harm her plants and the good bugs that protect them.
Cluster 2: Pesticide-Averse Lawn Lovers
Background
Members of cluster 2 strongly believed in the desirability of a weed-free lawn (Figure 1). However, they preferred not to use pesticides (Table 2), believing that pesticides are not necessarily safe and may contaminate drinking water and groundwater (data not shown). They would be willing to pay more for less toxic lawn and garden products and expressed a desire to learn more about such products (Figure 1). They were more familiar than most groups with methods for reducing the need for pesticides (data not shown), and they correctly identified the true statements about IPM (Figure 2).
Educational Strategy
Our inroads to members of cluster 2 are their avid interest in gardening (Table 1), their preference for finding alternatives to pesticides (Table 2), their desire to learn more about less toxic pest control methods (Figure 1), and their knowledge of IPM principles (Figure 2). A good share of this group's members were younger than 60 (Table 1). We developed an IPM website (www.manageNVpests.info) and Facebook page (www.facebook.com/NevadaUrbanIPM) to help them learn about less toxic pest management methods. We also began offering classes on this and other garden IPM subjects during evening hours, when they were more likely to be able to attend. This is a group we hope to mine for potential master gardener volunteers.
Cluster 3: Weed-Averse Lawn Lovers
Background
Members of cluster 3 reported heavier use of herbicides than others (data not shown). An attractive, weed-free lawn was very important to them (Figure 1). They also were the most likely to believe that a green, weed-free lawn enhanced home values and neighborhood attractiveness and that fertilizer was necessary for a healthy, attractive lawn (Figure 1). "Rapid results" was considered of prime importance to them when purchasing a pesticide (data not shown). However, they were open to learning more about lower risk products (Figure 1). As with respondents in cluster 1, they did not believe that pests can be managed without pesticides (Figure 2). However, they were the group most likely to read product labels (data not shown).
Educational Strategy
As the ages and other demographic characteristics of respondents in cluster 3 are similar to those of members of cluster 2 (Table 1), many of the same message-delivery strategies developed for cluster 2 should work with this group, including our website and Facebook page. Our inroads to them are their desire for a healthy, attractive lawn and their openness to learning more about less toxic lawn care methods. Our "Mow High" PSA features a husband and wife discussing their neighbor's healthy, green lawn. The wife confides that the neighbor sets his mower to its highest setting and suggests that they try this strategy too to see whether their lawn can look as good as their neighbor's. Another PSA features neighbors looking at the label of a weed-and-feed-type fertilizer and discovering that it contains a weed killer, when all they really want is "lawn food."
Cluster 4: IPM Savvy
Background
Cluster 4 was a highly educated group. Almost half had a postgraduate degree (Table 1). One third were certified master gardeners, and nearly 85% were 45 or older (Table 1). Most reported never using weed-and-feed-type products, and they preferred not to use pesticides (Table 2). An attractive weed-free lawn was not important to them (Figure 1). They were interested in learning more about lower risk pest control methods and were willing to pay more for less toxic products (Figure 2). Members of cluster 4 had the greatest familiarity with IPM principles (Figure 2). They understood that regular monitoring for pests is important and that pests should be managed only if they are causing significant damage.
Educational Strategy
Most members of this group are highly educated, are open to further education, and already understand and use many IPM practices on a regular basis. Our strategy for them is to provide advanced classes to strengthen their commitment to using IPM and deepen the extent of their knowledge. This group is an important ally to Extension in teaching others about IPM principles and practices.
Cluster 5: What's IPM?
Background
Greater than two thirds of cluster 5 members were male (Table 1). Most had not heard of IPM and were not likely to use it (Table 2). An attractive, weed-free lawn was very important to them (Figure 1), and they were willing to apply pesticides and fertilizers to keep it looking that way (data not shown). The relative safety of pesticides used in their yards was not important to them (data not shown), and they were not interested in learning more about lower risk methods (Figure 1). They were less likely than other groups to believe that pests should be managed only if they are causing significant damage, and many were unaware of the need for monitoring for pests (Figure 2). They reported that pesticides were never applied to their lawns, yet they also reported that weed-and-feed-type products were used on their lawns (Table 2). This circumstance reveals that they did not understand that such products contain a pesticide.
Educational Strategy
Members of cluster 5 had the most cavalier attitudes about pesticides and the most misconceptions regarding their use. It is important to reach this group with IPM messages because improper use and overuse of pesticides could be behaviors of the group's members. We developed two PSAs that target this group. One features neighbors discussing the fact that weed-and-feed-type products contain a pesticide and might not be the best solution for every lawn. In the other PSA, a man is staring at a wall of pesticides in a garden center when a second man approaches and they commiserate about how confusing it is to have so many choices. The second man suggests that they peel back the label to read whether a product can be used on grass, explaining "because you wouldn't want to kill your whole lawn." In a subtle way, this PSA reminds the viewer that pesticides can be plant killers and, when used improperly, may do more harm than good.
Conclusions
We designed our survey to learn about IPM-related behaviors and attitudes of the public in western Nevada, and we used cluster analysis to delve more deeply into our data. Cluster analysis allowed us to define groups with members more similar to one another than to members of other groups. The analysis enabled us to develop highly specific, targeted educational strategies most likely to reach members of the various groups with an IPM message. This method can be used across a wide range of Extension disciplines in which behavior change is the desired result of educational efforts.
Cluster analysis is not a difficult technique. However, some Extension professionals may lack the background in statistics to understand its subtleties. Our research team included a faculty member from the College of Education who is experienced in using this technique for improving educational outcomes. We did not initially design our survey for cluster analysis, so not all data could be analyzed this way. Extension professionals wanting to use the technique should consider collaborating with someone familiar with it prior to designing a survey.
References
Andreasen, A. R. (1995). Marketing social change: Changing behavior to promote health, social development, and the environment. San Francisco, CA: Jossey-Bass.
Antonenko, P. D., Toy, S., & Niederhauser, D. S. (2012). Using cluster analysis for data mining in education technology research. Educational Technology Research and Development, 60(3), 383–398. doi:10.1007/s11423-012-9235-8
Bardon, R. E., Hazel, D., & Miller, K. (2007). Preferred information delivery methods of North Carolina forest landowners. Journal of Extension, 45(5) Article 5FEA3. Available at: https://www.joe.org/joe/2009october/a4.php
Lefebvre, R. C. (2013). Social marketing and social change: Strategies and tools for improving health, well-being, and the environment. San Francisco, CA: Jossey-Bass.
Loria, K. (2013). Community garden information systems: Analyzing and strengthening community-based resource sharing networks. Journal of Extension, 51(2) Article 2FEA6. Available at: https://www.joe.org/joe/2013april/a6.php
Mangiafico, S. S., Obropta, C. C., & Rossi-Griffin, E. (2012). Demographic factors influence environmental values: A lawn-care survey of homeowners in New Jersey. Journal of Extension, 50(1) Article 1RIB6. Available at: https://www.joe.org/joe/2012february/rb6.php
McKenzie-Mohr, D. (2011). Fostering sustainable behavior: An introduction to community-based social marketing (3rd ed.). Gabriola Island, BC, Canada: New Society Publishers.
Monaghan, P., Ott, E., Wilber, W., Gouldthorpe, J., & Racevskis, L. (2013). Defining audience segments for Extension programming using reported water conservation practices. Journal of Extension, 50(6) Article 6FEA8. Available at: https://www.joe.org/joe/2013december/a8.php
National Research Council. (2000). How people learn. Washington, DC: National Academies Press.
Skelly, J., Hill, G., & Singletary, L. (2014). Probing needs assessment data in depth to target programs more effectively. Journal of Extension, 52(2) Article 2RIB1. Available at: https://www.joe.org/joe/2014april/rb1.php
Wilbur, J. (2006). Getting your feet wet with social marketing: A social marketing guide for watershed programs. Salt Lake City, UT: Utah Department of Agriculture and Food.