December 2017
|
December 2017 // Volume 55 // Number 6 // Tools of the Trade // v55-6tt8


Visionmaker.NYC: An Online Landscape Ecology Tool to Support Social-Ecological System Visioning and Planning
Abstract
The Welikeia project and the corresponding free online tool Visionmaker.NYC focus on the historical landscape ecologies of New York City. This article provides a brief introduction to online participatory tools, describes the Visionmaker tool in detail, and offers suggested ways to use the tool for Extension professionals based in and outside New York City. This information provides a basis for best practices Extension professionals can apply when using Visionmaker to support ecological thinking and participatory planning to catalyze change among urban residents.
Introduction
Citizen science and advances in digital technologies, such as digital mapping, make it possible to intentionally and expansively involve the public in the production of knowledge (Newman et al., 2012). In urban ecological contexts, mapping has been used by environmental stewards and advocates who create and use maps for management and activist purposes (Aberley, 1993; Crampton & Krygier, 2005; Newman et al., 2010). Furthermore, researchers have successfully used virtual, field, and story map activities associated with web GIS for experiential learning about plant species (Estwick, Griffin, James, & Roberson, 2016). Others have created landscape visualization of climate change to support on-the-ground scenario planning (Sheppard et al., 2011). Broadly speaking, participatory processes demonstrate the value various stakeholders bring to environmental decision making and climate adaptation planning as they simultaneously accrue community benefits from a transparent planning process (Adger, 2003; Beirle, 2002; Tompkins & Adger, 2004). Including diverse stakeholders in the planning process increases the legitimacy of planning decisions and participation in implementation of those decisions (Campbell & Vainio-Mattila, 2003; Reed, 2008). Fortunately advances in decision-support theory (Wilson & Arvai, 2011), ecosystem models (Barbier, 2012; Nobre et al., 2010), multimedia studies (Nucci & Kubey, 2010), and Internet-enabled crowdsourcing (Shirky, 2008) provide new avenues for scientifically informed community engagement about ecosystem resilience to climate change.
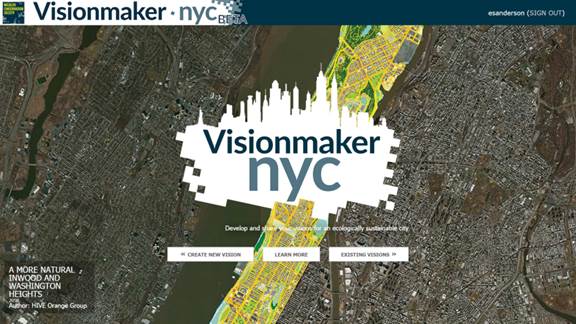
The aforementioned elements—application of technological advances, consideration of theoretical models, and climate-related community engagement—are manifested in a new tool we developed: Visionmaker.NYC (hereafter Visionmaker). The tool is described herein and is available at http://visionmaker.nyc/jamaicabay. Figure 1 shows the tool's front page.
Figure 1.
Visionmaker Front Page
Description of Visionmaker
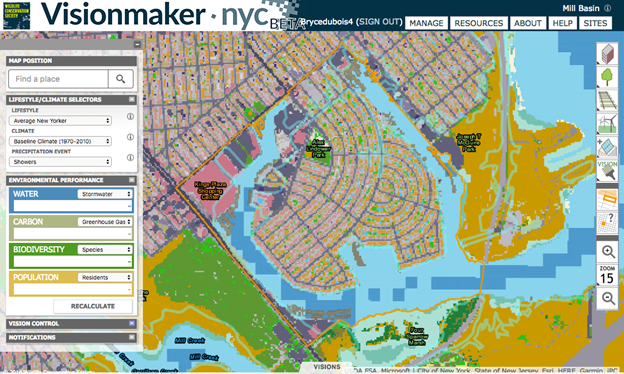
Visionmaker offers an opportunity to support Extension programs in watershed management through deliberation and social engagement. It is a landscape visualization tool that offers users the ability to reimagine urban ecosystems. Visionmaker is focused on the geographic region of New York City (hereafter NYC), a city of 8.4 million people (U.S. Census, 2016), but is open to use by anyone in the world with an interest in historical ecology, urban development, watershed management, and visioning the future of an ecosystem. Visionmaker gives users a data-driven forum for democratic exploration and discovery by allowing them to map and measure the sustainability of their vision through ecological performance metrics (Hester, 2006). Matching Sheppard's (2015) principles of using local, visual, and connected interfaces to engage the public on climate change, Visionmaker enables people to develop and share climate-resilient designs based on factors of environmental performance; specifically Visionmaker models water, carbon, biodiversity, and population (Figure 2). Users can create their own visions by modifying spatially explicit ecosystem distributions (both built and natural ecosystems), choosing the lifestyles of the people living there (average New Yorker, average American, average global citizen, Lenape Native American, and eco-conscious citizen), and selecting from different date-based climate scenarios (1609, 1970–2010, 2020s, 2050s, 2080s), including scenarios around sea-level rise. Sixty-four environmental metrics (including greenhouse gas emissions, combined sewer flows, species diversity, and daytime population density) are calculated for a user-defined vision. Metrics are also calculated for that same area of the city as it existed 400 years ago (based on data from the Welikeia Project) (Sanderson, 2009). Once the user has completed a vision, the interface allows the user to keep the vision private, share it with a set of other users, or share it with the public. The website includes instructional videos and descriptive materials about Visionmaker.
Figure 2.
Example Vision of Brooklyn's Mill Basin Neighborhood in Visionmaker
Using Visionmaker in Outreach and Education
Visionmaker has been used in formal and informal education contexts, as well as with land managers, researchers, and other professional audiences. Here we provide ideas for applying Visionmaker, for both NYC-based Extension professionals and those located elsewhere. We identified these opportunities through outreach efforts conducted by our project team, including feedback sessions during a 2015–2016 workshop series that included Extension professionals in NYC. During those sessions, we sought feedback from participants regarding how they anticipated using Visionmaker in their work or other applications.
NYC-based Extension professionals can present visioning sessions to facilitate community discussions (especially with civic groups such as community boards) on areas the community members believe need improvement. These conversations can be oriented around neighborhood concerns, especially projected sea-level rise and storm water management (e.g., rationale for replacing parking lots with green infrastructure). Using Visionmaker in this way gives users the ability to see what land exists, why, and what impact that has on storm water. In outreach contexts, Visionmaker is a tool for rapid modeling and visualization of landscape restoration projects' storm water runoff. Visionmaker also could be used in tandem with a walking tour on the city's waterfront to facilitate discussions of ecosystems and development. Finally, NYC-based Extension professionals could use it to tell the history of a case study through the tool's "backcasting" capability, making it possible to describe and show urban development from 1609 to the present day.
For Extension professionals outside NYC, Visionmaker is an appealing tool for getting communities to think about history, ecology, and the urbanization process. Visionmaker allows a user to examine the impact of past, present, and future climate scenarios and to compare the impacts of human consumption levels associated with various lifestyles (e.g., eco-conscious). The user also can manipulate precipitation events such as the occurrence of severe storms or showers while varying ecosystem parameters such as the extent of green roofs, composting, and solar panels in the community. Components of the built ecosystem and transportation, such as the number of warehouses, single-family homes, or parking lots, also can be manipulated. Visionmaker is an easy tool through which to investigate urban development and urban ecology.
In more formal university or educational settings, Visionmaker is particularly useful. The tool can be used for introducing undergraduate or graduate students to ecosystem modeling and environmental science and sustainability topics appropriate for environment, design, or planning students. The tool allows students to visualize what a sustainable city might look like and supports education around integrated social-ecological systems, which in turn supports critical discussions around issues relating to development and environmental governance.
Conclusion
For Extension professionals, Visionmaker is a unique tool that can support applied projects and outreach efforts along with educational programming around social-ecological system thinking. The tool offers a unique opportunity to have a conversation around urban social-ecological systems and historical landscape changes while also inviting participation and exploration for the future.
References
Aberley, D. (1993). Boundaries of home: Mapping for local empowerment. Gabriola Island, BC: New Society Publishers.
Adger, W. N. (2003). Social capital, collective action, and adaptation to climate change. Economic Geography, 79(4), 387–404.
Barbier, E. B. (2012). A spatial model of coastal ecosystem services. Ecological Economics, 78, 70–79.
Beirle, T.C. (2002). The quality of stakeholder-based decisions. Risk Analysis, 22, 739–749.
Campbell, L. M., & Vainio-Mattila, A. (2003). Participatory development and community-based conservation: Opportunities missed for lessons learned? Human Ecology, 31, 417–437.
Crampton, J. W., & Krygier, J. (2005). An introduction to critical cartography. ACME: An International E-Journal for Critical Geographies, 4(1), 11–33.
Estwick, N. M., Griffin, R. W., James, A. A., & Roberson, S. G. (2016). Enhancing Extension and research activities through the use of web GIS. Journal of Extension, 54(5), Article 5IAW3. Available at: https://joe.org/joe/2016october/iw3.php
Hester, R. T. (2006). Design for ecological democracy. Cambridge, MA: MIT Press.
Newman, G., Wiggins, A., Crall, A., Graham, E., Newman, S., & Crowston, K. (2012). The future of citizen science: Emerging technologies and shifting paradigms. Frontiers in Ecology and the Environment, 10(6), 298–304.
Newman, G., Zimmerman, D., Crall, A., Laituri, M., Graham, J., & Stapel, L. (2010). User-friendly web mapping: Lessons from a citizen science website. International Journal of Geographical Information Science, 24(12), 1851–1869.
Nobre, A. M., Ferreira, J. G., Nunes, J. P., Yan, X., Bricker, S., Corner, R., . . . & Lan, D. (2010). Assessment of coastal management options by means of multilayered ecosystem models. Estuarine, Coastal and Shelf Science, 87(1), 43–62.
Nucci, M. L., & Kubey, R. (2010). Television and science: How the media shapes the public's understanding of crucial new developments. Television Quarterly. Retrieved from http://www.tvquarterly.net/tvq_39_1/05_television_and_science.htm
Reed, M. S. (2008). Stakeholder participation for environmental management: A literature review. Biological Conservation, 141(10), 2417–2431.
Sanderson, E. W. (2009). Mannahatta: A natural history of New York City. New York, NY: Abrams.
Sheppard, S. R. (2015). Making climate change visible: A critical role for landscape professionals. Landscape and Urban Planning, 142, 95–105.
Sheppard, S. R., Shaw, A., Flanders, D., Burch, S., Wiek, A., Carmichael, J., & Cohen, S. (2011). Future visioning of local climate change: A framework for community engagement and planning with scenarios and visualization. Futures, 43(4), 400–412.
Shirky, C. (2008). Here comes everybody: The power of organizing without organizations. New York, NY: Penguin Press.
Tompkins, E. L., & Adger, W. N. (2004). Does adaptive management of natural resources enhance resilience to climate change? Ecology and Society, 9(2), 10–23.
U.S. Census Bureau, Population Estimates Program (2016). QuickFacts – New York City, New York. Retrieved October 29, 2017, from https://www.census.gov/quickfacts/fact/table/newyorkcitynewyork/PST045216
Wilson, R. S., & Arvai, J. L. (2011). Structured decision-making. Corvallis, OR: Oregon Sea Grant.