August 2017
|
August 2017 // Volume 55 // Number 4 // Tools of the Trade // v55-4tt6


Maximizing Use of an Extension Beef Cattle Data Set: Part 2—Reproductive Rates
Abstract
Previously, we described CHAPS20Y, a historical data set, and trends in CHAPS20Y calving distributions. In this article, we describe reproductive rates, including total females exposed to bull(s), pregnancy, pregnancy loss, calving, calf death loss, weaning, culling, and replacement percentages. Yearly mean exposed females increased from 1994 through 2013, consistent with a greater replacement percentage versus culling percentage. Yearly mean reproductive percentages varied over time. Factors such as weather, body condition, temperament, nutrition, and health likely contributed to this variation. CHAPS20Y is a tool Extension professionals can use to understand beef reproductive rates and help producers set and achieve their herd management goals.
Introduction
We used data from Cow Herd Appraisal Performance Software (CHAPS) to create CHAPS20Y, a 20-year beef herd data set spanning from 1994 through 2013, as an Extension tool for understanding trends in beef production (Ramsay, Hulsman Hanna, & Ringwall, 2016). In Part 1 of this series, we described calving distribution data from CHAPS20Y (Ramsay, Hulsman Hanna, & Ringwall, 2017). In this article, we describe CHAPS20Y reproductive rate data, including
- total numbers of females exposed to bull(s), hereafter referred to as total exposed females;
- pregnancy, calving, and weaning percentages;
- pregnancy loss and calf death loss percentages; and
- culling and replacement percentages.
Herein we describe CHAPS20Y reproductive rate data to provide background for other Extension professionals who are working to help beef producers set and achieve herd management goals. We present yearly means, 20-year averages, and linear trends over time.
Describing Reproductive Rate Data
Total Exposed Females
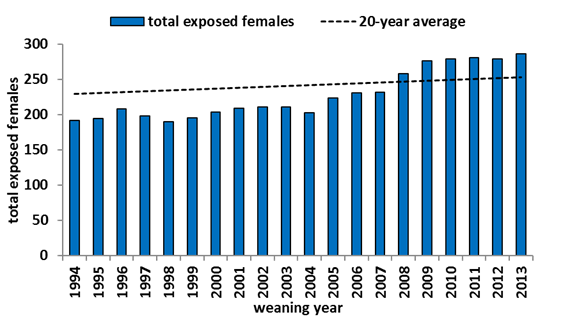
CHAPS defines total exposed females as the number of females exposed to at least one bull plus any pregnant culled females for a selected date range—from one breeding season to the next—which spans approximately 1 year (Ramsay et al., 2016). For CHAPS20Y, the yearly mean total exposed females ranged from 192 to 286, with a 20-year average of 228 (Figure 1).
Figure 1.
Yearly Mean Number of Females Exposed to Bull(s) with 20-Year Average Trend Line
Reproductive Percentages
The CHAPS program calculates percentages related to various aspects of reproduction (reproductive percentages) according to Beef Improvement Federation (2010) guidelines and recommendations put forth by Ringwall & Berg (1990). For most of the calculations, CHAPS uses an "adjusted total exposed females" value, which is the number of total exposed females minus the number of pregnant culled females. In calculating reproductive percentages for each herd, CHAPS uses the following equations (multiplying the results of each equation by 100):
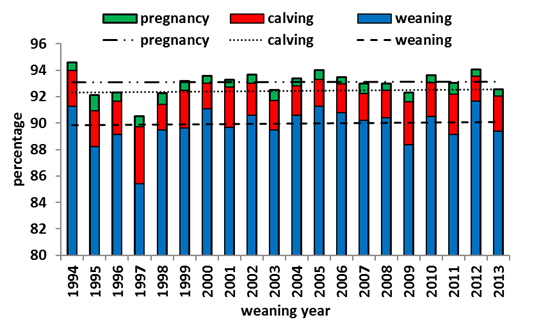
Yearly cumulative mean pregnancy, calving, and weaning percentages for CHAPS20Y are displayed in Figure 2. Pregnancy percentages ranged from 90.5% to 94.6%, with a 20-year average of 93.0%. Calving percentages ranged from 89.7% to 94.0%, with a 20-year average of 92.3%. Weaning percentages ranged from 85.4% to 91.6%, with a 20-year average 89.8%.
Figure 2.
Yearly Mean Pregnancy, Calving, and Weaning Percentages with 20-Year Average Trend Lines
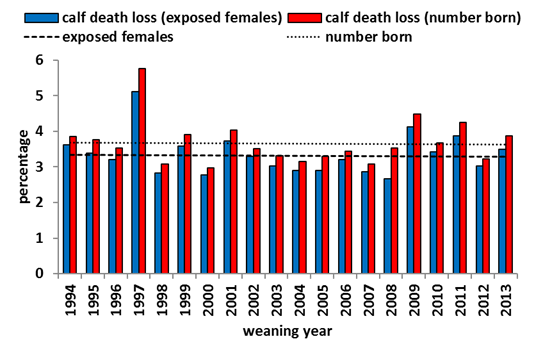
As shown in Figure 3, yearly mean pregnancy loss percentages ranged from 0.5% to 1.3%, with a 20-year average of 0.74%. Figure 4 shows that yearly mean percentages of calf death losses relative to the number of exposed females ranged from 2.7% to 5.1%, with a 20-year average of 3.4%, and that yearly mean percentages of calf death losses relative to the number of calves born ranged from 3.0% to 5.8%, with a 20-year average of 3.7%.
Figure 3.
Yearly Mean Pregnancy Loss Percentages with 20-Year Average Trend Line
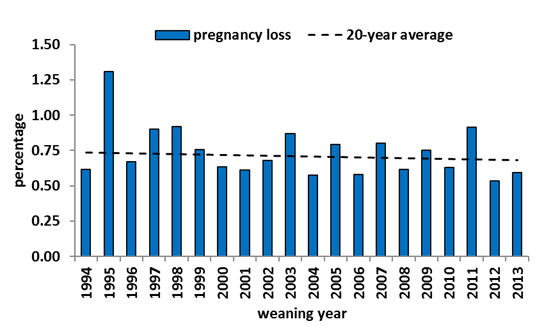
Figure 4.
Yearly Mean Calf Death Loss Percentages (Relative to the Number of Exposed
Females and the Number of Calves Born) with 20-Year Average Trend Lines
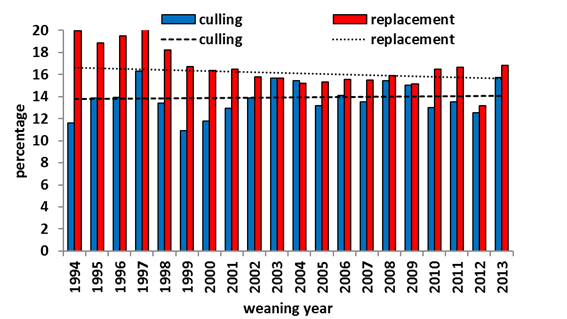
Yearly mean culling percentages and replacement percentages are shown in Figure 5. Culling percentages ranged from 10.9% to 16.3%, with a 20-year average of 13.8%, and replacement percentages ranged from 13.2% to 20.3%, with a 20-year average of 16.7%.
Figure 5.
Yearly Mean Culling and Replacement Percentages with 20-Year Average Trend Lines
Yearly Minimums and Maximums
To demonstrate herd-to-herd variation in the CHAPS20Y data set, we present yearly herd minimums and maximums for total exposed females (Table 1); pregnancy, calving, and weaning percentages (Table 2); pregnancy loss and calf death loss percentages (Table 3); and culling and replacement percentages (Table 4).
| Year | Total exposed females | |
| Min. | Max. | |
| 1994 | 70 | 428 |
| 1995 | 76 | 403 |
| 1996 | 71 | 490 |
| 1997 | 60 | 498 |
| 1998 | 52 | 577 |
| 1999 | 61 | 560 |
| 2000 | 58 | 555 |
| 2001 | 73 | 597 |
| 2002 | 63 | 605 |
| 2003 | 62 | 596 |
| 2004 | 61 | 580 |
| 2005 | 54 | 978 |
| 2006 | 55 | 1,071 |
| 2007 | 61 | 907 |
| 2008 | 60 | 902 |
| 2009 | 62 | 1,023 |
| 2010 | 58 | 984 |
| 2011 | 61 | 1,008 |
| 2012 | 51 | 964 |
| 2013 | 66 | 1,088 |
| Year | Pregnancy | Calving | Weaning | |||
| Min. | Max. | Min. | Max. | Min. | Max. | |
| 1994 | 85 | 99 | 82 | 98 | 82 | 97 |
| 1995 | 86 | 98 | 78 | 97 | 68 | 96 |
| 1996 | 79 | 99 | 79 | 99 | 75 | 99 |
| 1997 | 78 | 100 | 78 | 99 | 68 | 99 |
| 1998 | 80 | 99 | 77 | 99 | 77 | 97 |
| 1999 | 75 | 99 | 75 | 98 | 70 | 99 |
| 2000 | 77 | 100 | 77 | 100 | 76 | 100 |
| 2001 | 87 | 100 | 86 | 99 | 78 | 97 |
| 2002 | 82 | 100 | 81 | 100 | 80 | 100 |
| 2003 | 78 | 100 | 76 | 100 | 73 | 100 |
| 2004 | 66 | 100 | 66 | 100 | 66 | 100 |
| 2005 | 85 | 100 | 84 | 100 | 80 | 100 |
| 2006 | 78 | 100 | 76 | 100 | 76 | 99 |
| 2007 | 79 | 100 | 76 | 100 | 76 | 100 |
| 2008 | 80 | 100 | 80 | 100 | 75 | 100 |
| 2009 | 72 | 100 | 72 | 100 | 65 | 100 |
| 2010 | 79 | 100 | 78 | 100 | 77 | 100 |
| 2011 | 80 | 100 | 77 | 100 | 68 | 100 |
| 2012 | 86 | 100 | 86 | 100 | 83 | 100 |
| 2013 | 76 | 100 | 76 | 100 | 69 | 100 |
| Year | Pregnancy loss | Calf death lossa | Calf death lossb | |||
| Min. | Max. | Min. | Max. | Min. | Max. | |
| 1994 | 0 | 3 | 0 | 7 | 0 | 8 |
| 1995 | 0 | 12 | 0 | 12 | 0 | 15 |
| 1996 | 0 | 3 | 0 | 9 | 0 | 10 |
| 1997 | 0 | 6 | 1 | 25 | 1 | 30 |
| 1998 | 0 | 4 | 0 | 6 | 0 | 7 |
| 1999 | 0 | 3 | 0 | 11 | 0 | 12 |
| 2000 | 0 | 3 | 0 | 8 | 0 | 8 |
| 2001 | 0 | 4 | 0 | 11 | 0 | 12 |
| 2002 | 0 | 4 | 0 | 10 | 0 | 10 |
| 2003 | 0 | 13 | 0 | 10 | 0 | 11 |
| 2004 | 0 | 5 | 0 | 12 | 0 | 13 |
| 2005 | 0 | 8 | 0 | 10 | 0 | 13 |
| 2006 | 0 | 3 | 0 | 13 | 0 | 14 |
| 2007 | 0 | 11 | 0 | 9 | 0 | 9 |
| 2008 | 0 | 6 | 0 | 8 | 0 | 9 |
| 2009 | 0 | 8 | 0 | 21 | 0 | 21 |
| 2010 | 0 | 4 | 0 | 12 | 0 | 13 |
| 2011 | 0 | 11 | 0 | 12 | 0 | 14 |
| 2012 | 0 | 4 | 0 | 10 | 0 | 11 |
| 2013 | 0 | 5 | 0 | 11 | 0 | 12 |
| aTotal exposed females. bTotal number of calves born. | ||||||
| Year | Culling | Replacement | ||
| Min. | Max. | Min. | Max. | |
| 1994 | 4 | 27 | 3 | 42 |
| 1995 | 5 | 35 | 7 | 45 |
| 1996 | 4 | 31 | 6 | 50 |
| 1997 | 5 | 40 | 8 | 66 |
| 1998 | 0 | 25 | 6 | 30 |
| 1999 | 0 | 31 | 1 | 39 |
| 2000 | 5 | 30 | 5 | 38 |
| 2001 | 5 | 29 | 1 | 33 |
| 2002 | 3 | 30 | 5 | 37 |
| 2003 | 1 | 45 | 1 | 30 |
| 2004 | 3 | 57 | 5 | 45 |
| 2005 | 1 | 57 | 2 | 64 |
| 2006 | 2 | 74 | 1 | 68 |
| 2007 | 0 | 52 | 1 | 57 |
| 2008 | 5 | 53 | 0 | 30 |
| 2009 | 3 | 38 | 0 | 24 |
| 2010 | 0 | 30 | 0 | 50 |
| 2011 | 4 | 32 | 0 | 40 |
| 2012 | 0 | 41 | 0 | 23 |
| 2013 | 6 | 78 | 0 | 33 |
Using CHAPS20Y Reproductive Rate Data to Increase
Extension Knowledge
We have demonstrated that an increase in total exposed females in CHAPS20Y herds occurred over time. Replacement percentages were greater than culling percentages for all years. Both pregnancy loss and replacement percentages showed slight decreases over time. All reproductive percentages varied from year to year, and herd minimums and maximums varied to a greater extent. In this section, we outline possible causes of these trends and variations.
Total Exposed Females and Culling and Replacement Percentages
In CHAPS20Y herds, yearly mean total exposed females increased 33% over the 20-year period. Similarly, from 1990 to 2010, the size of all CHAPS herds increased 38%, from 141 to 228 (Ringwall, 2011). Each year CHAPS20Y replacement percentages exceeded culling percentages, contributing to increases in herd size. This follows a trend of producers' expanding herd sizes during favorable market conditions (Estes, 2015).
Weather affects culling and replacement percentages. During droughts, producers may cull more and replace less to minimize feed costs (Ringwall, 2012). In 2012, drought conditions occurred in the northern plains (National Oceanic and Atmospheric Administration, 2013), where most CHAPS20Y herds are located (Ramsay et al., 2016). CHAPS20Y culling percentages increased during this period. Cows are also culled because of poor reproductive performance, health, and disposition, as well as due to age and physical problems (Powell, 2013).
Pregnancy, Calving, and Weaning Percentages, Including Death Losses
Pregnancy, calving, and weaning percentages are interrelated measures of reproductive success affected by pregnancy loss and calf death loss. Poor weather may explain some of the variation in CHAPS20Y pregnancy loss and calf death loss. In 1997, a spring storm caused a spike in calf death losses among CHAPS herds (Ringwall, 2015). During the winter of 1996–1997, the northern plains received up to 200% of normal precipitation, including 100 in. of snow (Macek-Rowland, Burr, & Mitton, 2001). Calf deaths increase as precipitation increases and temperature decreases (Azzam et al., 1993).
Dam condition, temperament, nutrition, and health also affect reproduction. Cows with higher than average body fat have higher pregnancy rates and reduced pregnancy losses compared to thinner cows (Herd & Sprott, 1998), whereas aggressive cows have reduced reproductive rates (Cooke, Bohnert, Cappellozza, Mueller, & DelCurto, 2012). Proper nutrition and herd health are important for optimizing reproduction (Perry, Daly, & Melroe, 2009). Health and vaccination history affect pregnancy loss and calf death loss (Waldner & Kennedy, 2008; Wenzel & Hanosh, 2011). All these factors likely contributed to herd-to-herd and year-to-year variation in CHAPS20Y reproductive rates.
Conclusion
Using CHAPS20Y as a tool of the trade, we have added to the Extension knowledge base and broadened Extension thinking on beef cattle reproductive rates. Additionally, we have identified some of the factors affecting reproductive rates. Extension professionals can use this information to help producers manage their herds to achieve their goals.
Acknowledgments
We thank Lee Tisor, Wanda Ottmar, and Michelle Stolz for their management of the CHAPS database.
References
Azzam, S. M., Kinder, J. E., Nielsen, M. K., Werth, L. A., Gregory, K. E., Cundiff, L. V., & Koch, R. M. (1993). Environmental effects on neonatal mortality of beef calves. Journal of Animal Science, 71, 282–290. Retrieved from http://digitalcommons.unl.edu/animalscifacpub/481
Beef Improvement Federation. (2010). Guidelines for uniform beef improvement programs (9th ed.) (revised September 2016). Retrieved from http://beefimprovement.org/content/uploads/2013/07/BIFGuidelinesFinal_updated0916.pdf
Cooke, R. F., Bohnert, D. W., Cappellozza, B. I., Mueller, C. J., & DelCurto, T. (2012). Effects of temperament and acclimation to handling on reproductive performance of Bos taurus beef females. Journal of Animal Science, 90, 3547–3555. Retrieved from https://www.animalsciencepublications.org/publications/jas/pdfs/90/10/3547
Estes, S. (2015). National cattle herd numbers on the rise. Retrieved from http://www.hpj.com/livestock/national-cattle-herd-numbers-on-the-rise/article_839e6e8d-ef7a-5c2c-86fe-c8f2b5c895d3.html
Herd, D. B., & Sprott, L. R. (1998). Body condition, nutrition and reproduction of beef cows. Retrieved from http://agrilifecdn.tamu.edu/victoriacountyagnr/files/2010/07/Body-Condition-Nutrition-Reproduction-of-Beef-Cows.pdf
Macek-Rowland, K. M., Burr, M. J., & Mitton G. B. (2001). Precipitation in the northern plains, September 1996 through April 1997. Retrieved from https://pubs.er.usgs.gov/publication/cir1185A
National Oceanic and Atmospheric Administration. (2013). National Centers for Environmental Information, state of the climate: Drought for annual 2012. Retrieved from http://www.ncdc.noaa.gov/sotc/drought/201213
Perry, G., Daly, R., & Melroe, T. (2009). Increasing your calf crop by management, pregnancy testing, and breeding soundness examination of bulls. Retrieved from http://pubstorage.sdstate.edu/AgBio_Publications/articles/ExEx2068.pdf
Powell, J. (2013). Culling the beef cow herd. Retrieved from https://www.uaex.edu/publications/PDF/FSA-3092.pdf
Ramsay, J. M., Hulsman Hanna, L. L., & Ringwall, K. A. (2016). Maximizing use of Extension beef cattle benchmarks data derived from Cow Herd Appraisal Performance Software. Journal of Extension, 54(3), Article 3TOT5. Available at: http://www.joe.org/joe/2016june/tt5.php
Ramsay, J. M., Hulsman Hanna, L. L., & Ringwall K. A. (2017). Maximizing use of an Extension beef cattle data set: Part 1—Calving distribution. Journal of Extension, 55(3), Article 3TOT5. Available at: https://joe.org/joe/2017june/tt5.php
Ringwall, K. A. (2011). BeefTalk: Twenty years of great beef production. Retrieved from https://www.ag.ndsu.edu/news/columns/beeftalk/beeftalk-twenty-years-of-great-beef-production/
Ringwall, K. A. (2012). BeefTalk: Understanding culling and replacement rates critical. Retrieved from https://www.ag.ndsu.edu/news/columns/beeftalk/beeftalk-understanding-culling-and-replacement-rates-critical/
Ringwall, K. A. (2015). BeefTalk: Nice weather for calving is priority one. Retrieved from https://www.ag.ndsu.edu/news/columns/beeftalk/beeftalk-nice-weather-for-calving-is-priority-one/
Ringwall, K. A., & Berg, P. M. (1990). CHAPS II: Cow Herd Appraisal Performance Software user guide. Retrieved from https://library.ndsu.edu/repository/handle/10365/22560
Waldner, C. L., & Kennedy, R. I. (2008). Associations between health and productivity in cow-calf beef herds and persistent infection with bovine viral diarrhea virus, antibodies against bovine viral diarrhea virus, or antibodies against infectious bovine rhinotracheitis virus in calves. American Journal of Veterinary Research, 69(7), 916–927. Retrieved from http://avmajournals.avma.org/doi/abs/10.2460/ajvr.69.7.916
Wenzel, J. C., & Hanosh, T. J. (2011). Pregnancy loss in beef cattle. Retrieved from http://aces.nmsu.edu/pubs/_b/B228.pdf