October 2016
|
October 2016 // Volume 54 // Number 5 // Research In Brief // v54-5rb6


Assessment of the Impact of Viticulture Extension Programs in Virginia
Abstract
The study discussed in this article assessed the impact of Virginia Cooperative Extension (VCE) on the Virginia wine grape industry. An online survey was developed and administered to members of the Virginia Vineyards Association. The results indicate that the resources and recommendations VCE and Virginia Tech have provided have been beneficial to Virginia grape growers, although growers who operate larger farms, produce wine commercially, or have higher levels of viticulture training are less likely to benefit from the relevant programs. Growers operating near where the programs are often delivered and those with higher levels of experience have benefited the most.
Introduction
The economic contribution of Cooperative Extension to U.S. agriculture has been significant and multifaceted. Some of Extension's most visible efforts involve the dissemination of technology and the facilitation of technology adoption, bridging the gap between findings in the lab and practices on the farm, and the fostering of increases in production efficiency. As a case in point, Virginia Tech University and Virginia Cooperative Extension (VCE) personnel have provided a range of educational resources to Virginia's grape and wine industries over the past 30 years. Extension educational tools used in the Virginia grape industry have included geographic information system (GIS) tools for site evaluation, a comprehensive wine grape production guide (Wolf, 2008), newsletters, workshops and demonstration projects, coordination and planning of annual technical conferences in concert with industry associations, and farm visits by VCE specialists and agents. Annual pest management guides, other Extension bulletins, and social media also have been used to disseminate information. Additionally, the first phase of an online tool for evaluating vineyard sites was launched in 2014 as an output of a U.S. Department of Agriculture/National Institute of Food and Agriculture project.
The Virginia wine and grape industries have rapidly expanded over the past 30 years, and Virginia is currently ranked fifth nationally with respect to wine grape production and number of wineries (U.S. Department of Agriculture, National Agricultural Statistics Service, 2014). The growth of Virginia's farm wine industry has occurred against a backdrop of increasing interest in wine and agritourism. Total and per capita wine consumption in the United States accelerated after the Second World War and attained 2.4 gal/person in 1986 (Wine Institute, 2014). Although consumption declined over the subsequent 7 years to 1.7 gal/person in 1993, it steadily rose to 2.8 gal/person in 2014 (Wine Institute, 2014). Although per capita wine consumption remains much lower than in some European countries, the United States has been the largest wine consuming nation since 2010 (Wine Institute, 2015). Almost 60% of that wine originates in California wineries, with imports and wine from other U.S. states contributing the balance (Wine Institute, 2014). Despite the dominance of California wine in American culture, all states have licensed wineries, and many states have industries with significant, measurable impacts on state agricultural revenues (Cristaldi, 2016).
Despite this apparent positive outlook, growth in the number of Virginia wineries and growth in wine sales have outpaced Virginia wine grape production. This circumstance poses a significant constraint because under federal law, the use of a U.S. appellation of origin (e.g., "Virginia") requires that no less than 75% of the volume of the wine be derived from grapes grown in the labeled appellation of origin (U.S. Department of the Treasury, Alcohol and Tobacco Tax and Trade Bureau, 2014). Market mechanisms appear to have failed to address this issue, and grape production that does not keep pace with the growing winery demand will slow continued industry expansion. Such market imbalance could be explained by a number of factors, but the primary constraints are the significant capital costs associated with vineyard establishment and the inherent risks of grape production in Virginia's variable climate. The Virginia Wine Board and industry associations have identified new vineyard plantings as a major objective for the wine industry to continue its growth and provided incentives for grape production that have included the Agriculture and Forestry Industries Development Fund and the Wineries and Vineyards Tax Credit program (Office of the Governor, 2015).
Although its role is educational and not promotional, VCE is poised to further contribute to growth and development of the Virginia wine industry. We developed an online industry survey to assess the past and current value of VCE's impact on the Virginia wine grape industry and to determine which resources have been most valued by producers. Although we were interested in past performance and impact, we also envisioned the survey results helping inform future educational programs. The survey was administered in 2014 to members of the Virginia Vineyards Association, which at the time comprised 305 wine grape growers and vintners. The organization is a grower-based networking and educational group that represents the majority of the Virginia wine grape industry.
Survey and Descriptive Statistics
The survey was designed to gauge the impact of Extension programs over the preceding 5-year period and, therefore, focused on outputs of that time frame. The questionnaire was designed by a team of viticulturists and an agricultural economist. The Dillman method of announcing the survey was used via electronic messages, followed by postcard reminder. The actual survey was then distributed electronically to grape growers across the state via Qualtrics, an online survey software (Dillman, Smyth, & Christian, 2014). Survey participants received no more than two reminders if they did not complete the survey.
A total of 86 positive responses were obtained, for a 28% response rate, which is below average response rates for impact evaluation web-based surveys (Archer, 2008). Nevertheless, the respondents made up a representative sample that provided a great deal of information, and in general, web-based surveys are found to have lower response rates than mail surveys (Shih & Fan, 2008). The respondents represented a total of 1,163 ac of vines, with an average vineyard size of 11.6 ac.
Figure 1 shows results related to a survey question about the overall benefits and impacts of the programs delivered. Most recommendations and resources were perceived as having value, with 28% rated as beneficial and 63% rated as very beneficial. A small fraction of respondents (5%) stated that they were not sure about the benefits, and 3% responded that the recommendations and resources were only somewhat beneficial.
Figure 1.
Ratings of Benefits and Impacts of Viticulture Recommendations and Resources
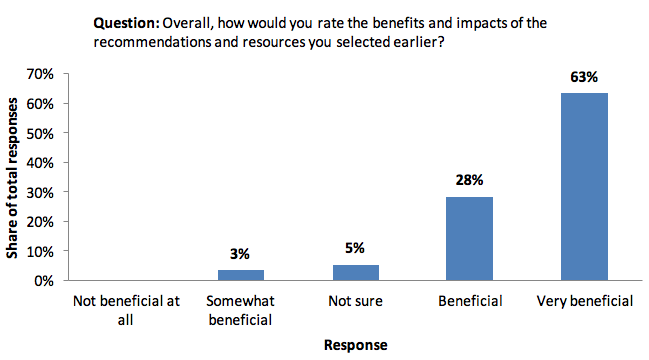
Table 1 provides background information for the sample of interest. The majority of the respondents (90%) were commercial grape growers, and 54% were also commercial wine makers. More than half of the respondents (54%) had been commercial grape producers for 10 years or less. In terms of level of training in viticulture, most respondents stated that they were self-taught (85%) and/or had gone through an internship or apprenticeship process (18%). By contrast, only a fraction of grape growers claimed to have some type of formal education in viticulture—community college (18%), 4-year degree (8%), or graduate school (8%). The need and relevance of VCE viticulture educational programs are highlighted by the fact that this industry is mainly comprised of relatively new and self-taught grape growers. Thus, future VCE efforts that are geared toward larger, more informed producers must not ignore the significant contribution of new, inexperienced growers who are more apt to make poor decisions or management mistakes.
| Answer | Number of responses | Share of total responses (%) |
| Question: Are you a commercial grape grower or vineyard owner (do you currently or plan to sell fruit or use it in your own winery)? | ||
| Yes | 86 | 90% |
| No | 10 | 10% |
| Question: Do you also make wine commercially? | ||
| Yes | 44 | 54% |
| No | 38 | 46% |
| Total | 82 | 100% |
| Question: How long have you been part of the Virginia wine grape industry? | ||
| < 1 year | 8 | 10% |
| 1–5 years | 20 | 24% |
| 5–10 years | 16 | 20% |
| > 10 years | 37 | 46% |
| Total | 81 | 100% |
| Question: Please characterize your viticulture training? Mark all that apply. | ||
| Self-taught | 74 | 85% |
| Internship/apprenticeships | 16 | 18% |
| Community college | 16 | 18% |
| Four-year Institution | 7 | 8% |
| Graduate school | 7 | 8% |
The survey provided a comprehensive list of Extension viticulture outputs delivered over the preceding 5 years and asked grape producers to identify those outputs that they had found to be beneficial (Table 2). Grape pest management, organized workshops and seminars, and the viticulture newsletter ranked as the top three outputs, with more than 80% of the respondents finding these outputs to be beneficial. On the other hand, outputs related to GIS and canopy assessment were found to be the least beneficial programs, with 26% and 15% response rates, respectively. That said, it is not surprising that GIS vineyard site evaluation tools would have little or no utility to those producers with established vineyards.
| Rank | Output | Response rate (%) |
| 1 | Grape pest management recommendation (pest management guides, ideas from seminars, ideas from regional vineyard meetings, etc.) | 89 |
| 2 | Workshops, seminars, vineyard Extension meetings, and other public forums | 84 |
| 3 | Viticulture Notes newsletter | 83 |
| 4 | Wine Grape Production Guide for Eastern North America (book) | 68 |
| 5 | Telephone, email, or other one-on-one recommendations | 58 |
| 6 | Training and vine pruning recommendations from attending pruning workshop(s) | 57 |
| 7 | Dr. Mizuho Nita's Pathology Blog | 56 |
| 8 | Under-the-trellis cover crops for vegetative growth management of vigorous vines | 53 |
| 9 | On-site visit by viticulture team members with recommendations provided/followed | 49 |
| 10 | Fertilizer/lime recommendations (either personally or gained from Wine Grape Production Guide) | 49 |
| 11 | Variety recommendations (Virginia Vineyards Association meetings or other venues) | 44 |
| 12 | Assistance from your local/county Virginia Cooperative Extension office | 41 |
| 13 | Nutrition recommendations based on soil and/or plant tissue analysis results | 40 |
| 14 | Sprayer calibration | 38 |
| 15 | Online geographic information system (GIS) vineyard site evaluation tool | 26 |
| 16 | Canopy assessment with point quadrat analysis (canopy transects) | 15 |
| 17 | Other | 9 |
| Note. Rankings are based on responses to the question "Of the following recommendations and resources delivered by our programs over the past 5 years, which ones did you find to be beneficial to your operation? (check all that apply)." | ||
In terms of time savings resulting from the use of or knowledge gained from the Extension programming, 73% of the respondents said that the recommendations or resources saved them time, whereas 24% stated that they were not sure (Table 3). Of those recognizing the time savings and providing specific information, 42% responded that the programs saved them 2–5 hr/ac, and 26% estimated time savings of 6–10 hr/acre. Given the opportunity cost, the value of time, and labor wages, these results confirm the positive economic impacts generated by the associated programs.
| Answer | Number of responses | Share of total responses (%) |
| Question: Did the recommendations or resources save you time? | ||
| Yes | 67 | 73% |
| No | 1 | 1% |
| Not sure | 22 | 24% |
| Not applicable | 2 | 2% |
| Total | 92 | 100% |
| Question: If you answered "Yes," can you estimate how many hours/acre of time were saved? | ||
| ≤ 1 hr/ac | 7 | 11% |
| 2–5 hr/ac | 26 | 42% |
| 6–10 hr/ac | 16 | 26% |
| 11–50 hr/ac | 8 | 13% |
| > 50 hr/ac | 5 | 8% |
| Total | 62 | 100% |
Seventy-one percent of survey respondents stated that the resources or recommendations saved them money (Table 4). Among those responding positively, the estimated average monetary savings were $354/ac. After multiplying the number of acres owned by those who responded positively by their stated per-acre savings, it was estimated that recommendations provided by VCE to Virginia vineyard operators saved this group a total of $114,930. It is important to note that this value is likely an underestimation of the total monetary impact. This is because for various reasons, out of those who stated that the recommendations saved them money, 25 did not specify a monetary value for such savings.
Growers also were asked whether the recommendations or resources improved their net profit per acre. As many as 62% of growers answered "Yes" (Table 4), with an average increase in profits of $1,127/ac. The product of the number of acres of those who responded positively and their stated per-acre profit increase totaled $283,720 for this group. Once again, this amount is an underrepresentation of the real increase in profits for those who acknowledged an increase in their profits due to these programs. In this case, 14 of the respondents who answered "Yes" to this question did not indicate an actual value.
| Answer | Number of responses | Share of total responses (%) |
| Question: Did the recommendations or resources save you money? | ||
| Yes | 62 | 71% |
| No | 25 | 29% |
| Total | 87 | 100% |
| Question: Did the recommendations or resources improve your net profit per acre? | ||
| Yes | 49 | 62% |
| No | 30 | 38% |
| Total | 79 | 100% |
According to responses to another question, 87% of respondents felt that Extension recommendations or resources had improved the quality of their fruit, whereas 13% did not (Table 5). This finding is particularly important in an industry in which the value of grapes is positively correlated to grape quality. To quantify the improvements in quality, producers were asked to estimate how much fruit quality was improved in terms of dollar amount per ton. Nearly half of the respondents (46%) stated that even though fruit quality was improved, its value remained unchanged; however, 38% of respondents indicated that crop value was increased between $50 and $200 per ton as a direct result of the Extension recommendations or resources (Table 5).
| Answer | Number of responses | Share of total responses (%) |
| Question: Did the recommendations or resources improve your fruit quality? | ||
| Yes | 74 | 87% |
| No | 11 | 13% |
| Total | 85 | 100% |
| Question: Please estimate how much your fruit quality was improved. Fruit quality in this case might be measured as a premium added to the price per ton paid for your fruit (or a reasonable estimate if your fruit were to be sold). | ||
| Fruit quality was improved, but fruit value was not changed | 31 | 46% |
| $20/ton | 2 | 3% |
| $50/ton | 6 | 9% |
| $100/ton | 7 | 10% |
| $200/ton | 13 | 19% |
| Other | 9 | 13% |
| Total | 68 | 100% |
Grape producers also were asked whether Extension recommendations or resources had influenced their decision making related to increasing their vineyard acreage. Forty-three percent of the respondents reported that the programming had positively affected their plans. The remaining 57% of respondents indicated that experience with the programming had not influenced their decision making related to increasing their vineyard acreage. Of those respondents who indicated that the programming had positively affected their plans for future vineyard expansion, 66% indicated that they would plant an additional 1–5 ac.
| Answer | Number of responses | Share of total responses (%) |
| Question: Did your experience with any of our recommendations or resources affect your decision to increase your vineyard acreage (e.g., maybe another variety)? | ||
| Yes | 37 | 43% |
| No | 49 | 57% |
| Total | 86 | 100% |
| Question: If our Extension recommendations affected your decision to plant additional grape acreage, how many acres will you install? | ||
| 1 ac | 7 | 19% |
| 2–5 ac | 17 | 47% |
| 6–10 ac | 7 | 19% |
| > 10 ac | 5 | 14% |
| Total | 36 | 100% |
Empirical Model and Results
An ordered logit model was estimated to identify those factors that are most likely to be associated with higher benefits of the Extension viticulture outputs. For our application, we hypothesized that the likelihood that a grape grower perceived the recommendations or resources as useful and beneficial was influenced by a series of factors. Equation 1, shown below, posits that the perceived benefits of the viticulture recommendations and resources are a linear function of the factors described in Table 7.
Benefits = function [size, location (NOVA), winery, experience, viticulture training]
(1)
| Variable name | Variable description | Expected sign | |
| Benefits | Rating of the benefits and impacts of the recommendations and resources delivered—Likert scale 1–5: 1 (not beneficial at all) and 5 (very useful) | ||
| Size | Size of operation (in acres) | − | |
| Location (NOVAa) | Dummy variable to assess the impact of proximity of grape growers to Virginia Cooperative Extension Experimental Station: 1, grower is located in NOVA region; 0, otherwise | + | |
| Winery | Dummy variable to distinguish those who are only grape growers from those who also are commercial wine producers: 1, commercial wine production; 0, otherwise | + | |
| Experience | Total years of experience in grape growing | − | |
| Viticulture training | Level of viticulture training—Likert scale 1–5: 1 (self-taught) and 5 (graduate school) | − | |
| aNOVA = northern Virginia; the following counties are included in our definition of the NOVA region: Clarke, Loudon, Fauquier, Rappahannock, Warren, Shenandoah, and Frederick. | |||
Equation 1 was estimated using White's (1980) robust standard errors, which provides standard errors that are robust against heteroskedasticity and serial correlation, and it helps correct for model misspecification (Long & Freese, 2006). The results in Table 8 show that the estimated model includes 78 observations and that the estimated p-value is .0006, which indicates that the model as a whole is statistically significant at the 1% level. A correlation matrix showed no evidence of multicollinearity between variables.
The estimated results shown in Table 8 reveal that all individual dependent variables had statistically significant impact on the dependent variable (benefits). Larger-scale producers and those who are also commercial wine producers appear to benefit less from the recommendations and resources. The negative sign for commercial wine producers might be because some of them may have full-time trained staff who manage their vineyards and wine-making operations. Consequently, some of these programs may not be as relevant for this group. As expected, a higher level of viticulture training is negatively correlated with the stated benefits from the Extension programs. Producers located in northern Virginia benefited more from programming than did those located in more distant locations. This circumstance may relate to certain producers' being located nearer to workshops and other field meetings. Producers with more experience also benefit more from the viticulture programming, which goes against the hypothesized relationship. A possible explanation for this might be that more knowledgeable producers are able to capitalize more effectively on educational programs. Furthermore, more experienced producers with longer exposure to programs may be in a better position to assess their benefits.
| Benefit | Coefficient | p-value | |
| Size | −0.14** | 0.03 | |
| Location (NOVA) | 0.96* | 0.07 | |
| Winery | −1.39** | 0.04 | |
| Experience | 0.53* | 0.07 | |
| Viticulture training | −0.42* | 0.07 | |
| cut 1 | 1.27 | ||
| cut 2 | 1.61 | ||
| cut 3 | 0.97 | ||
| Number of Obs = 78 | |||
| Prob > Χ2= .0006 | |||
| Pseudo R2= 0.1161 | |||
| ***Denotes 1% significance level. **Denotes 5% significance level. *Denotes 10% significance level. | |||
The parallel regression assumption is an integral assumption when running an ordered model; however, it is often violated, as it is common for βs to differ across values of j (Williams, 2006). According to Long & Freese (2006), the parallel regression assumption states that the βs are not allowed to differ across thresholds or cut points. To test for this assumption, a likelihood-ratio test developed by Brant (1990) is used. The null hypothesis posits that there is no difference in the coefficients between models and that the parallel regression assumption holds (University of California, Los Angeles, 2014). The overall model shows a p-value of .594; thus, we fail to reject the null hypothesis, and the model does not violate the assumption of parallel regression. When applied to individual variables, the assumption of parallel regression continues to hold. These results bolster the robustness of the findings from the empirical model.
Conclusion and Policy Implications
If the Virginia wine industry is to continue to expand, there will be an increased need for Virginia wine grapes and for viticulture educational programs to support vineyard expansion. This is because more educated and better trained grape producers will likely increase the quality and quantity of locally produced grapes.
The questionnaire results discussed herein present clear evidence that the recommendations and resources that VCE and Virginia Tech have provided have been beneficial to Virginia grape growers. The benefits have been multifaceted, and for a number of growers, the recommendations and resources have resulted in time and money savings and improvements in fruit quality and have influenced their future planting decisions. Some outputs, including pest management recommendations, workshops, and the viticulture newsletter, appear to have had greater value than others. The introduction of invasive pests, pathogen and pest resistance to pesticides, and changing federal and state regulatory policies all drive an ongoing need to retool and further educate existing growers. At same time, new entrants to grape growing require consistent and easily accessible information that can help inform fundamental business decisions.
Statistical analysis revealed that those growers who operate larger farms and have higher levels of viticulture training were less likely to benefit from the Extension viticulture outputs. This is true for those who also produce wine commercially as well. On the other hand, growers operating near where programs are often delivered and those with higher levels of experience are more likely to benefit from the recommendations and resources. Although specific to the Virginia grape industry, the findings of the study reported here may be applicable to other emerging wine regions in the United States where there is a need for viticulture education programs.
Disclaimer
The views expressed in this article do not represent those of the Economic Research Service or the U.S. Department of Agriculture.
References
Archer, T. M. (2008). Response rates to expect from web-based surveys and what to do about it. Journal of Extension, 46(3) Article 3RIB3. Available at: https://www.joe.org/joe/2008june/rb3.php
Brant, R. (1990). Assessing proportionality in the proportional odds model for ordered logistic regression. Biometrics, 46, 1171–1178.
Christaldi, J. (2016). 50 wine facts from 50 United States. Retrieved from http://napavalleywineacademy.com/50-united-states-and-50-wine-facts/
Dillman, D. A, Smyth, J. D., & Christian, L. M. (2014). Internet, phone, mail, and mixed-mode surveys: The tailored design method (4th ed.). New York, NY: John Wiley and Sons.
Long, J. S., & Freese, J. (2006). Regression models for categorical dependent variables using Stata (2nd ed.). Texas: Stata Press.
Office of the Governor. (2015). Governor McAuliffe announces Virginia wine grape harvest increases 17%. Retrieved from https://governor.virginia.gov/newsroom/newsarticle?articleId=8022
Shih, T., & Fan, X. (2008). Comparing response rates from web and mail surveys: A meta-analysis. Field Methods, 20(3), 249–271.
University of California, Los Angeles. (2014). Stata data analysis examples: Ordered logistic regression. Retrieved from http://www.ats.ucla.edu/stat/stata/dae/ologit.htm
U.S. Department of Agriculture, National Agricultural Statistics Service. (2014). Noncitrus fruits and nuts, 2013 summary. Retrieved from http://www.usda.gov/nass/PUBS/TODAYRPT/ncit0714.pdf
U.S. Department of the Treasury, Alcohol and Tobacco Tax and Trade Bureau. (2014). Wine appellations of origin. Retrieved from http://www.ttb.gov/appellation/index.shtml
White, H. (1980). A heteroskedasticity-consistent covariance matrix estimator and a direct test for heteroskedasticity. Econometrica, 48(4, May), 817–838.
Williams, R. (2006). Generalized ordered logit/partial proportional odds models for ordinal dependent variables. The Stata Journal, 6(1), 58–82.
Wine Institute. (2014). Wine consumption in the United States. Retrieved September 20, 2014, from http://www.wineinstitute.org/resources/statistics
Wine Institute. (2015). 2014 California wine sales grow 4.4 percent by volume and 6.7 percent by value in the U.S. Retrieved from http://www.wineinstitute.org/resources/pressroom/05192015
Wolf, T. K. (2008). Wine grape production guide for Eastern North America. Ithaca, NY: Natural Resource, Agriculture, and Engineering Service.