October 2016
|
October 2016 // Volume 54 // Number 5 // Feature // v54-5a4


Use of an Integrated Pest Management Assessment Administered Through TurningPoint as an Educational, Needs Assessment, and Evaluation Tool
Abstract
University of Minnesota educators use an integrated pest management (IPM) survey conducted during private pesticide applicator training as an educational, needs assessment, and evaluation tool. By incorporating the IPM Assessment, as the survey is called, into a widely attended program and using TurningPoint audience response devices, Extension educators can gather information from a significant number of farmers in a timely and efficient manner. Interspersing TurningPoint questions throughout presentations also increases audience engagement and overall quality of the training. For example, weed management programming efforts around herbicide-resistance management have been significantly influenced and enhanced by results of the IPM Assessment.
Introduction
University of Minnesota Extension educators annually conduct private pesticide applicator training (PPAT) throughout Minnesota. Farmers are able to renew their private pesticide applicator certification by attending a PPAT session, and certification is good for 3 years. A key component of the PPAT curriculum is education related to integrated pest management (IPM) principles and practices.
Since 2003, Extension educators across southern Minnesota have surveyed PPAT attendees about their pest management practices—first by using paper surveys and later, beginning in 2008, by using TurningPoint audience response device (ARD) technology (Turning Technologies, Youngstown, OH). TurningPoint has been used exclusively for the survey since 2012. Demographic, knowledge-level, and evaluation questions, as well as questions to help create teachable moments, are included. The suite of questions is collectively called the IPM Assessment.
Much has been written about the benefits of using ARD technology in the classroom. Kay & LeSage (2009) found that the benefits of using ARDs include anonymity of audience members, increased engagement, enhanced learning, and the ability to modify a presentation on the basis of immediate audience feedback. Use of ARDs has been shown to enhance Extension programs, specifically, through increased audience engagement, instant assessment of attendees' understanding and comprehension of topics, and collection of evaluation data (Bird & McClelland, 2010; Gun & Loy, 2015; Gustafson & Crane, 2005; Sciarappa & Quinn, 2014). Moreover, use of ARDs allows for collection of a large amount of data with minimal expenditure of resources (Parmer, Parmer, & Struempler, 2012), and ARDs have been used to conduct Extension programming needs assessments (Buyamukama et. al., 2016; Carlson, 2014).
In this article, we describe how the IPM Assessment, particularly since conversion to TurningPoint, has shown value as an educational needs assessment and an evaluation tool and how information gleaned from the IPM Assessment has been used to enhance Extension educational programming efforts related to weed management and herbicide-resistance.
Methods
Initially used in southeastern Minnesota, the IPM Assessment was adopted by educators conducting PPAT across southern Minnesota in 2005. Each year a team of PPAT coordinators from southern Minnesota meets to develop questions for the upcoming round of PPAT sessions. Since 2008, each coordinator has had his or her own TurningPoint ResponseCards (also known as clickers), computer-loaded with TurningPoint software, and a TurningPoint Receiver (a device that plugs in to a computer and collects responses from the wireless ResponseCards).
Key questions are asked each year to allow evaluation of trends over time, and new questions are developed as needed to address new and/or upcoming issues. Occasionally questions are brought back after being discontinued to measure changes over time. Since certified applicators are on a 3-year recertification cycle, survey groups are similar every 3 years, although the group of respondents is not exactly the same (e.g., IPM Assessment data from 2015 indicated that 84% of respondents had attended a recertification workshop in 2012). This circumstance provides value related to comparisons made not only from year to year but also across the group of respondents every 3 years.
Although a core set of questions is asked at most locations, educators select the questions to use on the basis of their program content, needs related to the areas they work in, and their preferences and expertise. Care is taken to limit the number of questions to prevent "clicker overload." If placement of a question during the program can influence answers, this is discussed by the educators and taken into account when interpreting results.
All attendees are handed a clicker at the beginning of the PPAT session (prior to 2009, all attendees were handed a paper survey). Questions are asked throughout the program through the use of Microsoft PowerPoint presentations that run through the TurningPoint software. Although every attendee is given a chance to participate, participation is voluntary, and each attendee does not typically answer every question. Responses to the questions are shown after closing the polling except for most evaluation questions for which showing the results could potentially influence responses. Responses are anonymous, as clicker identity is not linked to an individual and there is no way to link a response to an individual participant.
Reports are generated for each location, and results are pooled in a Microsoft Excel spreadsheet. The pooled results are graphed in Microsoft PowerPoint and, when applicable, displayed across years. The number of locations and number of respondents from each year are shown in Table 1. Due to the large number of farmers surveyed through the PPAT program each year, the IPM Assessment presents a fairly representative snapshot of farmers' practices and opinions across the region.
| Year | Number of locations | Number of farmers surveyed |
| 2003 | 11 | 190 |
| 2004 | 11 | 410 |
| 2005 | 9 | 440 |
| 2006 | 26 | 720 |
| 2007 | 48 | 1,500 |
| 2008 | 47 | 1,170 |
| 2009 | 46 | 1,530 |
| 2010 | 33 | 1,810 |
| 2011 | 35 | 1,250 |
| 2012 | 36 | 1,020 |
| 2013 | 40 | 1,220 |
| 2014 | 41 | 1,341 |
| 2015 | 32 | 1,402 |
| Note. Not all questions were asked at a location in a given year. | ||
Since all participants may not be familiar with the technology, educators briefly review how to use the clickers at the beginning of each PPAT session. Simple demographic questions are asked initially to help people gain familiarity and confidence with the technology.
Results and Discussion
Tool for Educational Needs Assessment
A key benefit of using TurningPoint during PPAT has been the ability to gain immediate feedback from audiences. This has allowed us to gauge understanding of concepts and adjust presentations accordingly. For example, attendees were asked whether glyphosate (the active ingredient in Roundup herbicide products and currently one of the most widely used active ingredients in corn and soybean) is a "contact" or "systemic" product. These are commonly used terms, and knowing which type of product one is working with affects key application practices, which ultimately can influence herbicide effectiveness. When we first asked the question in 2008, we were surprised to find that 59% of respondents incorrectly identified glyphosate as a contact herbicide (Figure 1). We continued to ask this question through 2011 and found similar results (Figure 1). This feedback demonstrated that we needed to be careful in making assumptions about our audience with regard to understanding of commonly used terms. Once this educational need was identified, we reviewed what the terms meant, related them to common herbicides, and, finally, discussed the significance of this concept to pesticide application. It is important to note that farmers appeared to pay more attention to the discussion once they realized that they had made an incorrect assumption.
Figure 1.
Responses of Farmers Surveyed to the Question
"Is Glyphosate (the Active Ingredient in RoundupTM) a Contact or Systemic Herbicide?"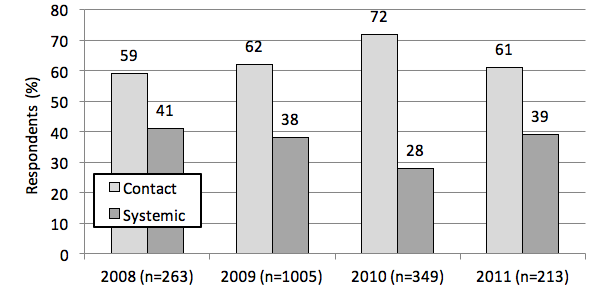
Note: The correct answer is "systemic."
In 2015, we identified another key gap in understanding regarding concepts widely discussed in weed management education. When attendees were asked whether they rotated sites of action (the biochemical processes in a plant that an herbicide acts on) in herbicide-resistance management, 77% said "yes" (Table 2). However, when attendees were asked in a follow-up question how herbicides are categorized by sites of action, 19% of respondents answered incorrectly, and 66% indicated that they did not know (Table 2). Only 15% correctly identified the classification scheme for herbicide sites of action (Table 2). Although a key message in herbicide-resistance management has been to rotate sites of action, it is clear that there is a need for better understanding about this practice among farmers.
| Questions and answer options | % of respondents |
| When planning weed management programs, do you purposefully utilize different SOAs?a | |
| Yes | 77 |
| No | 13 |
| Don't know | 10 |
| How are herbicide SOAs classified?b | |
| B, D, I, N | 11 |
| 2, 4, 9, 14c | 15 |
| I, IV, IX, XIV | 8 |
| Don't have a clue | 66 |
| aNumber of respondents was 434. bNumber of respondents was 418. cThe correct answer is "2, 4, 9, 14." | |
The IPM Assessment also has been useful in identifying educational needs surrounding upcoming or recently approved herbicide-resistant crop technologies. According to the herbicide label, practices such as triple-rinsing tanks after application and using drift-reducing nozzles will be required when using these systems. When asked "What type of nozzle do you usually use," the majority of respondents indicated that they normally use a flat-fan nozzle, which is not a drift-reducing nozzle (Table 3). The percentage of respondents indicating that they normally use a flat-fan nozzle has remained relatively high since we first asked the question in 2008 (Table 3). When asked to complete the prompt "When rinsing out the tank between susceptible crops, I usually . . .," approximately 57% and 56% of the respondents in 2014 and 2015, respectively, indicated that they rinsed out the tank fewer than three times (Figure 2). As noted previously, according to the herbicide label, triple-rinsing will be required when using these upcoming or newer technologies. These survey results have helped validate and guide our educational efforts around newer/upcoming herbicide-application technologies.
| Year | Number of respondents | Percentage of respondents using a particular nozzle typea | |||||
| Flat fan | Air induction | Flood | Cone | Chamber/drift-reducing | Other | ||
| 2008 | 363 | 56 | 14 | 8 | 5 | 15 | 2 |
| 2009 | 462 | 53 | 17 | 7 | 5 | 24 | 3 |
| 2010 | 252 | 53 | 34 | 7 | 5 | 4 | 4 |
| 2011 | 220 | 54 | 17 | 7 | 2 | 16 | 4 |
| 2012 | 320 | 50 | 24 | 8 | 3 | 11 | 5 |
| 2013 | 653 | 49 | 25 | 7 | 2 | 15 | 3 |
| 2014 | 392 | 58 | 25 | 7 | 5 | 3 | 2 |
| 2015 | 659 | 46 | 32 | 6 | 4 | 11 | 2 |
| aIn 2009 and 2010, respondents were able to select more than one answer. In other years, totals may not equal 100% due to rounding. | |||||||
Figure 2.
Responses of Farmers Surveyed to the Question
"When Rinsing out the Tank Between Susceptible Crops, I Usually . . ."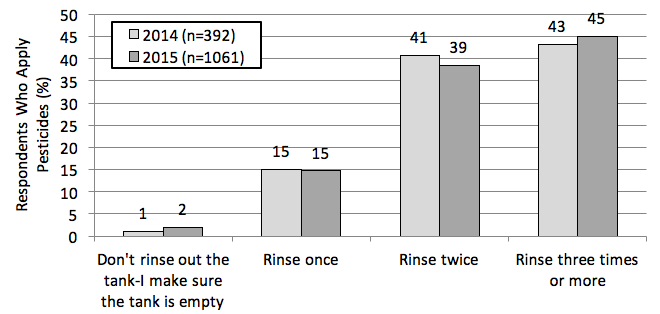
Note: Totals may not equal 100% due to rounding.
Tracking Trends Over Time and Location
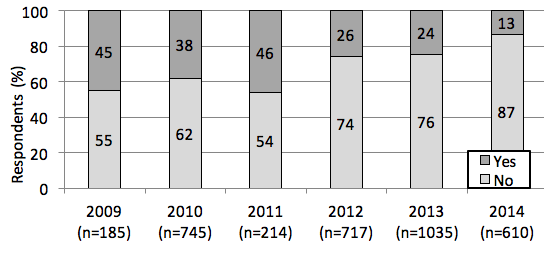
Asking a set of questions over a number of years has allowed us to track weed-control issues over time. From 2009 to 2014, farmers were asked "Does glyphosate perform as well today as when you first used it?" Results from this question offer an indirect measure of the prevalence of glyphosate-resistant weeds. When we asked this question in 2009, 55% of respondents said "no," whereas in 2014 (the last year we asked this question), 87% said "no" (Figure 3). This translates to an increase of 32 percentage points in reported reductions in control efficacy with glyphosate over a 6-year time span. Considering that the group of respondents in 2011 was similar to the group of respondents in 2014, a similar reduction in control was reported (33 percentage points) over a 3-year span (Figure 3). This information indicates that farmers have been seeing problems with glyphosate control at an increased rate in recent years, indicating a continued, if not increased, need for education around herbicide-resistance management.
Figure 3.
Responses of Farmers Surveyed to the Question
"Does Glyphosate Perform as Well Today as When You First Used It?"
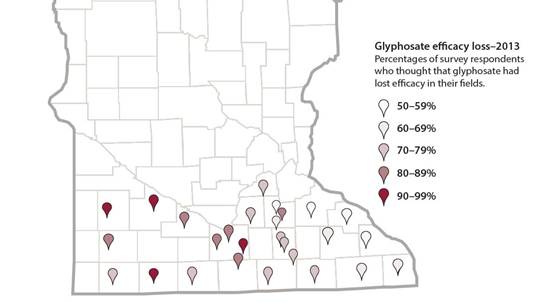
Because TurningPoint results are collected and saved by location, results can be compared by location as well. In recent years, we noticed differences among locations when attendees were asked about the current performance of glyphosate versus its performance when they began using it. By plotting each location's results on a map, we were able to visually track a trend across the southern part of the state, where reported decreases in control were greater in the southwestern part of the state than in the southeastern part of the state in 2013, the most recent year this question was asked at a significant number of locations (Figure 4). This information provides value from educational and, potentially, research standpoints as to why this trend is observed. One implication is that a greater diversity of crops in the rotation in the southeastern part of the state may be helping delay the development of control issues with glyphosate. Responses to historical questions about the variety of crops planted and crop rotations support the observation that cropping systems tend to be more diverse in the southeastern part of the state than in the southwestern part (data not shown). Other variables, such as those related to application (e.g., type of spray nozzle used, typical weed height at application, application rates), environmental conditions, and use of other weed management strategies, may be contributing factors. Further research is needed to better understand the factors influencing observed geographical differences in glyphosate efficacy.
Figure 4.
Percentages of Farmers Surveyed Across Southern Minnesota in 2013
Who Replied "No" to the Question "Does Glyphosate Perform
as Well Today as When You First Used It?"
Other Advantages
Each year, individuals tell us at the end of PPAT sessions that they liked using TurningPoint as it kept things interesting and helped them pay attention and that they liked seeing how other farmers were responding to the questions. Anonymity of responses has been a key part of the success of using TurningPoint during the program, and others have described this as a benefit in the traditional classroom and in other Extension settings as well (Gustafson & Crane, 2005). We feel that not only were farmers more apt to answer questions when using TurningPoint than if they had been asked to raise their hands, for example, but also that they were more likely to state their actual practices or actual thoughts about something because they were not individually identified.
Using TurningPoint in the IPM Assessment has allowed the collection and analysis of a large volume of data over time and locations through the use of a limited amount of resources. There was an initial expense when purchasing the ResponseCards, but the system has saved a significant amount of staff time in managing the data collected compared to when responses were collected through paper surveys. Incorporating the IPM Assessment into a program that is widely attended by farmers also has been a very efficient and effective method of conducting an educational needs assessment with our direct audience, particularly as compared to mailing a paper survey to farmers.
Challenges
Although switching to TurningPoint to conduct the IPM Assessment has saved resources in managing the data, outfitting the PPAT coordinators with clickers required a significant investment. Educators typically have one to three sets of clickers (a set contains 30 clickers), depending on typical attendance at their programs. Sets are shared when attendance is expected to be large. Occasionally attendees leave with clickers, so most educators put return address labels on the backs of the clickers, and one attaches lanyards to the clickers to help reduce the risk of loss.
It also has been challenging to summarize results across locations and years when wordings of questions or answer selections differ across locations and years. To help avoid discrepancies, one educator develops a final set of TurningPoint questions and answers for educators to select from each year. Even if no issues are found, it still takes a significant amount of staff time to organize and combine the data into a large Excel spreadsheet each year. Educators first must generate reports in TurningPoint from every location and then save the data in an Excel file. One point person then collects and combines data from all the files into one large Excel spreadsheet. Care must be taken to ensure that questions and answers match across locations and that any data formatting issues are addressed.
Another challenge in using TurningPoint across multiple locations and years has been compatibility issues that arise when TurningPoint questions being used in a presentation were developed through a different computer software or hardware setup. Problems we have experienced include the reformatting of question slides, the changing of slide settings, lack of complete collection of clicker responses by the system, nonfunctioning TurningPoint slides, or crashing of the program. Some of the issues have been traced to educators' not having the same versions of TurningPoint on their computers or having different versions of hardware (TurningPoint receivers). Problems also have arisen when TurningPoint question slides created during a previous year are copied into a new presentation or when versions of Microsoft PowerPoint differ. To help alleviate compatibility issues in the future, we plan to ensure that all educators are using the most recent version of TurningPoint software and hardware and the same version of Microsoft PowerPoint and to recreate the questions each year using the most up-to-date system possible.
Conclusion
The IPM Assessment, particularly since our conversion to TurningPoint, has been a valuable educational, needs assessment, and evaluation tool. Incorporating a survey tool such as the IPM Assessment into a widely attended program such as PPAT is an efficient and effective way for Extension educators to collect feedback and information. Interspersing TurningPoint questions throughout presentations has proved to be valuable in enhancing audience engagement and the overall educational quality of Extension programs. Information gleaned from using a tool such as the IPM Assessment over time can provide guidance in Extension educational and outreach efforts, as demonstrated by our experiences related to weed management and herbicide-resistance management.
Acknowledgments
The authors would like to thank Judy Christians and Mary Jane Stearns, who helped compile survey responses across locations; Jordan Stahl, Kally Philipp, Angela White, Matthew White, and Kyle Poss, who helped in the graphing of results; and Phyllis Bongard and JoAnne Makela for their assistance in graphic development.
References
Bird, C., & McClelland, J. (2010). Have you used clickers in programming? Journal of Extension, 48(5) Article 5TOT9. Available at: https://www.joe.org/joe/2010october/tt9.php
Byamukama, E., Szczepaniec, A., Strunk, C., Fanning, R., Bachmann, A., Deneke, D., & Johnson, P. (2016). Assessing integrated pest management implementation and knowledge gaps in South Dakota. Journal of Extension, 54(1) Article 1RIB7. Available at: https://www.joe.org/joe/2016february/pdf/JOE_v54_1rb7.pdf
Carlson, B. (2014). Using Turning Point to conduct an Extension needs assessment. Journal of Extension, 52(1) Article 1TOT3. Available at: https://www.joe.org/joe/2014february/tt3.php
Gun, P., & Loy, D. (2015). Use of interactive electronic audience response tools (clickers) to evaluate knowledge gained in Extension programming. Journal of Extension, 53(6) Article 6TOT5. Available at: https://www.joe.org/joe/2015december/tt5.php
Gustafson, C., & Crane, L. (2005). Polling your audience with wireless technology. Journal of Extension, 43(1) Article 6TOT3. Available at: https://www.joe.org/joe/2005december/tt3.php
Kay, R. H., & LeSage, A. (2009). Examining the benefits and challenges of using audience response systems: A review of the literature. Computers & Education, 53, 819–827.
Parmer, S., Parmer, G., & Struempler, B. (2012). Testing a new generation: Implementing clickers as an Extension data collection tool. Journal of Extension, 50(1) Article 5TOT5. Available at: https://www.joe.org/joe/2012october/tt5.php
Sciarappa, W., & Quinn, V. (2014). Integrating digital response systems within a diversity of agricultural audiences. Journal of Extension, 52(1) Article 1FEA7. Available at: https://www.joe.org/joe/2014february/a7.php