February 2016
|
February 2016 // Volume 54 // Number 1 // Tools of the Trade // v54-1tt3


Assessing Social Learning Outcomes Through Participatory Mind Mapping
Abstract
This article presents a method for using mind mapping to assess social learning outcomes in collaborative environmental restoration and participatory natural resource management initiatives. Using mind mapping for preassessment and postassessment can reveal changes in individual and collective thinking about critical social and ecological issues. On the basis of results from four youth-based environmental restoration programs in Boulder, Colorado, and New York and Cattaraugus Territory, New York, we suggest that mind mapping can serve as an effective data collection strategy and as a method for analyzing cognitive change in environmental restoration programs and civic ecology more broadly.
Introduction
Scholars and practitioners are increasingly citing social learning as critical to building social and ecological systems (SES) resilience in communities (Keen, Brown, & Dyball, 2005; Wilson 2012). Studies suggest that social learning can strengthen social ties and confer new skills and knowledge as well as challenge implicit assumptions to help cultivate new perspectives and a common framework for future action (Schusler, Decker, & Pfeffer, 2003; Wals, Geerlin-Eijiff, Hubeek, van der Kroon, & Vader, 2008).
Although there has been growing focus on social learning in the natural resource management and SES literature, methods for assessing social learning predominantly focus on observation of process-orientated indicators or conflate process and outcomes (Reed et al., 2010). These approaches can leave gaps in understanding of learning outcomes in studies that evaluate participatory natural resource management and community-based resilience initiatives.
This article presents a method of using mind mapping as a tool for evaluating social learning outcomes in civic ecology practices, and more specifically, collaborative environmental restoration activities (Krasny & Tidball, 2010). This method was used to collect data from youth-based environmental restoration programs and to evaluate the influence of engaged civic ecology on individual and collective thinking about critical social and ecological issues.
When combined with observation of process-oriented indicators, this approach allows for a fuller and more robust account of social learning through participatory natural resource management and community-based resilience efforts.
Rationale for Mind Mapping Cognitive Change
Cognitive mapping techniques, such as mind mapping, have been used successfully to facilitate collaboration and community engagement (Martin, Leuci, & Stewart, 2014). These techniques also provide a window into the ways in which individuals and groups construct knowledge and the latent frames people use in decision making (Wheeldon & Faubert, 2009). Considering these frames and the ways that thinking changes over time is important to understanding the impacts of participatory action on social learning and how communities may respond to future disturbance events and climate change.
Mind mapping was used to help capture these cognitive shifts because it allows participants to create an association of interrelated ideas or concepts, thus capturing a snapshot of their collective conceptual landscape (Buzan, 1974; Buzan & Buzan, 2000). This technique also encourages a common radial structure that makes it useful for analysis, and it is easy to use with both youth and adults.
The Technique/Process
Mind mapping should be conducted as both an individual exercise and a group exercise at both the beginning and the end of participation in an educational intervention or collaborative program. The materials required are relatively simple, and the list includes sheets of paper, colored pencils (for individual maps), and a poster board to facilitate the group process.
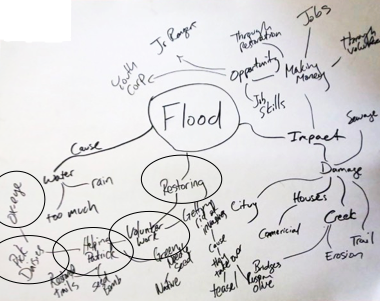
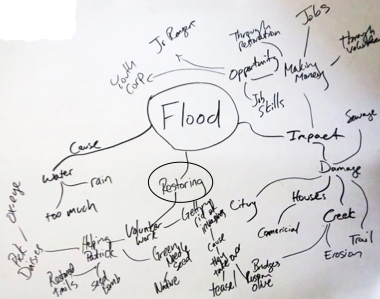
Prior to the preprogram formal mapping session, participants are given a 5- to 10-minute introduction to mind mapping, using a conceptually unrelated example (Figure 1). The mapping process can be defined as word association or "concept" association, starting with the most abstract idea and ending with the most specific.
Figure 1.
Mind Map Example for Training Purposes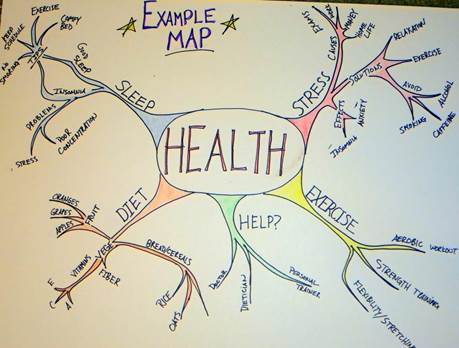
Following the short training, participants are prompted to write the main theme in the center of the paper and are given 7–10 min to draw out their ideas—related subthemes and refinement of those subthemes with increasing levels of specificity. During this process, the facilitator can help participants who require further guidance in focusing their maps. Upon completion by participants, individual maps are collected, digitized, and returned to the participants.
After the individual exercise, the facilitator shifts to the group process. The facilitator writes the main theme (e.g., "climate change") in the center of the poster board, and the group is prompted to describe what comes to mind when they think about X.
As participants share their thinking, each new idea becomes an opportunity for the facilitator to ask a new set of questions. This provides a means of discussion that can help the group refine their thinking about the primary theme. This back-and-forth exchange continues until participants have clarified each idea and all feel satisfied that the map is complete. The group exercise typically lasts about 20 min.
The postprogram mapping session is conducted in the same fashion, following program participation. This session can be handled in either of two ways. Participants can create brand new maps with new sheets of paper, using the same primary theme. Alternatively, participants can use the first maps and add new ideas, using different-colored markers to extend their original maps.
Analyzing Mind Maps
Data analysis focuses on attributes drawn from research in framing and frame analysis as defined by Goffman (1974), Entman (1993), and Greeno (1989). In particular, elevation, alteration, and alignment are considered important for determining changes in cognitive frames among individuals as well as the emergence of a common framework of understanding—defined as conceptual alignment between individuals and the larger group. Comparing mind maps provides data on the alteration of secondary themes—the ways themes are defined through additional, more specific concepts—and alignment—the degree of similarity between individual and group maps (Table 1).
| Concept | Measure |
| Elevationa |
|
| Alteration |
|
| Alignment |
|
| aRaw numbers used for group maps, averages computed for individuals. | |
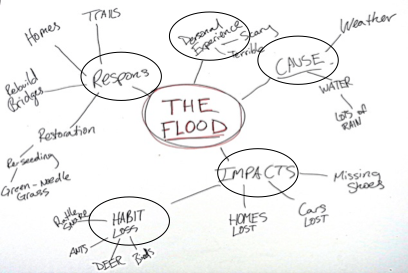
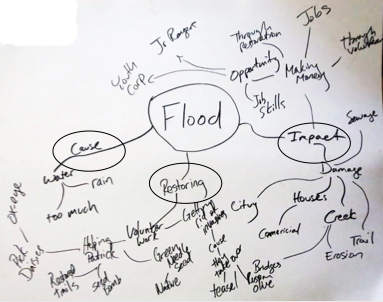
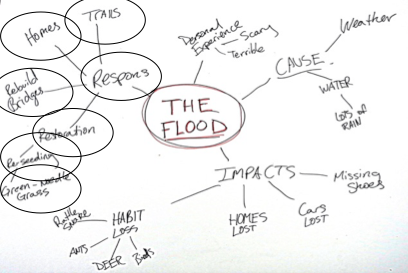
Measuring the elevation and alteration of mind maps provides a window into the substantive changes in thinking that can occur through social learning initiatives. It is possible to find that new subthemes are added, whereas others become excluded. Learning may also motivate conceptual loading into new subthemes, indicating shifts in the ways people frame climate change or significant disturbance events (Figure 2).
| Measurement | Precollaboration | Postcollaboration |
| Number of subthemes |
|
|
| Depth of subthemes |
|
|
| Number of concepts by subtheme |
|
|
| Thematic change |
|
|
Alignment is the primary means for determining social learning outcomes, as this element represents the emergence of a common framework of thinking. Measuring alignment is based on clustering similar concepts into a single generalized concept and then producing a list of generalized concepts. This activity helps normalize significantly different data outcomes, particularly when different terms are used to mean the same thing. Normalization can be done with Leximancer or an online thesaurus (Smith & Humphreys, 2006).
Normalized individual maps are then compared with the similarly normalized group map to determine the number of similar concepts. The number of matches between individuals and the group map is averaged out to create a baseline "percentage of similarity." The ratio of matches to total number of concepts between preprogram and postprogram maps is calculated to determine an "expected match outcome," assuming that no changes occurred (Table 2).
| Group | Preprogram Map Mean Match | Preprogram Map Match Mean | Expected Postprogram Map Mean Match | Postprogram Map Mean Match | Postprogram Map Match Mean |
| Group 1 | 2.88 | 10.29% | 4.22 | 5.31 | 12.96% |
| Group 2 | 6.17 | 17.62% | 6.52 | 7.3 | 19.73% |
| Group 3 | 2.35 | 10.21% | 3.78 | 1.90 | 5.15% |
Conclusion
Mind mapping as a participatory evaluation tool has a number of unique benefits. It is engaging for participants and easy for both adults and youth to use. Mind maps provide useful data on changes in thinking, helping program leaders visualize conceptual changes that occur through participatory problem solving and educational interventions.
Mind maps also reveal significantly more nuance in thinking over traditional quizzes or surveys. For example, while quizzes can show that people understand particular concepts, a quick mind-mapping exercise highlights dominant thinking that people use to make sense of the world. This is important when considering bounded rationality and the limitations of information in many decision-making contexts.
Despite these benefits, mind map data can be complex, and normalizing the data for measurement requires a significant amount of effort.
Acknowledgment and Disclaimer
This work was supported by the U.S. Department of Agriculture National Institute of Food and Agriculture, Federal Capacity Funds-Smith Lever/EFNEP project 2012-13-231. Any opinions, findings, conclusions, or recommendations expressed in this publication are those of the author(s) and do not necessarily reflect the view of the National Institute of Food and Agriculture (NIFA) or the United States Department of Agriculture (USDA).
References
Buzan, T. (1974). Using both sides of your brain. New York, NY: E. P. Dutton.
Buzan, T., & Buzan, B. (2000). The mind map book. London, UK: BBC Books.
Entman, R. M. (1993). Framing: Toward clarification of a fractured paradigm. Journal of Communication, 43(4), 51–58.
Goffman, E. (1974). Frame analysis: An essay on the organization of experience. Cambridge, MA: Harvard University Press.
Greeno, J. G. (1989). Situations, mental models, and generative knowledge. In D. Klahr & K. Kotovsky (Eds.), Complex information processing (pp. 285–318). Hillsdale, NJ: Erlbaum.
Keen, M., Brown, V. A., & Dyball, R. (2005). Social learning in environmental management: Towards a sustainable future. London, UK: Earthscan.
Krasny, M. E., & Tidbal, K. (2010). Civic ecology: Linking social and ecological approaches in Extension. Journal of Extension [Online], 48(1) Article 1IAW1. Available at: https://www.joe.org/joe/2010february/iw1.php
Martin, M. J., Leuci, M., & Stewart, M. (2014). Challenges of engaging local stakeholders for statewide program development process. Journal of Extension [Online] 52(1) Article 1TOT8. Available at: https://www.joe.org/joe/2014february/tt8.php
Reed, M. S., Evely, A. C., Cundill, G., Fazey, I., Glass, J., Laing, A., Newig, J., Parrish, B., Prell, C., Raymond, C., & Stringer, L. C. (2010). What is social learning? Ecology and Society, 15(4). r1. Retrieved from http://www.ecologyandsociety.org/vol15/iss4/resp1/
Schusler, T. M., Decker, D. J., & Pfeffer, M. J. (2003). Social learning for collaborative natural resource management. Society and Natural Resources, 15, 309–326.
Smith, A. E., & Humphreys, M. S. (2006). Evaluation of unsupervised semantic mapping of natural language with Leximancer concept mapping. Behavior Research Methods, 38(2), 262–279.
Wals, A. E. J., Geerlin-Eijiff, F., Hubeek, F., van der Kroon, S., & Vader, J. (2008). All mixed up? Instrumental and emancipatory learning toward a more sustainable world: Considerations for environmental education policymakers. Applied Environmental Education and Communication, 7, 55–65.
Wheeldon, J., & Faubert, J. (2009). Framing experience: Concept maps, mind maps, and data collection in qualitative research. International Journal of Qualitative Methods, 8(3).
Wilson, G. A. (2012). Community resilience, globalization, and transitional pathways of decision-making. Geoforum, 43(6), 1218–1231.