February 2016
|
February 2016 // Volume 54 // Number 1 // Research In Brief // v54-1rb3


Assessing the Profitability of Guava Production in South Florida Under Risk and Uncertainty
Abstract
This article discusses an assessment of the profitability of operating a 5-acre Thai guava orchard in South Florida. The assessment used simulation techniques to incorporate yield and price risks. The article also demonstrates the use of a stoplight chart, an approach Extension agents might adopt to aid clients' decision making. The stoplight chart presents the results of the analysis, which indicate a 2% chance that the grower would experience a negative return/loss (red), a 21% chance that the return would be greater than $0 but less than $8,450 (yellow), and a 77% chance that the return would be greater than $8,450 (green).
Introduction
Operating in one of the few areas in the United States where a wide variety of tropical/subtropical fruits can be grown commercially, South Florida growers battle foreign competition and a host of pests and diseases for their share of the tropical fruit market (Degner, Stevens, & Morgan, 2002). As a result, some growers are diversifying their operations toward more viable alternative commodities (Steele & Crane, 2006). Although newer commodities have the potential to generate considerable returns in niche markets, they carry significant production and marketing risks.
One commodity that is gaining growers' attention is the Asian guava (Psidium guajava L.), or Thai guava, which is easily cultivated under various soil and climatic conditions (Singh, 2007). This crop has significant market appeal due to its high nutritional value (Menzel, 1985) and strong demand in Asian American communities. The downsides are that there is little information about production costs and there has been no systematic assessment of the risks in this niche market. The small market for this product can easily become oversupplied, causing a downward spiral in market price of Thai guavas. An analysis of the risks and uncertainties associated with growing Thai guavas needs to be factored into the equation before growers embark on such an investment.
Purpose
The purpose of the analysis reported here was to assess the profitability of operating a 5-acre Thai guava orchard in South Florida by incorporating yield and price risks. This article also examines an alternative way for Extension specialists to present findings to help growers better assess the risks associated with alternative crop enterprises.
Methodology and Main Assumptions of the Analysis
The analysis presented in this article was based on information collected in 2012 and 2014 from interviews with growers, Extension agents, University of Florida faculty, and industry experts and suppliers. The main focus was the establishment of production costs for a 5-acre Thai guava orchard in South Florida as a means of determining profitability for growers (Table 1).
| Establishment Years | Full Production Years | |||
| Item | Unit | Year 1 | Year 2 | |
| Estimated Yield | lb/acre | 0 | 7,841 | 31,218 |
| Estimated Price | $/lb | 0 | 0.95 | 0.95 |
| Total Receipts | dollars | 0 | 7,449 | 29,657 |
| Site Preparation Cost: | ||||
| Clear land | 1,500 | |||
| Rock plow | 150 | |||
| Disk | 35 | |||
| Build mounds | 150 | |||
| Machinery transportation fee | 300 | |||
| Irrigation (material, labor) | 1,820 | |||
| Dig well | 300 | |||
| Guava plants (363 plants/acre, $4 per plant) | 1,452 | |||
| Drill hole and plant | 908 | |||
| Total Site Preparation | $/acre | 5,115 | ||
| Preharvest Variable Cost: | ||||
| Irrigation | 47 | 47 | 47 | |
| Fertilizer | 337 | 354 | 354 | |
| Iron | 120 | 133 | 133 | |
| Herbicide | 207 | 212 | 212 | |
| Fungicide | 51 | 74 | 74 | |
| Insecticide | 49 | 17 | 17 | |
| Bags and nets | 26 | 237 | 1,047 | |
| Mowing | 120 | 120 | 120 | |
| Labor costs (pruning, fertilizing, etc.) | 953 | 2,225 | 3,997 | |
| Irrigation repairs | 0 | 20 | 40 | |
| All other repairs | 49 | 49 | 40 | |
| Interest on preharvest costs | 354 | 174 | 304 | |
| Total Preharvest Variable Costs | $/acre | 2,312 | 174 | |
| Harvesting: | ||||
| Picking, packing, and transporting | 0 | 1,622 | 6,444 | |
| Boxes | 0 | 533 | 2,123 | |
| Total Variable Costs | $/acre | 7,427 | 5,817 | 14,960 |
| Annual Cash Fixed Costs: | ||||
| Property tax | 74 | 76 | 78 | |
| Land (rental price) | 525 | 525 | 525 | |
| Annual Noncash Fixed Costs: | ||||
| Irrigation equipment | 108 | 108 | 108 | |
| Other machinery and equipment | 486 | 486 | 486 | |
| Amortized establishment cost | 737 | |||
| Total Fixed Costs | $/acre | 1,192 | 1,195 | 1,934 |
| Accrued Interest on Establishment | 0 | 431 | — | |
| TOTAL COSTS | $/acre | 8,619 | 7,442 | 16,893 |
| NET RETURNS | $/acre | (8,619) | 6 | 12,764 |
| Accumulated Establishment Costs | $/acre | 8,619 | 8,612 | |
In our analysis, we used certain assumptions. Although most growers in South Florida own the land they use for production, a rental cost of $525 per acre was used to represent the opportunity cost of using the land for guava production. The variety chosen was the Thai guava due to interest among growers. The cost of a new guava plant was $4. Planting density was estimated at 363 trees per acre, based on spacing of 8 ft between trees and 15 ft between rows. The groves were mowed 10 times per year. Fertilizer treatments included applications of 20-20-20 in combination with 6-6-6, 8-16-16, or 8-3-9, depending on the development stage of the plant; chelated iron was also applied. Weed control methods included various herbicide products for weed resistance management. Fungicides were applied three times a year. Insecticides were used more heavily in the first year, followed by a different practice specific to this guava variety in the years that followed. Each individual fruit was netted and bagged when it reached about 1 in. in diameter to improve fruit quality. Depending on rainfall, a microjet irrigation system operated by a 10-hp electric pump located near the power source was used two to three times per week in season.
The hourly wage rate for field workers was $11.00, including employee benefits. Bagging and harvesting rates supplied by growers were used to calculate labor costs. It was estimated that a worker could net and bag about 1,000 fruit per day and handpick/sort/pack 500 lb of fruit per day, based on an 8-hr workday.
Also, in our analysis, none of the fruit was sold in the first year. A pack-out rate of 80% was assumed to account for the mix of number one (near perfect) and number two (having slight physical damage) fruit, implying a total marketable yield of 7,841 lb per acre and 31,218 lb per acre in years two and three, respectively.
Marketing prices were also analyzed. During the analysis period, guava prices fluctuated markedly depending on the harvest season and the quality of the fruit, with prices ranging from $0.50 to $2.00 per pound (average price is $0.95 per pound). Summer prices were lower than winter prices due to greater supply in summer.
The economic life of a guava tree is generally 20 years (Singh, 2007), with the first 2 years considered to be establishment years. Therefore, we amortized (distributed) the accumulated cost for the first 2 years over the remaining 18 years of the orchard's economic life and charged this cost to the enterprise as a fixed cost.
In addition to the deterministic (fixed) production cost budget (Table 1), a stochastic (incorporating probabilities) budget (Table 2) was prepared, using an approach similar to that outlined by Ribera and Cattaneo (2008). The simulation of the stochastic budget was based on the first full year (year 3) production data. The simulation model was specified as follows:
where
NP = net return (profit)
![]() = stochastic (probabilistic) price
= stochastic (probabilistic) price
![]() = stochastic (probabilistic) yield
= stochastic (probabilistic) yield
V1 = per yield unit variable harvesting cost
V2 = per acre production cost
FC = per acre fixed cost
Both price and yield represented the risky variables in the model. GRKS distribution (Richardson, 2006) was chosen to model the yield and price variables due to limited information.
To use GRKS distribution, minimum, middle (median), and maximum values must be defined for price and yield in a deterministic model. The minimum and maximum prices were chosen based on the observed prices from 2012 and 2014. The middle price was the estimated average price used in the deterministic model.
Minimum yield was based on discussions with growers and reflected situations in which only one crop rather than two occurs for a given year (this was set at 50% of the yield used in the deterministic model). The middle value represented the yield in the deterministic model, and the maximum yield was set at the 95% pack-out rate, rather than the 80% used in the deterministic model.
The stochastic model substituted combinations of yields and prices for the parameters in the equation defined earlier to produce 500 different total revenues, total costs, and net returns. The net return (profit) data were then analyzed by using stoplight chart/analysis to ascertain the probabilities of attaining various levels of profits as determined by the grower.
Using a stoplight chart is an easy way to demonstrate the level of risk involved in a particular investment without examining all the details. Moreover, the stoplight chart takes into consideration the risk preference of the grower by allowing the grower to specify an upper (favorable) cutoff point and a lower (unfavorable) cutoff point. The chart then shows the probability of achieving the favorable outcome as green and the probability of experiencing the unfavorable outcome typically as red. The probabilities of values falling between the favorable and unfavorable outcomes are usually shown in yellow (Richardson & Outlaw, 2008; Richardson et al., 2007; Richardson, Schumann, & Feldman, 2006).
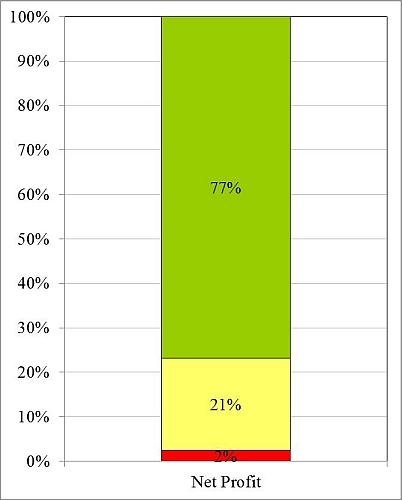
To demonstrate the use of a stoplight chart (see Figure 1), we analyzed a situation in which a grower wants to know the probability that a net return on investment will be less than $0 (implying an unfavorable outcome [a loss]) or will exceed $8,450 (implying a favorable outcome). The latter value corresponds to a 50% return on investment, based on the deterministic model. This analysis can also be carried out for other possible outcomes of interest to the grower.
Figure 1.
Probability of Net Return (Profit) Being Less Than $0 and Greater Than $8,450
Results and Discussion
Based on the data in the analysis, the estimated cost of establishing a Thai guava orchard (Table 1, year 2) was $8,612 per acre. Because the orchard would be in full production (mature) from year 3 onward, the establishment cost ($8,612) was amortized over the remaining 18 years of orchard production at an annual interest rate of 5%, for an annual fixed expense of $737 per acre.
Annual growing costs and returns for the full production years are summarized in Table 1 (last column). In a full production year, the total production cost is estimated at $16,893 per acre (this figure includes preharvest, harvesting, labor, and fixed costs). Harvesting, which is a major component of the total production cost (about 51%), is estimated at $8,567 per acre. The preharvest variable cost (about 38% of the total production cost) is estimated at $6,393 per acre, or $0.54 per pound. Labor cost is estimated at $3,997 per acre. Fixed costs are estimated at $1,934 and include the imputed land rental cost of $525 per acre.
Based on an assumed yield of 31,218 lb per acre and an average market price of $0.95 per pound, total receipts were estimated to be $29,657 per acre. When the total production cost of $16,893 is deducted from the total receipts, the grower earns a profit of $12,764 per acre.
In the real world, prices and yield tend to vary, so the stochastic budget shown in Table 2 reflects variations in prices and yield. Specifically, Table 2 shows the per-acre mean total revenue ($26,228), total cost ($16,149), and net return ($13,079) for a 5-acre orchard, based on the 500 iterations in the simulation. The values in Table 2 correspond closely to the deterministic budget figures of $29,657, $16,893, and $12,764 per acre, respectively, shown in Table 1. However, the stochastic budget provides additional information by showing the maximum and minimum values that could be realized by a grower. For example, the maximum profit could be as high as $21,989 per acre, and the minimum profit/loss could be as low as −$8,578 per acre (Table 2). Such information is important for the grower's decision-making process.
| Total Revenue | Total Cost | Net Return | |
| Mean | 29,228 | 16,149 | 13,079 |
| Standard Deviation | 4,447 | 2,111 | 6,213 |
| Min | 11,588 | 8,908 | –8,578 |
| Max | 35,539 | 20,166 | 21,989 |
On the basis of the scenario referred to earlier, the stoplight analysis chart (Figure 1) was used to shed further light on the risk associated with investing in a guava orchard. The results from the stoplight analysis suggest that there is a 2% chance of a loss (less than $0) and a 77% chance of a gain exceeding $8,450. This finding implies that there is a 21% chance that net returns will be greater than $0 but less than $8,450. Aided by such information, an Extension agent can better inform a grower of the potential risks associated with investing in the crop.
Conclusions
Based on the analysis, the total cost to establish a 5-acre Thai guava orchard in South Florida was $43,060, or $8,612 per acre. The total cost of operating a mature Thai guava orchard (from the third year onward) was $16,893 per acre. With an average price of $0.95 per pound and a marketable yield of 31,218 lb per acre, total revenue was $29,657 per acre, and net return (profit) was $12,764 per acre, implying an economically viable investment.
To account for risk in the operation, the deterministic model was converted into a stochastic model by using GRKS distributions. A stoplight analysis showed that there was a 2% chance of a loss and a 77% chance of net returns exceeding $8,450, or 50% return on investment.
An important aspect for Extension is not to make decisions for clients but to provide them with the necessary tools and information to improve their decision-making skills. Using stoplight analysis greatly simplifies the complex information Extension agents may present to clients regarding the riskiness of a particular investment. The concept of "red is bad, green is good, and yellow is okay" makes this analysis easy for clientele to understand and use. Moreover, presenting the probability (chance) of achieving/not achieving a desired result is superior to presenting idealized figures that are seldom realized. Studies have shown that growers are more willing to adopt technologies and cultural practices when they understand the risks involved before making an investment. Although this study deals only with the probability of achieving profits for Thai guava, it has wider implications for how to better present information to clients based on the chance or likelihood of achieving a desired outcome.
References
Degner, R. L., Stevens, T. J., & Morgan, K. L. (2002). Miami-Dade County agricultural land retention study, Appendix B (Vol. 3 of 6). Gainesville, FL: Florida Agricultural Market Research Center, University of Florida.
Menzel, C. M. (1985). Guava: An exotic fruit with potential in Queensland. Queensland Agricultural Journal, 111(2), 93–98
Ribera, L. A., & Cattaneo, M. (2008). Economics of variety selection for cotton cultivars in the Lower Rio Grande Valley, Texas. Journal of Extension [Online], 46(5) Article 5RIB3. Available at: http://www.joe.org/joe/2008october/rb3p.shtml
Richardson, J. W. (2006). Simulation for applied risk management. College Station, TX: Texas A&M University.
Richardson, J. W., Lemmer, W. J., & Outlaw, J. L. (2007). Bio-ethanol production from wheat in the winter rainfall region of South Africa: A quantitative risk analysis. International Food Agribusiness Management Review, 10(2), 181–204.
Richardson, J. W., & Outlaw, J. L. (2008). Ranking risky alternatives: Innovations in subjective utility analysis. Communications Technology, 39, 213–224.
Richardson, J. W., Schumann, K. D., & Feldman, P. A. (2006). Simetar: Simulation for Excel to analyze risk. College Station, TX: Texas A&M University.
Singh, G. (2007). Recent development in the production of guava. Acta Horticulture, 735, 161–176.
Steele, D., & Crane, J. (2006). The state of the Florida tropical fruit industry and the challenges growers face. Proceedings of the Florida State Horticulture Society, 110, 7–8.