December 2016
|
December 2016 // Volume 54 // Number 6 // Research In Brief // v54-6rb2


Analyzing the Implementation of Nutrient Management Plans by Farmers: Implications for Extension Education
Abstract
We conducted case studies on four Connecticut dairy farms to evaluate how well farmers implemented their nutrient management plans (NMPs). Our findings can help Extension educators develop programs to improve NMPs and NMP adoption by farmers. We identified three educational topic areas that would likely increase NMP understanding and acceptance: (a) soil testing protocol, results interpretation, and nutrient recommendations; (b) manure fertilizer-equivalent value, proper application, and effective distribution; and (c) costs and benefits of substituting on-farm manure for purchased commercial fertilizer. A new adaptive nutrient management program presents a timely opportunity for cost-effective and collaborative on-farm education efforts by Extension and the Natural Resources Conservation Service.
Introduction
The U.S. Environmental Protection Agency requires the use of nutrient management plans (NMPs) in large animal feeding operations to help mitigate nutrient losses to groundwater and surface waters. Farmers who manage these operations are expected to apply fertilizer and manure to cropland in compliance with their NMPs. This compliance is critical for many Connecticut dairy farms because (a) manure supplies exceed the land's nutrient storage/assimilation capacity, (b) off-farm feed imports—required to supplement on-farm forage production—have contributed to nutrient imbalances, and (c) excess soil phosphorus (P) has accumulated from a long history of manure applications (Bacon, Lanyon, & Schlauder, 1990; Frink, 1969).
However, studies have shown that applying manure as recommended in NMPs is costly and sometimes impractical (e.g., Battel & Krueger, 2005). As a result, and because regulatory oversight, penalty enforcement, and viable manure-application alternatives are lacking, farmers often deliver manure to fields closest to manure storage lagoons to minimize hauling costs. This practice leads to excess nutrient applications on cropland near manure storage structures (Adhikari, Paudel, Martin, & Gauthier, 2005; Innes, 2000).
Since 1999, dozens of farmers have voluntarily collaborated with University of Connecticut researchers and Extension educators to develop field-by-field, P-based NMPs. To document their NMP implementation, farmers have prepared field-by-field nutrient application records. Using these records, we have conducted extensive soil, crop, and socioeconomic analyses to evaluate the degree to which farmers have adopted NMP-based recommendations and to identify factors that have influenced farmers' decisions to deviate from recommendations (Tao, Morris, Bravo-Ureta, & Meinert, 2014; Tao, Morris, Bravo-Ureta, Meinert, & Neafsey, 2012; Tao et al., 2010). Herein, we summarize our findings to help Extension educators and Natural Resources Conservation Service (NRCS) personnel develop programs for improving NMPs and obtaining greater adoption of NMP-recommended practices.
Materials and Methods
Our research has involved two large and two medium-sized dairy farms, representative of typical dairy operations in Connecticut (Table 1). All four farmers kept thorough field-by-field nutrient application records and were willing to allow publication of those records.
| Cropland | ||||||||
| Farm |
NMP implementation (# of years) |
Milking cows (#/yr) |
Manure applied (106 L/yr) |
Fields (#/yr) | Total (ha/yr) | Corn silage (ha/yr) | Grass (ha/yr) | |
| 1 | 5 | 748 | 21.9 | 155 | 499 | 321 | 156 | |
| 2 | 5 | 543 | 20.8 | 242 | 565 | 257 | 236 | |
| 3 | 4 | 191 | 7.4 | 75 | 177 | 106 | 63 | |
| 4 | 4 | 178 | 7.0 | 56 | 134 | 96 | 37 | |
| Note. NMP = nutrient management plan. Adapted from "Nutrient Applications Reported by Farmers Compared with Performance-Based Nutrient Management Plans," by H. Tao, T. F. Morris, B. Bravo-Ureta, R. Meinert, and J. Neafsey, 2012, Agronomy Journal, 104, pp. 437–447. | ||||||||
The farmers collected soil samples for routine testing at least once every 3 years for all their cornfields. Soil P in the cornfields was estimated through the use of the modified Morgan soil test (McIntosh, 1969). On average, 60% of cornfields were tested for soil nitrogen (N) availability through the use of the pre-sidedress soil nitrate test (PSNT) (Magdoff, Ross, & Amadon, 1984). For this 60%, the PSNT was used for fertilizer N recommendations; for the other 40%, the yield goal method (Stanford, 1973) was used for fertilizer N recommendations.
To estimate NMP compliance, we categorized application records on the basis of whether nutrients were overapplied, applied as recommended, or underapplied. Applications were deemed to be "as recommended" if reported rates were within +/− 10% of recommendations. We developed frequency bar charts to show percentages of cornfields in each of the three application-rate categories for both fertilizer and manure P and N. We created box plots to visually summarize the median, variation, and differences between recommended and reported application rates.
We used SAS version 9.1.3 (SAS Institute, Cary, NC) to perform statistical analyses. We analyzed (a) changes in soil test P (estimated P levels based on soil tests performed over years), using the mixed procedure, and (b) probability of farmers' adopting recommendations for sidedress N, using the Tukey procedure for multiple comparisons for proportions.
We evaluated the costs and benefits of adopting NMPs for manure management by implementing the partial budgeting procedure (Kay, Edwards, & Duffy, 2004). Partial budgeting provides a consistent method for estimating the expected change in net revenues from a proposed change in the farm business. Relative to NMP adoption, increased costs are associated with manure handling, record keeping, soil and tissue sampling and testing, and Extension specialist meetings. Decreased costs result from substituting the fertilizer-equivalent value of manure for purchased fertilizer.
Results and Discussion
Value of Soil Testing for NMP Fertilizer Recommendations and Adoption
Soil testing is useful not only for making NMP recommendations but also for evaluating adoption of those recommendations and any resulting effects. In Figures 1 and 2 and the narrative that follows the figures, we present and discuss findings relevant to this concept.
Figure 1.
Percentages of Cornfields That Received Fertilizer P or N in Amounts Greater Than, Equal to, or Less Than NMP-Recommended Amounts, Illustrating Differences by Year and Among Farms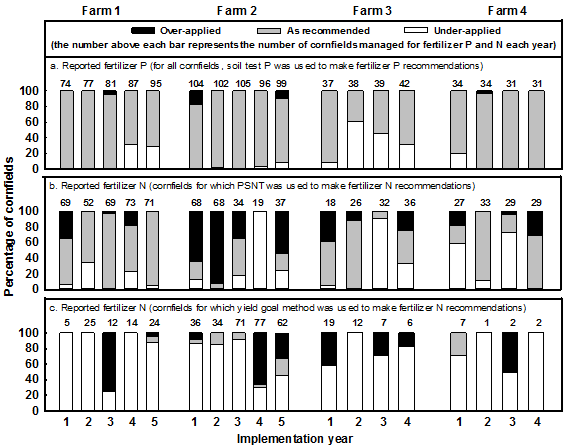
Note. NMP = nutrient management plan. PSNT = pre-sidedress soil nitrate test. Adapted from "Nutrient Applications Reported by Farmers Compared with Performance-Based Nutrient Management Plans," by H. Tao, T. F. Morris, B. Bravo-Ureta, R. Meinert, and J. Neafsey, 2012, Agronomy Journal, 104, pp. 437–447.
Figure 2.
Distribution of Differences Between Amount of Fertilizer P or N Applied and Amount Recommended
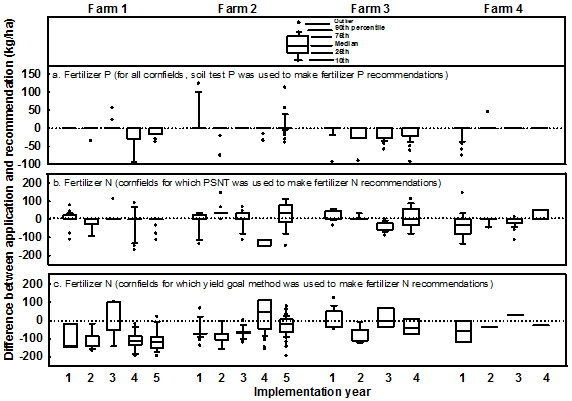
Note. PSNT = pre-sidedress soil nitrate test. Adapted from "Nutrient Applications Reported by Farmers Compared with Performance-Based Nutrient Management Plans," by H. Tao, T. F. Morris, B. Bravo-Ureta, R. Meinert, and J. Neafsey, 2012, Agronomy Journal, 104, pp. 437–447.
Soil Test P
On all four farms, mean soil test P values exceeded the agronomic critical concentration of 10 ppm. Additionally, many of the cornfields exhibited mean soil test P values above the environmental critical concentration of 40 ppm. Consequently, a recommendation of no fertilizer P was applicable to a majority of the fields. Field records indicated that farmers had been willing to adopt this recommendation (Figure 1, graph a; Figure 2, graph a).
Improvements in soil P can be objectively evaluated through the tracking of soil test records over time. If P-based NMPs are followed, soil P can decrease over many years without negatively affecting yields in high-P soils (Maguire, Mullins, & Brosius, 2008). Over our 6-year study, we found no significant differences in annual soil test P values. Possible reasons for this finding are as follows:
- Farmers in the study did not follow their NMPs' manure recommendations (see Figures 3 and 4).
- Soil test P values decrease slowly as a result of reductions in P additions (McCollum, 1991); thus, many years of soil sample data are likely necessary if significant improvements are to be identified.
- Soil tests might not have captured the spatial variation of P. Both large cornfields (Schepers, Schlemmer, & Ferguson, 2000) and small cornfields (Needelman, Gburek, Sharpley, & Petersen, 2001) having histories of manure applications can exhibit large spatial variations in soil test P.
- Soil samples were analyzed by different soil test laboratories, which can result in highly variable soil test P values (Neufeld & Davison, 2000).
Accordingly, Extension educational programs should address the following important management practices:
- Categorize fields by soil test P results—above, equal to, or below the critical agronomic concentration (10 ppm).
- Reduce or eliminate manure applications on fields with extremely high soil P values to avoid further accumulation of soil P.
- Apply manure to fields with low soil P values to improve soil fertility and P availability.
- Perform soil tests every 3 years—or preferably annually—for many years to track changes in soil P.
- Increase number and areal representation of soil samples, using standard sampling protocols, to account for the spatial variability of soil P.
- Use the same soil test laboratory every year.
Soil Test N
Farmers applied recommended rates of sidedress N to most fields with PSNT-based fertilizer N recommendations (Figure 1, graph b; Figure 2, graph b). Further analyses (Table 2) revealed the following:
- Farmers applied recommended rates of fertilizer N to 79%–90% of fields when the PSNT-indicated rate was zero.
- Farmers applied recommended rates of fertilizer N to only 6%–24% of fields when the PSNT-indicated rate was greater than zero.
| Area of analysis | Fertilizer N recommendation = 0 | Fertilizer N recommendation > 0 | ||||||
| Nonmanured fields | Manured fields | Nonmanured fields | Manured fields | |||||
| Preplant | No preplant | Preplant | No preplant | Preplant | No preplant | Preplant | No preplant | |
| Probability (%) | 85 | 79 | 89 | 90 | 6 | 16 | 11 | 24 |
| Number of observations | 85 | 42 | 77 | 246 | 31 | 62 | 36 | 333 |
| Note. Adapted from "Nutrient Applications Reported by Farmers Compared with Performance-Based Nutrient Management Plans," by H. Tao, T. F. Morris, B. Bravo-Ureta, R. Meinert, and J. Neafsey, 2012, Agronomy Journal, 104, pp. 437–447. | ||||||||
The farmers' behavior was consistent with findings from previous studies, which have indicated that PSNT is most reliable when the N recommendation is zero. PSNT demonstrates less accuracy for predicting N fertilization rates greater than zero due to uncertainties in estimating N availability for the remaining growing season (Fox, Roth, Iversen, & Piekielek, 1989).
Generally, farmers applied less fertilizer N than recommended to fields tested through the use of the yield goal method (Figure 1, graph c; Figure 2, graph c). This circumstance might be explained by the farmers' adjusting fertilizer applications on the basis of knowing fields' manure application histories. Soils with a long history of manure applications often contain excessive N and are difficult to assess for N availability (Hooker & Morris, 1999).
Extension personnel working with farmers should be aware that when farmers use the yield goal method's fertilizer N recommendations, additional information about individual fields and management practices, including manure application histories, crop rotations, and soil organic matter levels, should be collected. Recommendations should be adjusted on the basis of this information and PSNT results from previous years, when available. Also, collecting yield data is important for determining whether applying fertilizer N at rates lower than recommended limits yield potential.
Differences in Adoption of Manure Application Recommendations
Farmers deviated from NMP recommendations for manure applications for the majority of fields on all four farms. Only small percentages of the fields (3%–37%) received recommended applications (Figure 3). Median values for the differences between amount of manure applied and amount recommended varied greatly; some fields received large excesses of manure, whereas others received significantly less than the recommended amounts (Figure 4).
Figure 3.
Percentages of Cornfields That Received Manure P or N in Amounts Greater Than, Equal to, or Less Than NMP-Recommended Amounts, Illustrating Differences by Year and Among Farms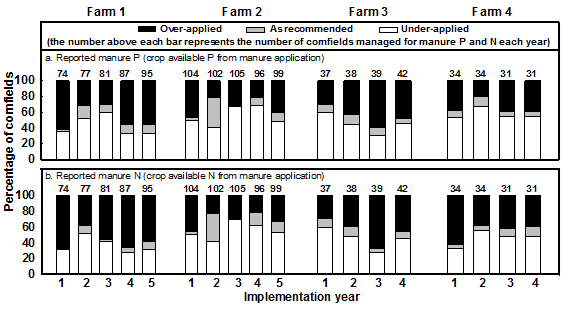
Note. NMP = nutrient management plan. Adapted from "Nutrient Applications Reported by Farmers Compared with Performance-Based Nutrient Management Plans," by H. Tao, T. F. Morris, B. Bravo-Ureta, R. Meinert, and J. Neafsey, 2012, Agronomy Journal, 104, pp. 437–447.
Figure 4.
Distribution of Differences Between Amount of Manure P or N Applied and Amount Recommended
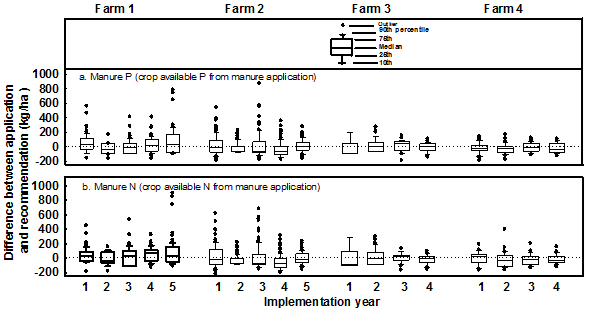
Note. Adapted from "Nutrient Applications Reported by Farmers Compared with Performance-Based Nutrient Management Plans," by H. Tao, T. F. Morris, B. Bravo-Ureta, R. Meinert, and J. Neafsey, 2012, Agronomy Journal, 104, pp. 437–447.
Organic matter that accumulates in soil from long-term excessive manure applications can release significant amounts of N through mineralization. Long-term excessive manure applications also can cause P accumulation. Thus, misguided manure nutrient management can cause significant N and P losses (Toth, Dou, Ferguson, Galligan, & Ramberg, 2006). Extension education programs should reinforce the value of field-based soil testing and explain test results relative to agronomic and environmental thresholds (Everett & Vickery, 2005). On-farm strip trials (Natural Resources Conservation Service, 2013) can demonstrate both the risks of applying manure to fields with high soil-test values and the benefits of applying manure to fields with low soil-test values.
Major Reasons for Deviations from Manure Application Recommendations
Expense of Spreading Manure
Similar to other researchers (Adhikari et al., 2005; Innes, 2000), we found that farmers tend to apply manure to fields closest to storage lagoons at rates greater than recommended. The primary reason for this behavior was cost savings (Tao et al., 2010). To comply with manure recommendations, the farmers in our study should have increased hauling distances 34%–98% and within-field spreading distances 5%–25% (Table 3).
| Farm | Reported in baseline year | NMP mean increase from baseline | Reported mean in subsequent years | NMP mean increase compared to reported in subsequent years | ||||
| Transport | Spread | Transport | Spread | Transport | Spread | Transport | Spread | |
| km/yr | % | km/yr | % | |||||
| 1 | 8,343 | 777 | 66 | 30 | 8,146 | 815 | 87 | 25 |
| 2 | 11,231 | 986 | 63 | 26 | 13,356 | 1,053 | 34 | 20 |
| 3 | 3,675 | 513 | 67 | 17 | 3,941 | 534 | 79 | 14 |
| 4 | 2,516 | 312 | 90 | 8 | 2,458 | 357 | 98 | 5 |
| Note. NMP = nutrient management plan. Adapted from "A Partial Budget Analysis for Phosphorus-Based Nutrient Management Plans for Connecticut Dairy Farms," by H. Tao, T. F. Morris, B. Bravo-Ureta, R. Meinert, K. Zanger, and J. Neafsey, 2010, Agronomy Journal, 102, pp. 231–240. | ||||||||
The mean annual cost of adopting NMP-recommended manure hauling and spreading distances ranged from $4,200 for Farm 4 to $14,600 for Farm 1 (Table 4). Mean annual change in net revenue ranged from $−2,200 for Farm 1 to $19,3000 for Farm 2. Determining whether increased costs could be offset by fertilizer replacement values was complicated and dependent on numerous variables and uncertainties, including (a) manure application rates, (b) manure nutrient availability, (c) soil nutrient statuses, and (d) farmers' abilities to optimize manure allocations in their decision-making processes (Tao et al., 2010).
| Annual and mean changes compared to farmer-reported manure management, postbaseline years ($/yr) | |||||||
| Farm | NMP-based manure management | 2000 | 2001 | 2002 | 2003 | 2004 | M |
| 1 | Increased costs | 4,900 | — | 18,300 | 16,400 | 18,800 | 14,600 |
| Reduced costs | 3,200 | — | 18,300 | 8,700 | 19,700 | 12,500 | |
| Expected change in net revenue | −1,700 | — | 0 | −7,700 | 800 | −2,200 | |
| 2 | Increased costs | −3,900 | 17,400 | — | 8,500 | 7,300 | |
| Reduced costs | 11,500 | 46,700 | — | 21,600 | 26,600 | ||
| Expected change in net revenue | 15,400 | 29,200 | — | 13,200 | 19,300 | ||
| 3 | Increased costs | 8,700 | 2,300 | 4,000 | 2,400 | 4,400 | |
| Reduced costs | 8,700 | 4,900 | 5,600 | 8,000 | 6,800 | ||
| Expected change in net revenue | 100 | 2,600 | 1,600 | 5,700 | 2,500 | ||
| 4 | Increased costs | 5,000 | 6,300 | 3,900 | 1,600 | 4,200 | |
| Reduced costs | 4,400 | 12,800 | 3,400 | 1,400 | 5,500 | ||
| Expected change in net revenue | −400 | 6,500 | −600 | −200 | 1,300 | ||
| Note. NMP = nutrient management plan. Dash (—) indicates that data were unavailable due to incomplete records. Adapted from "A Partial Budget Analysis for Phosphorus-Based Nutrient Management Plans for Connecticut Dairy Farms," by H. Tao, T. F. Morris, B. Bravo-Ureta, R. Meinert, K. Zanger, and J. Neafsey, 2010, Agronomy Journal, 102, pp. 231–240. | |||||||
Lack of Efficient and Low-Cost Manure Handling Machinery
Manure transport to distant fields occurred more often on the two large farms than on the medium-sized farms. On the larger farm operations, semi-tanker trucks were available for transporting manure from lagoons to fields and automated in-field pumping systems could be used to pump manure from semi-tankers to manure spreaders. By contrast, on the two medium-sized farm operations, only tractors and spreaders were available; the low capacities and slow speeds of the tractors made long-distance transport of manure impractical (Tao et al., 2014).
Farmers who have medium-sized operations may need incentives to purchase tanker trucks or to use a custom hauling service. Organizing medium- and small-scale farmers so that the cost and use of tanker trucks and in-field pumps can be shared might be another option.
Potential for Collaboration Between Extension and NRCS to Increase NMP Implementation
A new adaptive nutrient management program (Natural Resources Conservation Service, 2013) may offer Extension educators an opportunity to collaborate with NRCS personnel in farmer education programs. Cost sharing through the Environmental Quality Incentives Program could underwrite the use of on-farm strip trials for demonstrating alternative nutrient management practices. Furthermore, the dissemination of information about successes and lessons learned could increase farm operators' understanding of the agronomic and environmental benefits of NMPs and favorably influence NMP adoption.
Conclusions and Recommendations
Overall, farmers were more likely to follow soil test–based recommendations for fertilizer P and N but less likely to follow recommendations for fertilizer-equivalent manure P and N. Manure handling costs and benefit uncertainties were major factors that contributed to this behavior. Incentives and innovative methods are needed to reduce on-farm manure handling costs. Extension education programs should be developed to increase farmers' understanding of soil sampling procedures; soil test results; and agronomic, economic, and environmental benefits of properly distributed manure applications. A collaborative Extension–NRCS education program may offer a cost-effective way to conduct on-farm trials, evaluate farmer practices, and improve and increase adoption of NMPs. Exporting manure off farm for alternative uses could be a viable solution for farms that produce manure in excess of cropland capacity.
Acknowledgments
This work was partially funded by grant #2011-67024-30912, Agricultural Food Research Initiative, National Institute of Food and Agriculture, U.S. Department of Agriculture. We thank Linda R. Klein for valuable advice and editing of the manuscript.
References
Adhikari, M., Paudel, K. P., Martin, N. R. Jr., & Gauthier, W. M. (2005). Economics of dairy waste use as fertilizer in central Texas. Waste Management, 25, 1067–1074.
Bacon, S. C., Lanyon, L. E., & Schlauder, R. M. Jr. (1990). Plant nutrient flow in the managed pathways of an intensive dairy farm. Agronomy Journal, 82, 755–761.
Battel, R. D., & Krueger, D. E. (2005). Barriers to change: Farmers' willingness to adopt sustainable manure management practices. Journal of Extension, 43(4) Article 4FEA7. Available at: http://www.joe.org/joe/2005august/a7.php
Everett, L. A., & Vickery, J. (2005). Land application of manure: Minnesota livestock producers' practices and educational needs. Journal of Extension, 43(3) Article 3RIB8. Available at: http://www.joe.org/joe/2005june/rb8.php
Fox, R. H., Roth, G. W., Iversen, K. V., & Piekielek, W. P. (1989). Soil and tissue nitrate tests compared for predicting soil nitrogen availability to corn. Agronomy Journal, 81, 971–974.
Frink, C. R. (1969). Water pollution potential estimated from farm nutrient budgets. Agronomy Journal, 61, 550–553.
Hooker, B. A., & Morris, T. F. (1999). End-of-season corn stalk test for excess nitrogen in silage corn. Journal of Production Agriculture, 12, 282–288.
Innes, R. (2000). The economics of livestock waste and its regulations. American Journal of Agricultural Economics, 82, 97–117.
Kay, R. D., Edwards, W. M., & Duffy, P. A. (2004). Farm management. New York, NY: McGraw-Hill.
Magdoff, F. R., Ross, D., & Amadon, J. (1984). A soil test for nitrogen availability to corn. Soil Science Society of America Journal, 48, 1301–1304.
Maguire, R. O., Mullins, G. L., & Brosius, M. (2008). Evaluating long-term nitrogen- versus phosphorus-based nutrient management of poultry litter. Journal of Environmental Quality, 37, 1810–1816.
McCollum, R.E. (1991). Buildup and decline in soil phosphorus: 30-year trends on a typic umprabuult. Agronomy Journal, 83, 77–85.
McIntosh, J. L. (1969). Bray and Morgan soil extractants modified for testing acid soils from different parent materials. Agronomy Journal, 61, 259–265.
Natural Resources Conservation Service. (2013). Adaptive nutrient management process (Agronomy technical note no. 7). Retrieved from http://directives.sc.egov.usda.gov/OpenNonWebContent.aspx?content=33791.wba
Needelman, B. A., Gburek, W. J., Sharpley, A. N., & Petersen, G. W. (2001). Environmental management of soil phosphorus: Modeling spatial variability in small fields. Soil Science Society of America Journal, 65, 1516–1522.
Neufeld, J., & Davison, J. (2000). Journal of Extension, 38(4) Article 4RIB2. Available at: http://www.joe.org/joe/2000august/rb2.php
Schepers, J. S., Schlemmer, M. R., & Ferguson, R. B. (2000). Site-specific considerations for managing phosphorus. Journal of Environmental Quality, 29, 125–130.
Stanford, G. (1973). Rationale for optimum nitrogen fertilization in corn production. Journal of Environmental Quality, 2, 159–166.
Tao, H., Morris, T. F., Bravo-Ureta, B., & Meinert, R. (2014). Factors affecting manure applications as directed by nutrient management plans at four Connecticut dairy farms. Agronomy Journal, 106, 1420–1426.
Tao, H., Morris, T. F., Bravo-Ureta, B., Meinert, R. & Neafsey, J. (2012). Nutrient applications reported by farmers compared with performance-based nutrient management plans. Agronomy Journal, 104, 437–447.
Tao, H., Morris, T. F., Bravo-Ureta, B., Meinert, R., Zanger, K., & Neafsey, J. (2010). A partial budget analysis for phosphorus-based nutrient management plans for Connecticut dairy farms. Agronomy Journal, 102, 231–240.
Toth, J. D., Dou, D., Ferguson, J. D., Galligan, D. T., & Ramberg, C. F. Jr. (2006). Nitrogen- vs. phosphorus-based dairy manure applications to field crops: Nitrate and phosphorus leaching and soil phosphorus accumulation. Journal of Environmental Quality, 35, 2303–2312.