August 2016
|
August 2016 // Volume 54 // Number 4 // Research In Brief // v54-4rb6


Evaluation Strategies in Financial Education: Evaluation with Imperfect Instruments
Abstract
Program evaluation often suffers due to time constraints, imperfect instruments, incomplete data, and the need to report standardized metrics. This article about the evaluation process for the Wi$eUp financial education program showcases the difficulties inherent in evaluation and suggests best practices for assessing program effectiveness. We analyzed the stated behaviors of 125 Wi$eUp survey respondents, finding that debt education produced a greater change in behavior than savings education did but that survey questions related to savings did not reflect the material in the associated module, potentially lowering scores. Longer evaluation periods and better matching of evaluation questions to the content delivered may improve the evaluation process.
Introduction
Evaluation is essential for advancing evidence-based educational programs. Through rigorous evaluation, educators can determine the extent of a program's impact, identify opportunities for improvement, and make the case for further expansion of a program (Roucan-Kane, 2008). Although some organizations may be limited by means and scope, building evaluation into the program design ensures that mistakes and successes will be documented to provide even greater services to stakeholders in the future (Messy & Atkinson, 2012). The study addressed in this article examines mistakes, successes, and lessons learned through the evaluation of the Wi$eUp Extension financial education program. The motivations are to point out pitfalls of conducting evaluation with nonideal instruments and to suggest specific strategies to improve program evaluation.
Program evaluations must be guided by program purpose (Taylor-Powell, Steele, & Douglas, 1996). Many evaluations in the past focused on evaluating demonstrated knowledge (Arnold, 2002; Mandell, 2009), but recent guidance for evaluations suggests shifting the focus to behavioral changes resulting from education (Messy & Atkinson, 2012). Taylor-Powell et al. (1996) described the need for practical, systematic evaluation for Extension programs. Logic models tie target behaviors to a program's activities and resources and provide a guiding framework for determining which evaluation data are necessary (Arnold, 2002; Braverman & Engle, 2009).
Extension educators should choose an evaluation method that allows them to most directly document the target behavior. Evaluation questions must seek to carefully replicate the data that direct observation would provide, if such observation is not feasible. Evaluation questions must be carefully chosen because failure to ask the right evaluation questions obscures the true extent of a program's impact (Radhakrishna & Relado, 2009).
This article explores the evaluation process for a Texas A&M AgriLife Extension Service financial education program, discusses the difficulties inherent in evaluation, and shares best practices being circulated to help assess program effectiveness.
Introduction to Wi$eUp
Wi$eUp is a financial education program that provides participants with tools and behavioral skill sets to decrease debt and increase savings. The eight-module Wi$eUp curriculum, which specifically targets Generation X and Y women, was created by the U.S. Department of Labor Women's Bureau and Texas A&M AgriLife Extension Service, using data from a series of 2003 focus group sessions to identify the needs, interests, and preferences of young women. Nearly 23,000 participants have enrolled in Wi$eUp, either online or in community-based workshops.
The logic model in Figure 1 demonstrates how Wi$eUp addresses debt and savings, beginning with the target population's high rates of debt and low rates of savings, moving through the curriculum, and leading to changing attitudes and behaviors. Evaluations of previous financial education efforts by other Extension programs, such as Money 2000, Dollar Works 2, and Money Smart, showed that participants learned to save more and take on more financially healthful behaviors (Bauer, Son, Hur, & Anderson-Porisch, 2011; Family Development & Resource Management, 2014; Money Smart, 2013; Peterson, Heins, & Katras, 2013).
Figure 1.
Wi$eUp Logic Model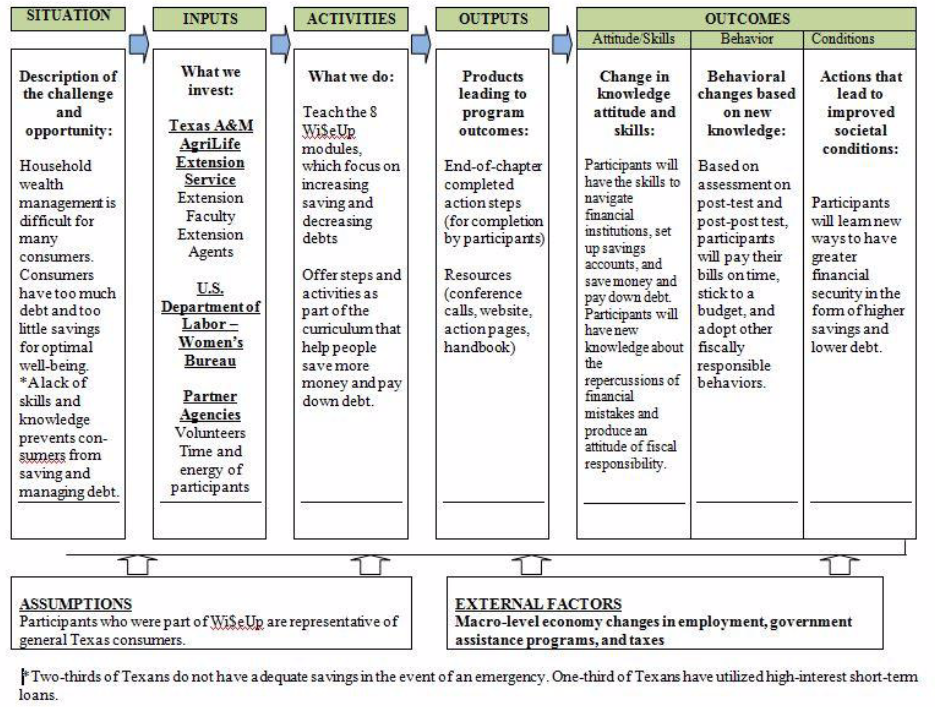
The Wi$eUp logic model guided program evaluation. Rather than being tested on knowledge, participants reported on the adoption and sustainment of target behaviors related to debt and savings and associated with improved financial health. Wi$eUp presented participants with a pretreatment survey immediately before they encountered the material, a posttreatment survey after completing each module, and a post-posttreatment (final) survey about 3 months after completing the course. The Texas A&M University System Institutional Review Board approved the evaluation and all related instruments.
Methods
The final survey measured target behavior by asking participants about behaviors that had occurred only since participation in Wi$eUp, with questions such as "I now . . ." or "I have . . . since taking the Wi$eUp course," to reemphasize the desired chronology for measurement. A total "yes" answer tally greater than zero indicated that the participant had changed her behavior since participating in Wi$eUp.
Wi$eUp summary records contained module completion data for each participant, although scores from the pre- and posttreatment surveys were not available. Completion records were matched to participant IDs on the final surveys to compare learning expectations with reported behaviors.
Final survey questions were broadly organized into debt items and savings items, using Hilgert and Hogarth's (2003) system of classification. The discipline-wide framework for survey questions and responses allows Wi$eUp to be compared with other programs that have asked the same questions (Hilgert & Hogarth, 2003; Lusardi, 2008).
The final survey contained 30 yes-or-no questions asking participants whether they had made behavioral changes related to debt and savings since completing the Wi$eUp program. New financially healthful debt or savings behaviors reported by each participant were tallied. The resulting quantitative variables are referred to as the healthful debt score and the healthful savings score.
A comparable, quantitative score can be useful for evaluators who wish to assess different groups and examine which groups have various behaviors. For example, Extension educators who wish to examine behavioral changes may choose to compare a "treatment" group with a group that has not received the program intervention. In Wi$eUp, there are three distinct respondent groups: those who took only the debt module, those who took only the savings module, and those who took both modules.
The first method of data examination was measuring the efficacy of the separate modules by comparing healthful debt scores and healthful savings scores among three groups: those who took only the debt module, those who took only the savings module, and those who took both modules. A one-way analysis of variance was used to determine whether the difference in scores among the groups was statistically significant. The estimated relationship between education and financial behavior was then modeled using an ordinary least squares regression (Lusardi, 2008; Mandell, 2009).
Results
Overall, Wi$eUp participants surveyed during the evaluation were older than the targeted Generation X and Y population, racially diverse, and evenly split across various levels of educational attainment. The participant data were all from paper surveys, which were used only if a participant provided no email address. (Following a move to a new location, electronic responses were unable to be accessed.)
The evaluation indicated that surveyed program participants were not overwhelming part of the intended population. Wi$eUp was designed for women in Generations X and Y, yet nearly 40% of the participants reported being over 50. The possible causes of this circumstance are myriad and should be explored before implementing similar programs. It is probable that older participants were less likely to have and use email and, therefore, that this sample of mail-only responses overrepresents the true proportion of older participants (Israel, 2010).
Survey responses indicated that 45% of participants were White. Nearly a quarter of respondents were Black. Some tribal communities implemented Wi$eUp during this period, and almost one in eight participants were Native American. Wi$eUp participants were very well educated, with more than half possessing some college education and nearly one in eight possessing a postgraduate degree.
Among 129 participants completing the Wi$eUp debt and/or savings modules, 45 participants completed both modules, 49 completed only the debt module, and 35 completed only the savings module. Table 1 contains summary statistics for the analysis of variance examinations of differences among the mean healthful debt scores. As expected, the highest average healthful debt scores overall come from the group that took both modules (4.18 healthful behaviors versus 3.57 for debt-module-only-participants and 3.17 for savings-module-only-participants). However, only the overall and the debt-only results of the different means were significant at even a p value of .2.
| Group | Count | Sum | Average | Variance | ||
| Both modules | 45.00 | 188.00 | 4.18 | 7.38 | ||
| Debt module | 49.00 | 175.00 | 3.57 | 5.67 | ||
| Savings module | 35.00 | 111.00 | 3.17 | 5.32 | ||
| ANOVA | ||||||
| Source of variation | SS | df | MS | F | p value | Fcrit |
| Between groups | 20.78 | 2.00 | 10.39 | 1.68 | .19 | 3.07 |
| Within groups | 777.55 | 126.00 | 6.17 | |||
| Total | 798.33 | 128.00 | ||||
These results may provide tentative evidence of the efficaciousness of debt education at producing measurable changes in behavior, but the results are ambiguous. Repeated application of debt education to diverse groups could provide considerably more information about the magnitude of this effect. Still, there is value in honestly reporting ambiguous results because such results provide initial evidence to other educators and researchers and because tentative relationships may be further explored or strengthened through improved program delivery and/or improved evaluation techniques. An important message for Extension educators is to look closely at ambiguous results in light of a program's logic model and determine whether programmatic changes could result in significant results.
Participants who took only the debt module had, overall, a higher average (mean) healthful savings score of 5.57 (Table 2), whereas participants who took only the savings module had the lowest average healthful savings score of 5.46. There are a couple of possible explanations for this finding: (a) Wi$eUp's content delivery was ineffective or (b) Wi$eUp's content delivery was effective but outcomes were not captured by its evaluation.
| Groups | Count | Sum | Average | Variance | |
| Both modules | 45.00 | 250.00 | 5.56 | 15.57 | |
| Debt module | 49.00 | 273.00 | 5.57 | 13.79 | |
| Savings module | 35.00 | 191.00 | 5.46 | 11.73 | |
| ANOVA | |||||
| Source of variation | SS | df | MS | F | p value |
| Between groups | 0.30 | 2.00 | 0.15 | 0.01 | .99 |
| Within groups | 1,745.80 | 126.00 | 13.86 | ||
| Total | 1,746.10 | 128.00 | |||
Looking at the specific survey questions associated with the savings scores, we found that participants who took the savings module had higher healthful savings scores on topics of overall savings, cash flow, and financial experience. Questions regarding investment/retirement comprised 45% of the questions associated with savings, but these topics were covered in a separate module that very few participants had completed. Although this standard set of questions provided comparability with other financial literacy programs, it did not reflect the specific material covered in the Wi$eUp savings module. There are tradeoffs to using nationally recognized, comparable survey instruments versus localized, content-specific ones. These tradeoffs must be carefully weighed.
The association between education and reported behaviors was modeled using ordinary least squares regression. Healthful debt scores and healthful savings scores were expected to be functions of the modules completed (X1 for the savings module, X2 for both modules, X3 for the debt module); age (A1 for 18–24, A2 for 25–30, A3 for 30–39, and ages 40 and up captured by zero for A1–A3); ethnicity (NA for Native American; B for Black; O for other ethnicity, such as Hispanic or Biracial; and White ethnicity captured by a zero for all other races); and education (E1 indicating less than a high school education is captured by zero in E2–E4, E2 for only a high school education, E3 for some college but no bachelor's degree, and E4 for a completed bachelor's degree or more education).
The coefficient for X2, completing both modules, was greater for healthful debt scores than healthful savings scores (Table 3). This result may indicate that financial education more readily produces debt behavior changes, that debt behavior is more malleable in a 3-month window (the time frame associated with the final surveys), or that this survey asked questions that imperfectly measured the curriculum content. Higher levels of education, especially college graduation and postgraduate education, were also contributors to increased healthful debt and savings scores. The findings for debt education are encouraging for proponents of providing financial literacy education.
| Healthful debt score | Healthful savings score | |
| Intercept | 2.66**** | 3.52**** |
| Debt module (X3) | −0.41 | |
| Savings module (X1) | −0.35 | |
| Both modules (X2) | 0.77* | −0.03 |
| Age |
0.16A1 −0.02A2 −0.21A3 |
0.16A1 −0.02A2 −0.21A3 |
| Education |
−0.66E2 1.13E3 1.42E4* |
−0.03E1 2.15E2* 2.76E3*** |
| Ethnicity |
−0.29NA −0.13B 0.41O |
−0.12NA −0.089B 2.16O*** |
| ****p < .01. ***p < .05. **p < .1. *p < .2. | ||
In the healthful savings score regression, the coefficient on completing the module on debt (X3) was negative and insignificant. Again, this result can be partially explained by the content of the savings module and the survey questions, which included multiple categories—savings, investment, retirement, and general financial practices—some of which were not covered in the saving module. Those who took the savings module had a greater number of "yes" answers for every category except investment and retirement. Better matching of evaluation questions to the content delivered may have given a more precise evaluation.
Summary and Implications
Evaluation can be messy. Evaluators may have imperfect instruments and incomplete data. A desire or need to report common outcomes across programs may hamper evaluation efforts if standardized metrics are not well aligned with program goals and content. Given educators' time constraints, perfect evaluation is rarely possible. Measuring and analyzing program outcomes is valuable, and sometimes educators discover that the evaluation as well as the program needs improving.
Nevertheless, this evaluation of participant survey responses from Wi$eUp suggests that education, especially debt education, may change behavior. Using a logic model streamlines and guides evaluation so that it focuses directly on the desired results (Taylor-Powell & Henert, 2008). While the logic model provided admirable guidance for this program, some of the limitations to the evaluation were due to the survey design and implementation. Extension faculty may want to consider surveys that are shorter and easier to understand and require more descriptive answers than "yes" and "no." Also, only material covered in a module should be tested. Furthermore, follow-up and ability to measure the effect of the material delivered is difficult because participants are constantly moving and juggling busy schedules.
Wi$eUp's method of evaluation, per the logic model, focused on intentions and dynamic behaviors. Wi$eUp's focus was on the ability of people to change and grow, but Extension educators should note that this growth may take years rather than months. Those involved with other financial literacy programs may choose to learn from our experience with Wi$eUp and resurvey participants, not just at 3 months but in subsequent months and years, to illuminate the role of time in changing behavior. Research that involves direct observational data associated with financial behavior, instead of reliance on self-reports, could also contribute to the knowledge base by offering more accurate data on the gap between reported and observed behavior. Continued study of behavioral factors as well as community and classroom support of behavioral modifications will provide new avenues of research and promising practice.
References
Arnold, M. (2002). Be "logical" about program evaluation: Begin with learning assessment. Journal of Extension [online], 40(3) Article 3FEA4. Available at: http://www.joe.org/joe/2002june/a4.php
Bauer, J., Son, S., Hur, J., & Anderson-Porisch, S. (2011). Dollar Works 2: Impact evaluation report. University of Minnesota Extension, University of Minnesota, St. Paul. Retrieved December 2014 from http://www.extension.umn.edu/ResourceManagement/components/DW2-impact-evaluation-report.pdf
Braverman, M. T., & Engle, M. (2009). Theory and rigor in Extension program evaluation planning. Journal of Extension [online], 47(3) Article 3FEA1. Available at: http://www.joe.org/joe/2009june/a1.php
Family Development & Resource Management. (2014). Money Smart program brief 2013. Texas A&M AgriLife Extension Service, College Station, TX, February. Retrieved December 2014 from http://fcs.tamu.edu/fcs_programs/
Hilgert, M., & Hogarth, J. (2003). Household financial management The connection between knowledge and behavior. Federal Reserve Bulletin, July. Retrieved December 2014 from http://www.federalreserve.gov/pubs/bulletin/2003/0703lead.pdf
Israel, G. D. (2010). Using web-hosted surveys to obtain responses from Extension clients: A cautionary tale. Journal of Extension [online], 48(4) Article 4FEA8. Available at: http://www.joe.org/joe/2010august/a8.php
Lusardi, A. (2008). Household saving behavior: The role of financial literacy, information, and financial education programs. Retrieved December 2014 from http://www.nber.org/papers/w13824
Mandell, L. (2009). Two cheers for school-based financial education. Initiative for Financial Security. Retrieved December 2014 from http://www.aspeninstitute.org/sites/default/files/content/docs/pubs/Two Cheers.pdf
Messy, F., & Atkinson, A. (2012). OECD, International Network on Financial Education. Retrieved December 2014 from http://www.oecd.org/daf/fin/financial-education/49373959.pdf
Money Smart—A financial education program. (2013). Federal Deposit Insurance Corporation, Washington, DC. Retrieved December 2014 from http://www.fdic.gov/consumers/consumer/moneysmart/mscbi/mscbi.html
Peterson, C., Heins, R., & Katras, M. J. (2013). Dollar Works 2: The evolution of a financial literacy program. Journal of Extension [online], 51(2) Article 2TOT8. Available at: http://www.joe.org/joe/2013april/tt8.php
Radhakrishna, R., & Relado, R. (2009). A framework to link evaluation questions to program outcomes. Journal of Extension [online], 47(3) Article 3TOT2. Available at: http://www.joe.org/joe/2009june/tt2.php
Roucan-Kane, M. (2008). Key facts and key resources for program evaluation. Journal of Extension [online], 46(1) Article 1TOT2. Available at: http://www.joe.org/joe/2008february/tt2.php
Taylor-Powell, E., & Henert, E. (2008). Developing a logic model: Teaching and training guide. University of Wisconsin-Extension Cooperative Extension, Madison, WI. Retrieved December 2014 from http://www.uwex.edu/ces/pdande/evaluation/pdf/lmguidecomplete.pdf
Taylor-Powell, E., Steele, S., & Douglas, M. (1996). Planning a program evaluation. Extension bulletin G3658-1. University of Wisconsin-Extension Cooperative Extension, Madison, WI. Retrieved December 2014 from: http://learningstore.uwex.edu/Assets/pdfs/G3658-01.pdf