August 2016
|
August 2016 // Volume 54 // Number 4 // Feature // v54-4a2


Getting Growers to Go Digital: The Power of a Positive User Experience
Abstract
Using web-based applications is an innovative approach for delivery of Extension resources. For example, myFields.info is a mobile-friendly application focused on directing stakeholders to information at the field level. Acceptance and diffusion of such applications depends on initial experiences resulting from traditional face-to-face interactions with Extension personnel. We found that crop school participants involved in an Extension training event for a web-based sampling plan showed increased willingness after the training to incorporate sampling plans in their management decisions and share relevant data with others. Specifically, our study demonstrated the value of providing hands-on experience when attempting to encourage stakeholders to accept technologies.
Introduction
It should come as no surprise that field crop producers are "going digital" when seeking answers to crop-related questions. In 2011, a multistate survey by Brown and Kelsey (2013) of 457 wheat producers revealed that 82% were finding information online for farm-related topics and 86% had invested in mobile technologies, including laptop computers (62%) and smartphones (43%). The number of crop managers using smartphones has likely increased since the Brown and Kelsey survey was conducted, as the Pew Research Center reported in 2015 that 64% of American adults owned a smartphone, an increase from 35% in spring 2011. This move toward mobile technologies reflects the demand among stakeholders for web-accessible information. Current technologies give mobile users access to information when and where they need it. Accommodating the demand for quick answers in agriculture requires innovating the delivery of Extension services by applying current technology trends (Diem, Hino, Martin, & Meisenbach, 2011), especially given existing threats to cut funds for traditional face-to-face Extension programming (Serenari, Peterson, Bardon, & Brown, 2013). The findings of Brown and Kelsey (2013) suggest that meeting stakeholders' needs will include providing information necessary for making immediate, in-field management decisions through the use of a simple, yet integrated, decision support system (DSS).
Broadly speaking, a DSS is a computerized information system for supporting decision-making activities (Power, 2008). The medical industry has been inundated with DSSs that target efficiency in patient care (reviewed by Yasnoff & Miller, 2014) and information processing (reviewed by Murphy, 2014). Examples include applications that help physicians and resource-limited medical providers avoid dosing errors (Sadasivam, Gathibandhe, Tanik, & Willig, 2012), provide up-to-date drug information (e.g., FDA Drugs), allow real-time tracking of infectious diseases (e.g., HealthMap) (Oehler, Smith, & Toney, 2010), and offer streamlined interaction with clientele by monitoring vitals or generating automated health-related reminders. The evidence that is building in favor of DSSs for improved patient care includes case studies showing reduced hospital visits and cost savings (Khan, Maclean, & Littenberg, 2010) and adherence to preventative services (Bright et al., 2012). In light of these positive impacts on health care, Extension also may benefit from DSSs. DSSs targeting agriculture could streamline the processes of delivering information to producers and encouraging producers to adopt particular practices.
Here, we focus on the idea of educating Extension agents and crop consultants about a crop production DSS, with the expectation that doing so may result in a positive effect on the adoption of the DSS among crop managers. It is well known that the acceptance of a new technology by the majority is strongly influenced by testimonies about perceived benefits from early adopters (Rogers, 1995); consequently, initial positive experiences with DSS applications or other new technologies among Extension agents and crop consultants should have a positive effect on these technologies' diffusion among and acceptance by producers. The web-based DSS we discuss in this article, like any decision tool, does not replace current Extension services, nor does it remove the management decision from the stakeholder; rather, it is meant to enhance interactions with clients.
For our study, we were interested in evaluating the potential adoption of DSS-derived sampling plans for insect pests based on perceived benefits and ease-of-use by participants at a winter crop school. Pest sampling in wheat is often overlooked even though wheat-growing areas in the southern plains states are at risk for occasional outbreaks of cereal aphids (Elliot et al., 2004). Growers are encouraged to base the treatment decision for such an outbreak on an economic threshold (ET) at the field level, an approach that is critical to maintaining the longevity of insecticides and ecosystem services (e.g., lady beetles, parasitic wasps) (Giles & Walker, 2009). Regardless of the benefits that result from ET-based sampling plans, adoption of these sampling tools by growers has been rather low (Giles & Walker, 2009). It is plausible that certain perceptions about ET-based sampling plans, particularly perceptions that they are computationally complicated or require tedious sampling efforts, are limiting their adoption. Automating these processes and storing user-dependent inputs in a web-based DSS can help overcome producers' negative perceptions of sampling plans, especially for low-value cropping systems such as wheat.
Paper Versus Digital Sampling Forms
To evaluate acceptance and perceived effectiveness of a DSS-derived sampling plan, we had participants at an Extension training event compare paper versus digital versions of Glance n' Go, an ET-based sampling plan for greenbug aphids (greenbugs) in winter wheat (Elliot et al., 2004). With this unique plan, treatment decisions are based on the presence of the greenbug pest and the presence of a natural enemy (a parasitic wasp), observed as parasitized aphid bodies called mummies (Giles, Royer, Elliott, & Kindler, 2000; Royer, Giles, & Elliott, 2002a; Royer, Giles, & Elliott, 2002b). Currently, growers can use Glance n' Go by downloading and printing sampling forms associated with the applicable ET (number of aphids per tiller) through a web application called the Cereal Aphid Decision Support Tool (available at http://entoplp.okstate.edu/gbweb/index3.htm). Specifically, the sampling forms are used as follows:
- The user opens the Greenbug Calculator from the Cereal Aphid Decision Support Tool site (http://entoplp.okstate.edu/gbweb/welcome%20gb.htm) by using a Java-based plug-in compatible with most browsers.
- The user provides information about plant stage, time of year, region, crop value, and control costs, and the calculator determines an ET based on those user inputs.
- The user is prompted to print the ET-specific sampling form as a PDF and then completes it by manually tallying observations for presence of greenbugs and mummies on wheat tillers across a wheat field.
- The user makes a treatment decision on the basis of information provided on the form. The treatment decision options—"treat," "don't treat," or "keep sampling"—are based on the running totals of observations for at least 15 tillers.
- If the "keep sampling" decision applies, the user continues sampling. In such cases, the user needs to remember to carry over the running totals.
We have simplified this process by creating Pest Sampler, a digital module on a web-based DSS called myFields.info (available at myFields.info). The myFields DSS is the result of an effort to provide crop producers with easily accessible resources and integrated pest management tools. Current tools, which include the Pest Sampler, Diagnostic Keys, and Variety Support System modules, among others, are free for site visitors and are designed for use on mobile devices. Working from the original design (Giles et al., 2000; Royer et al., 2002a; Royer et al., 2002b), we made modifications so that the sampling plan resides entirely in our digital Pest Sampler module, eliminating several steps currently involved in use of the Greenbug Calculator, including printing a paper form. The Pest Sampler for Glance n' Go uses an algorithm to tally the recorded number of infested tillers and aphid mummies and then reports the appropriate treatment decision on the basis of user-derived data. When sampling is complete, a report with the final treatment decision is generated and saved to the user's field history (available at http://myfields.info/pest_sampler) (Johnson & McCornack, 2014). Additionally, location data can be collected from a GPS-equipped mobile device to allow for real-time monitoring of pest populations at a county level. The myFields DSS can notify users about risks of pest outbreaks, but this feature is reliant on users' willingness to share sampling information. Therefore, it is essential that potential users see the value of such a system. The overarching goal is to help stakeholders make the best possible management decisions by using their data combined with information from scientific journals and other peer-reviewed publications.
Methodology
We designed an exercise that simulated field sampling for greenbug to provide crop school participants the opportunity to experience the differences between paper and digital versions of the Glance n' Go sampling forms. This approach allowed us to assess the influence of a new technology (a digital sampling form) on the decision-making behaviors of crop managers and their willingness to adopt new technologies. The exercise was conducted with 82 crop managers (Extension educators and crop consultants) during the 2012 Oklahoma State University Winter Crop School and was repeated with 34 students in an undergraduate pest management course in fall 2012 at Kansas State University. Crop school participants had varying degrees of professional training in and/or experience with sampling procedures, whereas students were less likely to have prior working knowledge of or experience with sampling.
For the exercise, two fields were simulated through the use of jar-sized containers (7×5 cm) filled with soybean seeds, with each seed representing an individual wheat tiller. To simulate a sampling event, individual seeds were spray-painted with one of three color combinations: a seed painted green represented a tiller infested with greenbug; a seed painted orange represented a tiller with at least one parasitized aphid (mummy); and a seed painted with both colors represented a tiller having the co-occurrence of greenbugs and mummies. An unpainted seed represented a noninfested tiller. Unknown to the participants, the Field 1 container represented a low density of greenbugs (10%) with no mummies. Conversely, the Field 2 container mimicked a more complex sampling scenario, having a higher pest density of greenbugs (50%), parasitoids (20%), co-occurrence of greenbugs and mummies, and noninfested tillers. The two "fields" demonstrated the varying levels of greenbugs and natural enemies that exist under natural field conditions.
Prior to the sampling exercise, both groups (crop school participants and students) were given a brief introduction to the myFields DSS, but no preview of the Pest Sampler module. Participants were organized in pairs, with at least one person in each pair having a mobile device that could access the Pest Sampler module at myFields.info.
Participants were then guided through the sampling exercise. First, each pair was asked to complete the paper form of Glance n' Go for each field, using only the instructions provided on the form. In each pair, person A randomly grabbed seeds from a container and reported the presence/absence of greenbugs and mummies, and person B tallied observations and recorded the amount of time it took to reach a decision for each field. Next, participants were asked to repeat the process, using the digital version of Glance n' Go via myFields.info. Each pair recorded on an activity handout the time it took to make a treatment decision.
Study participants in the crop school group also were asked to answer several matched questions on the activity handout before and after the activity. The handout contained the following preactivity questions:
- Do you own a mobile device with a data plan (yes/no)?
- Do you currently use sampling forms to make pest management decisions (rate on 5-point Likert scale)?
- Do you currently share your wheat management–related data through a website to help other farmers predict oncoming pest infestations (rate on 5-point Likert scale)?
The postactivity questions were as follows:
- Which form was easier to use (paper/digital)?
- Will you incorporate sampling forms into future pest management decisions (rate on 5-point Likert scale)?
- Are you willing to share wheat management data to help other farmers predict oncoming pest infestations (rate on 5-point Likert scale)?
The activity handout and the questions used on the handout were created by the activity leaders and were preapproved for use by the Kansas State University Research Compliance Office.
Crop school participants were asked to return the activity handouts at the end of the training event. To assess participants' overall learning experiences, we used their responses to the handout questions, along with the times to reach a treatment decision recorded on both sampling forms. We also checked the accuracy of treatment decisions participants had made using the paper sampling form on the basis of their hand-recorded observations.
The students were not asked to complete the handout questions, but they were asked to predict a treatment decision prior to sampling for each field by using visual observation to determine levels of greenbugs and mummies. The students were asked to do this because crop managers who choose not to use sampling plans for treatment decisions typically use an informal visual assessment of fields. We compared treatment decisions students made by using the sampling plan with their predictions to determine whether use of the sampling plan over visual prediction alone improved the accuracy of the treatment decision.
Results
From the crop school group, 62 activity handouts were returned. Regarding preactivity question 1 and postactivity question 1, we found that 72% of participants (n = 62) had mobile devices with data plans and that 75% of participants found the digital sampling form easier to use than the paper form. Only 20 handouts contained a complete set of answers to the preactivity and postactivity questions. From these 20 handouts, we found that producers' willingness to use sampling plans for pest management decisions favorably increased after the exercise. Positive responses included changes from disagree to neutral (4) or agree (2) and from neutral to agree (5) or strongly agree (3); the remaining responses were unchanged from agree (3) and strongly agree (3). Furthermore, we found that willingness to share sampling data positively increased after the exercise. Positive responses included changes from disagree to neutral (2) or agree (4) or strongly agree (2) and from neutral to agree (7) or strongly agree (1); the remaining responses were unchanged from agree (2) and strongly agree (2).
For crop school participants who returned complete sampling data (n = 51), the number of incorrect treatment decisions recorded on the paper forms was 21% higher for the high-density infestation of greenbug (Field 2) than for the low-density infestation (Field 1). Incorrect treatment decisions were the result of computational errors participants made while tallying the number of greenbug-infested tillers. For Field 2, which required more complex computations to account for the presence of both greenbugs and mummies, three participant pairs came to a "treat" decision when the correct decision was "don't treat." In addition, a common mistake participants made for both fields when using the paper form (Field 1, 7 groups; Field 2, 10 groups) was deciding to "keep sampling" when the correct decision was "don't treat." Use of the digital version remedied both types of computational errors by automating the computations and prompting the user for more input when a "keep sampling" decision was made.
With the student group, we asked for treatment predictions for both fields and compared those predictions with the final decisions indicated on the paper forms. For low-density Field 1, students correctly predicted the treatment decision 88% of the time, whereas for Field 2, they made correct predictions only 62% of the time. Furthermore, when using the paper form, students arrived at the correct treatment decision 94% of the time for Field 1 but made the correct treatment decision only 79% of the time for Field 2. As with the crop school group, use of the paper form resulted in more computational errors that led to incorrect decisions.
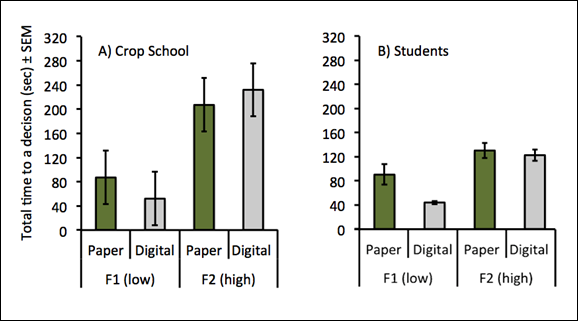
The time to reach a treatment decision for Field 1 was slightly reduced through use of the digital form. The crop school participants (n = 9) averaged a time of 83 sec when using the paper form compared to 52 sec when using the digital form (Figure 1, part A). We found a similar trend for Field 1 among the student group (n = 34); average time to decision was reduced by half when students used the digital sampling form compared to when they used the paper form (Figure 1, part B). For Field 2, crop school participants (n = 16) averaged a time to decision of 207 sec when using the paper form compared to 232 sec when using the digital form. We found an opposite result with the student group (n = 34); students' average time to decision was slightly reduced from 130 sec when they used the paper form to 122 sec when they used the digital form (Figure 1, part B).
Figure 1.
Time to a Treatment Decision Using Sampling Forms for Greenbug
in Fields Having Low and High Densities (F1 and F2)
Conclusions
In our study, we evaluated the acceptance and perceived effectiveness of a web-based DSS among a group of potential early adopters—crop school participants, most of whom owned a mobile device with a data plan. We found that once they had experience with inputting their information and retrieving treatment recommendations on their devices, the crop school participants generally increased their willingness to use sampling forms and to share wheat pest data. Following the exercise, we displayed a map of the simulated data entered in the Pest Sampler module, allowing participants to see where treatable levels of greenbugs occurred and enhancing the perceived value in sharing, or crowdsourcing, sampling data.
Use of the digital form reduced the risk of computational error and the chance of an incorrect treatment decision. For the field having high pest density, three crop school group pairs made the incorrect decision to treat when using the paper form. Participants were able to see value in the digital Pest Sampler module by using their own experience and data, thereby reducing the potential for unwarranted insecticide applications. As demonstrated by the student group, whose members tended not to predict a correct treatment decision for the high-density field through observation alone, treatment decisions based on the use of a sampling plan were more accurate than those based on quick observations or best guesses.
Use of the digital sampling form also reduced the time to a treatment decision for the field having a low-density infestation of greenbug. Because low-density populations are common in actual wheat fields, we feel that the Pest Sampler module is a valuable time saver for crop managers. Additionally, our time-saving estimate is conservative and does not account for the steps required to retrieve and print the appropriate online forms. Even small amounts of time saved are important for crop managers making decisions for multiple, large-production wheat fields. It is not completely clear why the crop school participants took more time to reach a treatment decision for Field 2 when using the digital version of the form, but this circumstance most likely is explained by a design flaw in the user interface (i.e., small, clustered check boxes), which we immediately corrected on the basis of participant feedback.
In summary, a crop production DSS has the potential to effectively deliver science-based information to crop managers and to help them leverage data shared by others before making management decisions. We saw a favorable shift in perception brought on by a positive experience in which users were able to compare a complicated paper-based sampling form with a form that was simplified through the use of the myFields DSS. When participants saw the advantages associated with the newer technology firsthand, they were more willing to adopt it. Therefore, we suggest that incorporating active demonstrations that showcase technology advancements into Extension programming will have a positive impact on the acceptance of materials among users, especially those demanding quick answers on their mobile devices. To stay relevant and competitive among providers of online agricultural information, Extension should consider the implementation of DSSs as a means of enhancing communication between Extension personnel and crop managers and communicating information to other relevant clientele.
Acknowledgments
We would like to thank Tom Royer and Jeff Edwards for the opportunity to present this activity as part of their crop school program in 2012. We also thank Sarah Zukoff for her time in review of this manuscript. This project was funded by the U.S. Department of Agriculture Risk Avoidance and Mitigation Program. Research station contribution #14-316-J.
References
Bright, T. J., Wong, A., Dhurjati, R., Bristow, E., Bastian, L., & Coeytaux, R. R. (2012). Effect of clinical decision support systems: A systematic review. Annals of Internal Medicine, 157, 29–43.
Brown, N. R., & Kelsey, K. D. (2013). Introducing prospect evaluation through exploring Great Plains wheat producers' behaviors and attitudes regarding web 2.0 technology. Proceedings of the 2013 Western AAAE Research Conference, 32, 264–277.
Diem, K. G., Hino, J., Martin, D., & Meisenbach, T. (2011). Is Extension ready to adopt technology for delivering programs and reaching new audiences? Journal of Extension [online], 49(6) Article 6FEA1. Available at: http://www.joe.org/joe/2011december/a1.php
Elliott, N. C., Royer, T. A., Giles, K. L., Kindler, S. D., Porter, D. R., Elliott, D. T., & Waits, D. A. (2004). A web-based decision support system for managing greenbugs in wheat. Crop Management, 3(1). doi:10.1094/CM-2004-1006-01-MG
Giles, K. L., Royer, T. A., Elliott, N. C., & Kindler, S. D. (2000). Binomial sequential sampling of the greenbug in Oklahoma winter wheat. Journal of Economic Entomology, 93, 1522–1530.
Giles, K. L., & Walker, N. W. (2009). Dissemination and impact of IPM programs in US agriculture. In R. Peshin & A. Dhawan (Eds.), Integrated pest management: Innovation-development process, Vol. 2., pp. 481–506. United Kingdom: Springer.
Johnson, W. A., & McCornack, B. P. (2014). myFields.info Greenbug Pest Sampler. Retrieved from http://youtu.be/sJBqYQBKY34
Khan, S., Maclean, C. D., & Littenberg, B. (2010). The effect of the Vermont Diabetes Information System on inpatient and emergency room use: Results from a randomized trial. Health Outcomes Research in Medicine Impact, 1, 61–66.
Murphy, E. V. (2014). Clinical decision support: Effectiveness in improving quality processes and clinical outcomes and factors that may influence success. The Yale Journal of Biology and Medicine, 87, 187–197.
Oehler, R. L., Smith, K., & Toney, J. F. (2010). Infectious diseases resources for the iPhone. Clinical Infectious Disease, 50, 1268–1274.
Pew Research Center. (2015). The smartphone difference. Retrieved from http://www.pewinternet.org/files/2015/03/PI_Smartphones_0401151.pdf
Power, D. J. (2008). Decision support systems: A historical overview. In F. Burstein & C. W. Holsapple (Eds.), Handbook on decision support systems 1. International handbooks information system. Berlin, Heidelberg, Germany: Springer.
Rogers, E. M. (1995). Diffusion of innovations. New York, NY: Free Press.
Royer, T. A., Giles, K. L., & Elliott, N. C. (2002a). Glance 'n Go sampling for greenbugs in winter wheat: Spring edition. Oklahoma Cooperative Extension Service, Oklahoma State University, Stillwater, OK. Extension Facts L-306.
Royer, T. A., Giles, K. L., & Elliott, N. C. (2002b). Glance 'n Go sampling for greenbugs in winter wheat: Fall edition. Oklahoma Cooperative Extension Service, Oklahoma State University, Stillwater, OK. Extension Facts L-307.
Sadasivam, R. S., Gathibandhe, V., Tanik, M. M., Willig, J. H. (2012). Development of a point-of-care HIV/aids medication dosing support system using the Android mobile platform. Journal of Medical Systems, 36, 1583–1591.
Serenari, C., Peterson, M. N., Bardon, R. E., & Brown, R. D. (2013). The impacts of the great recession on state natural resource Extension programs. Journal of Extension [online], 51(4) Article 4FEA11. Available at: http://www.joe.org/joe/2013august/a11.php
Yasnoff, W. A., & Miller, M. D. (2014). Decision support and expert systems in public health. In J. A. Magnuson & P. C. Fu, Jr., (Eds.), Public health informatics and information systems, health informatics. London, England: Springer-Verlag.