April 2016
|
April 2016 // Volume 54 // Number 2 // Research In Brief // v54-2rb5


Keeping It Safe: Aging in Place Among Rural Older Adults
Abstract
The purpose of the study addressed in this article was to identify ways to reduce risk and improve safe aging in place among rural older adults. Resident and Extension faculty and county educators visited study participants at home to assess functional capacity and the home environment. Extension professionals may be uniquely positioned to provide programming to help older adults age in place. Aging in place programming may help improve quality of life for older adults and their family members and caregivers.
Introduction
Adults aged 65 and older represent the fastest growing age demographic in the United States (West, Cole, Goodkind, & He, 2014). The number of older adults is expected to double to nearly 80 million by 2040 (West et al., 2014). Older adults may require specialized goods and services. Older adults residing in metropolitan areas may have greater access to needed goods and services. However, many older adults reside outside metropolitan or micropolitan areas (West et al., 2014). Older adults in rural areas may be faced with unique challenges.
Most older adults prefer to age in place (Keenan, 2010). The term age in place refers to "the ability to live in one's own home and community safely, independently, and comfortably, regardless of age, income, or ability level" (Centers for Disease Control and Prevention [CDC], 2013, "aging in place"). Successful aging in place can be less costly than formal care. The annual cost of assisted living and long-term care generally ranges from $39,516 to $83,585 (West et al., 2014). With a median income of $21,225 (Administration on Aging, 2014), fewer than 20% of older persons have enough financial resources to live 3 or more years in a formal care setting. Many more cannot afford even 1 year (West et al., 2014).
The aging process presents functional challenges that may affect the ability to remain at home as desired. Extension professionals have provided programming to help clients reduce risks in their home environments (Booth & Peek, 2013). Aging in place issues may provide opportunities for Extension family and consumer sciences programming. For example, Pollak and DiGregorio (1988) discussed aging in place opportunities illustrated by a Cornell Extension education program. Extension programming related to aging in place continues to evolve.
Extension professionals are not qualified to diagnose medical or related problems. Instead, they can have a basic understanding of factors that can help reduce risk and increase resilience. Extension can provide programming to help reduce risks associated with aging in place.
Aging in Place and Healthful Homes
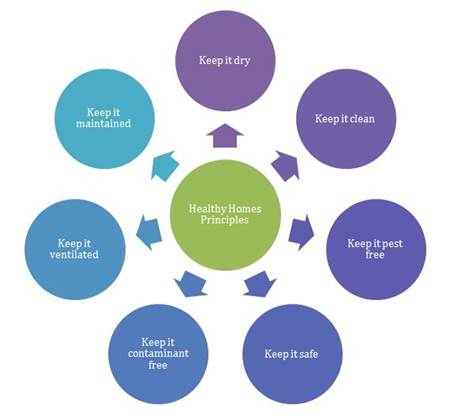
Aging in place can provide numerous benefits to older adults and their families. Aging in place can help older adults maintain autonomy, reduce cost of living, and improve feelings of social connectedness (Cook, Martin, Yearns, & Damhorst, 2007). The seven principles of healthful housing (U.S. Department of Housing and Urban Development, n.d.) can serve as a template for structuring risk reduction education and help guide aging in place (see Figure 1). For example, consider the principle "keep it safe." Interventions such as removing throw rugs or installing stairway handrails can reduce the risk of falls. Among older adults (those 65 or older), falls are the leading cause of fatal and nonfatal injuries (CDC, 2012). Hospital care resulting from a fall can be costly, averaging $17,086 (CDC, 2009).
Figure 1.
Seven Principles of Healthful Housing
Project Objectives and Goals
The research pilot study described in this article sought to answer the following question: How do rural older adults sustain a safe and secure living environment? The primary aim was to understand simple ways to improve healthful aging in place. The long-term goal was to assist in creating safe living environments. To achieve these goals, functional capacity/hazard indicators and resources necessary for home safety/security were assessed.
Methods and Results
One Human Development Family Science (HDFS) resident faculty and one Cooperative Extension faculty, housing and consumer specialist, secured seed funding to conduct the study. The study was limited to residents of one district, as defined by the Oklahoma Cooperative Extension Service. The research team used the Cooperative Extension infrastructure to recruit participants. The district program specialist recruited county educators. The county educators then recruited study participants and assisted with data collection. Student workers trained to collect data also participated. Institution Review Board protocol was secured prior to conducting the research to ensure the protection of human subjects.
Study Participants
The study used a 2 x 2 design (age and gender). Participants were limited to adults 65 or older; average age was nearly 74. Table 1 summarizes the sampling frame.
| Age | Women | Men |
| Old (65–74 years) | n = 12 | n = 8 |
| Old-old (75+ years) | n = 8 | n = 5 |
Table 2 provides information about the number of participant counties, the number of homes visited in each county, and the number of participants. Participants were distributed across 23 homes and six counties.
| County |
Number of homes visited |
Number of participants |
| County A | 3 | 5 |
| County B | 3 | 4 |
| County C | 6 | 10 |
| County D | 6 | 8 |
| County E | 1 | 1 |
| County F | 4 | 5 |
Part 1: One-to-One Semistructured Interview
HDFS faculty administered a one-to-one semistructured interview. All measurements used standardized Likert scales.
Living Demographics
Most participants were married and did not live alone. Most had 12 years or less of education. Very few had fallen in the preceding 12 months, and most viewed their health favorably. Table 3 provides basic data about living demographics.
| Variable | Category | Frequency | % |
| Marital status | Never married | 1 | 3.0 |
| Married | 19 | 57.6 | |
| Divorced | 6 | 18.2 | |
| Widowed | 7 | 21.2 | |
| Education | High school or less | 13 | 39.4 |
| Some college | 11 | 33.3 | |
| College | 3 | 9.1 | |
| Some graduate | 2 | 6.1 | |
| Graduate degree | 4 | 12.1 | |
| Living alone | Yes | 8 | 24.2 |
| No | 25 | 75.0 | |
| Own computer/laptop | Yes | 26 | 78.8 |
| No | 7 | 21.2 | |
| Perceived health status | Poor | 1 | 3.0 |
| Fair | 7 | 21.2 | |
| Good | 20 | 60.6 | |
| Excellent | 5 | 15.2 | |
| Fallen in home (last 12 months) | Yes | 4 | 12.1 |
| No | 29 | 87.9 |
Housing Well-Being, Health Functioning, Technology Use, and Psychosocial Well-Being
Relying only on the mean for descriptive analysis can result in misleading conclusions. The mean can be distorted by a number of factors—including extreme values, skewed distributions, and repetition across different distributions—that often arise from studies using a small number of study participants (de Vaus, 2002). Thus, it is recommended practice to use an alternative measure of central tendency, such as the median (i.e., midpoint), as a comparative technique to more accurately interpret descriptive study variables (de Vaus, 2002). Descriptive data may be interpreted as follows:
- mean lower than midpoint—less endorsement of the variable across participants;
- mean higher than midpoint—greater endorsement of the variable across participants.
For example, consider the variable home satisfaction (Table 4). The mean is lower than the midpoint. This finding indicates that the study participants in this sample, on average, were not completely satisfied with their homes.
Housing Well-BeingDespite making improvements each year, the participants had multiple home repair needs. Most participants experienced weather-related hazards that could damage the home. Use of medical devices (e.g., digital thermometers, blood pressure monitors) within the home was low. Table 4 provides descriptive results of key study variables related to housing well-being.
| Variable | Range | Midpoint | Mean | SD | Variable endorsement direction |
| Home improvement | 0–31 | 3.50 | 4.60 | 3.96 | Greater (+) |
| Health devices | 15–75 | 23.00 | 22.76 | 4.90 | Less (−) |
| Weather hazards | 0–14 | 4.00 | 4.51 | 2.07 | Greater (+) |
| Home satisfaction | 12–60 | 51.00 | 49.25 | 7.94 | Less (−) |
Medication use was evaluated on the basis of the number of prescription medications taken.
Fall risk was evaluated by using the Falls Efficacy Scale (Tinetti, Richman, & Powell, 1990). The assessment included perceived risk of falling while completing household tasks (e.g., preparing meals, taking a bath, getting in and out of a chair). The Older Adult Resources and Services Procedures (Fillenbaum, 1988) survey was used to evaluate activities of daily living (ADL) functioning. For example, participants rated the extent to which they could cook, use the phone, and get from place to place.
Participants tended to use multiple medications and had co-occurring health problems. They also felt at risk of falling. Study participants reported having difficulty completing tasks of daily living. See Table 5.
| Variable | Range | Midpoint | Mean | SD | Variable endorsement direction |
| Medication use | 0–8 | 5.00 | 5.28 | 2.46 | Greater (+) |
| Falls risk | 9–90 | 83.00 | 67.45 | 31.74 | Less (-) |
| Health conditions | 0–45 | 3.00 | 3.35 | 2.02 | Greater (+) |
| ADL functioning | 13–39 | 37.50 | 32.31 | 9.7 | Less (-) |
Technology skills were assessed using two scales: (a) Perceived Efficacy in Everyday Technology Use Scale (Rosenberg, Kottorp, Winblad, & Nygård, 2009; Rosenberg, Nygård, & Kottorp, 2009) and (b) a 30-item checklist created by the researchers. Participants did not necessarily use technological services or devices (e.g., wireless Internet, smartphone, bank ATM). Participants believed that they could use the technology if they owned it or needed it. See Table 6.
| Variable | Range | Midpoint | Mean | SD | Variable endorsement direction |
| Device use | 0–30 | 14.00 | 13.24 | 4.63 | Less (−) |
| Efficacy | 10–50 | 26.00 | 27.59 | 7.38 | Greater (+) |
Four primary measures were used to assess psychosocial well-being:
- Scales of Psychological Well-Being measured environmental mastery (Ryff & Keyes, 1995).
- The Older American Resources and Service Scale measured perceived economic security (Fillenbaum, 1988).
- Pearlin's Mastery Scale measured locus of control (Pearlin, Lieberman, Menaghan, & Mullan, 1981).
- Satisfaction of Life Scale measured life satisfaction (Diener, Emmons, Larsen, & Griffin, 1985).
Economic situations and limited control over life circumstances made participants feel vulnerable. Participants experienced some difficulties in developing living arrangements or lifestyles to fit their needs. These attributes, as seen in Table 7, can impair resilience.
| Variable | Range | Midpoint | Mean | SD | Variable endorsement direction |
| Economic security | 3–12 | 11.00 | 10.34 | 1.96 | Less (−) |
| Locus of control | 7–35 | 27.00 | 26.09 | 4.16 | Less (−) |
| Environmental mastery | 7–49 | 41.00 | 40.09 | 7.43 | Less (−) |
| Life satisfaction | 5–35 | 30.00 | 29.40 | 5.39 | Less (−) |
Part 2: Home Assessment
The Extension faculty member conducted an objective assessment, using the Cougar Home Safety Assessment (Fisher & Ewonishon, 2006). The Cougar Home Safety Assessment involves 78 criteria that can be assessed by making observations, testing certain home environments, and questioning the resident. The following categories were assessed:
- fire hazards/carbon monoxide,
- emergency medical,
- electrical/water temperature,
- flooring/hallways,
- kitchen,
- bedroom,
- bathroom(s),
- closets/storage areas,
- parking areas,
- entrances, and
- disaster preparedness.
Participants were sent reports based on the assessments. Themes (discussed below) included (a) fire protection/safety hazards, (b) problems pertaining to obstructions in the home that compromised mobility leading to falls risk, and (c) the absence of disaster preparedness kits.
Electrical/Fire Hazards/Carbon Monoxide Poisoning
Each home had at least one issue related to electrical, fire, or carbon monoxide poisoning. Issues included but were not limited to
- lack of fire extinguishers or expired fire extinguishers,
- lack of smoke detectors or nonfunctional smoke alarms,
- lack of carbon monoxide alarms or nonfunctional carbon monoxide alarms in homes with combustion appliances,
- flammables located within 3 ft of fire/heat sources,
- lack of ground fault circuit interrupters on electrical outlets located near water sources,
- overloaded outlets and power strips,
- exposed wiring, and
- excessive grease/clutter on cooktops.
Falls
Each home had at least one issue that increased the risk of falls. Issues included but were not limited to
- lack of clear space to maneuver within and between rooms;
- clutter in home (furniture and accessories);
- carpeting that was not secure and/or level;
- throw rugs without slip resistant backing;
- lack of grab bars in key locations;
- damaged flooring inside the home, damaged sidewalks and parking areas outside the home;
- stairways without a secure railing at least on one side (both inside and outside the home);
- inadequate/insufficient/ineffective lighting (both inside and outside the home); and
- items located in walking paths (both inside and outside the home).
Disaster Preparedness
Each home lacked a 3-day disaster kit, a safety article recommended by the Federal Emergency Management Agency (FEMA). The state ranks very high in FEMA-declared disasters (U.S. Federal Emergency Management Agency, n.d.). It was suggested that participants consider creating 3-day disaster kits.
Limitations
This study involved a small number of rural older adults residing in the northwest district of a south central state. Caution should be used; the results may not be generalizable to other populations. The small size limits statistical power; associations of causation cannot be made.
Conclusions and Implications for Extension
The study helped the researchers better understand risks and strengths for aging in place for rural older adults. With aging in place education and resources, older adults may be able to adapt in ways that allow them to be self-reliant and resilient while remaining at home. As stated, Extension professionals are not qualified to diagnose medical or related problems. Instead, professionals can have a basic understanding of concepts that can help reduce risks and increase resiliency.
Extension professionals who are interested in programming designed to promote successful aging in place may start with a simple home safety assessment, such as the Cougar Home Safety Assessment. This assessment will help identify areas that promote successful aging in place as well as areas of concern. Extension professionals may consider programming based on the three areas of concern identified here: (a) electrical/fire hazards/carbon monoxide poisoning, (b) falls, and (c) disaster preparedness.
References
Administration on Aging. (2014). A profile of older Americans: 2014. Washington, DC: Author.
Booth, L., & Peek, G. (2013). The Healthy Homes Partnership: A Cooperative Extension model. Journal of Extension [online], 51(1) Article 1FEA5. Available at: http://www.joe.org/joe/2013february/a5.php
Centers for Disease Control and Prevention. (2009). Facts: Preventing falls among older adults. Retrieved from http://www.cdc.gov/injury/pdfs/Falls2009CDCFactSheet-FINAL-a.pdf
Centers for Disease Control and Prevention. (2012). Falls among older adults: An overview. Retrieved from http://www.cdc.gov/homeandrecreationalsafety/falls/adultfalls.html
Centers for Disease Control and Prevention. (2013). Healthy places terminology. Retrieved from http://www.cdc.gov/healthyplaces/terminology.htm
Cook, C. C., Martin, P., Yearns, M., & Damhorst, M. L. (2007). Attachment to "place" and coping with losses in changed communities: A paradox for aging adults. Family and Consumer Sciences Research Journal, 35(3), 201–214.
de Vaus, D. (2002). Analyzing social science data: 50 key problems in data analysis. Thousand Oaks, CA: Sage Publishing.
Diener, E., Emmons, R. A., Larsen, R. J., & Griffin, S. (1985). The Satisfaction with Life Scale. Journal of Personality Assessment, 49(1), 71–75.
Fillenbaum, G. G. (1988). Multidimensional functional assessment of older adults: The Duke Older Americans Resources and Service Procedures. Hillsdale, NJ: Lawrence Erlbaum Associates, Inc.
Fisher, G., & Ewonishon, K. (2006). Cougar Home Safety Assessment 4.0. Dallas, PA: College Misercordia.
Keenan, T. A. (2010). Home and community preferences of the 45+ population. Washington, DC: AARP. Retrieved from http://assets.aarp.org/rgcenter/general/home-community-services-10.pdf
Pearlin, L. I., Lieberman, M. A., Menaghan, E. G., & Mullan, J. T. (1981). The stress process. Journal of Health and Social Behavior, 22, 337–356.
Pollak, P., & DiGregorio, D. A. (1988). Aging-in-Place. Journal of Extension [online], 26(4) Article 4FEA2. Available at: http://www.joe.org/joe/1988winter/a2.php
Rosenberg, L., Kottorp, A., Winblad, B., & Nygård, L. (2009). Perceived difficulty in everyday technology use among older adults with or without cognitive deficits. Scandinavian Journal of Occupational Therapy, 16, 216–226.
Rosenberg, L., Nygård, L., & Kottorp, A. (2009). Everyday technology use questionnaire: Psychometric evaluation of a new assessment of competence in technology use. OTJR: Occupation, Participation, & Health, 2, 52–62.
Ryff, C. D., & Keyes, C. L. M. (1995). The structure of psychological well-being revisited. Journal of Personality and Social Psychology, 4, 719–727.
Tinetti, M. E., Richman, D., & Powell, L. (1990). Falls efficacy as a measure of fear of falling. Journals of Gerontology: Psychological Sciences, 45, P239–P243.
U.S. Department of Housing and Urban Development. (n.d.). Healthy homes. Retrieved from http://www.hud.gov/offices/lead/library/hhi/HealthyHomes7Steps.pdf
U.S. Federal Emergency Management Agency. (n.d.). Disaster declarations by state/tribal government. Retrieved from http://www.fema.gov/disasters/grid/state-tribal-government
West, L. A., Cole, S., Goodkind, D., & He, W. (2014). 65+ in the United States: 2010. Washington, DC: U.S. Census.