April 2016
|
April 2016 // Volume 54 // Number 2 // Feature // v54-2a1


Capacity Building and Community Resilience: A Pilot Analysis of Education and Employment Indicators Before and After an Extension Intervention
Abstract
This article reports on an analysis of the effects of a quasinatural experiment in which 16 rural communities participated in public discussion, leadership training, and community visioning as part of an Extension program at Montana State University. Difference-in-differences methods reveal that key U.S. Census socioeconomic indicators either improved more rapidly or declined more slowly in communities that took part in the program, relative to a statistically matched control group. These findings offer persuasive circumstantial evidence for the ability of Extension programs to build community resilience. The findings and methodology, therefore, have important implications for Extension's role in current public and academic resilience planning discourses.
Introduction
Community development is both a process and an outcome (Phillips & Pittman, 2009). As a process, it is a "participatory effort to mobilize community assets that increases the capacity of residents to improve their quality of life" (Green & Haines, 2016, p. 13). As an outcome, community development is a realization of this participatory effort. That is, community-development-as-outcome is embodied in the enhanced will or ability of residents to undertake collective action and/or in locally desired improvements to community quality of life (e.g., Dorius, 2011). Planning scholars and practitioners increasingly are using the term resilience to refer to this ability of residents to act collectively, or self-organize, in response to change (e.g., Eraydin, 2013). In this view, a resilient community is one whose members cooperate in the face of and productively adapt to stress in the community (e.g., Adger & Brown, 2009).
Extension programs and allied institutions have long recognized the role of resilience in facilitating positive community development outcomes—though the concept is typically spoken of as "capacity," and the pursuit of it as "capacity building" (e.g., Allen & Morton, 2006; Robinson & Meikle-Yaw, 2007; Romanini, 2014; Sandmann & Kroshus, 1991). This article accordingly claims that Extension has much to contribute to the growing "resilience thinking" movement that is under way in the academic and professional planning discourses (see: Eraydin, 2013; Eraydin & Tasan-Kok, 2013). As it stands, however, at least two interrelated issues might limit Extension's penetration into these discourses. First, the outcomes of capacity building and community development activities are often intangible and therefore difficult to measure (e.g., Blanke & Walzer, 2013; Lachapelle, Emery, & Hays, 2010). Second, public policy makers and other potential end users of Extension's community capacity-building knowledge tend to exhibit quantitative biases (Leurs, 1996)—meaning that they are reluctant to adopt new interventions without documented, quantitative evidence of their efficacy.
With these points in mind, this article attempts to make three contributions to the literature. First, it briefly summarizes a recently completed Extension community development program that seems particularly relevant to the goal of building the resilience or capacity of a community. Second, it explains how the selected intervention was treated as a quasinatural experiment for quantitative analyses, allowing for empirical assessments of its likely effectiveness. Finally, as a by-product of the empirical investigation, the methodological approach described in the article offers a broad strategy for Extension professionals to use to study the potential resilience-enhancing effects of their programs.
Case Study: Rural Montana
From 2006 through 2008, 16 rural communities in Montana took part in a multiphase poverty reduction program that was administered through Montana State University (MSU) Extension (Lachapelle, Emery et al., 2010). The communities selected for the intervention were those that recently experienced "decline or demographic change" (Lachapelle & Clark, 2011, p. 1). All participant communities received the same resources and tools, and the program was carried out in three phases (Lachapelle & Clark, 2011; Lachapelle, Emery et al., 2010). In the first phase, citizens came together to "discuss and define poverty and assets within their community" (Lachapelle, Austin, & Clark, 2010, p. 2). The second phase consisted of leadership training, whereby community members were provided with information, skills, and encouragement to either establish new roles or take on active roles in existing community organizations (Mastel, 2011). The culminating third phase engaged citizens in community visioning (Lachapelle & Clark, 2011).
Community visioning is a participatory planning process in which a representative assemblage of a place's citizens work together to articulate a consensual vision for the place's future and to coauthor a strategic framework for achieving that vision (Green & Haines, 2016). By empowering citizens—preferably as large and diverse a group as possible—to negotiate and set the terms of a collective future in this manner, community visioning is an effective means for revealing otherwise latent values, assets, and synergies that are embedded in a given sociospatial landscape (Moss & Grunkemeyer, 2010). Consequently, community visioning tends to produce more than just planning goals, priorities, and action steps. It also facilitates interactions that build intracommunity trust and social capital (Flora, Flora, & Gasteyer, 2015), and it motivates residents to become more proactive in anticipating and engaging with changes that are coming to their communities (Elkins, Bivins, & Holbrook, 2009, p. 76).
Against that backdrop, the three phases/components of public discussion, leadership training, and community visioning combine in ways that feasibly enhance a community's resilience. For instance, public discussion encourages discovery of shared values, building cultural capital (Flora et al., 2015); leadership training is a direct investment in a place's human capital (Green & Haines, 2016); and, as suggested above, community visioning tends to build social capital (Lachapelle, Emery et al., 2010). Moreover, all these intangible forms of capital, along with more tangible forms (e.g., built, financial, natural), exhibit complementary relationships, such that efficacious investments in some create a "spiraling up" phenomenon that positively affects the others (e.g., Emery & Flora, 2006). The result of such an upward spiral is increased community capacity to cope with change (i.e., resilience).
Interested readers can obtain more detailed information on the MSU Extension program (Lachapelle, Austin et al., 2010; Morehouse, 2010; Nelson-Dusek, 2013) and various types of community capital (Flora et al., 2015; Green & Haines, 2016) elsewhere. For the purposes of this article, the foregoing summary implies that the program was, in effect, a capacity-building treatment that was applied to 16 communities within a quasinatural experiment.
Hypotheses, Data, and Method
Recall that a resilient community is one whose residents possess sufficient capacity to act collectively in response to change. Put differently, resilient communities are better at muting the effects of negative changes and amplifying the effects of positive changes than less resilient communities (e.g., Adger & Brown, 2009). A practical implication of these statements is that resilient communities should be more effective at protecting and/or augmenting their various forms of community capital compared to their less resilient counterparts (e.g., Flora et al., 2015). Thus, the governing hypothesis of the research reported here was that communities included in the MSU Extension program should exhibit greater gains, or fewer losses, in their community capital stocks relative to nonparticipants.
To set up tests of this "resilience hypothesis," publicly available U.S. Census data were collected for all zip codes in Montana. Data collection began in Esri Business Analyst 2014, where each U.S. zip code is associated with a single geographic community (Esri, n.d.). Relying on zip code–based proxies for spatial communities is necessary insofar as there is "no . . . centralized source of data on [municipal] boundaries" in the United States (Kodrzycki & Muñoz, 2015, p. 114). It was therefore not possible to aggregate smaller units of geography (e.g., census block groups) up to the municipal level as the latter boundaries were not available to facilitate such a procedure. Although the use of zip codes is a clear limitation to the study, the lack of better suited alternatives makes the adopted spatial unit—and its relation to the desired spatial unit in the Esri data set—a useful proxy for a pilot study.
Next, selected demographic and socioeconomic variables were acquired for all Montana zip codes through Social Explorer—a repository for current and historical U.S. Census data (Social Explorer, n.d.-a). In addition to insufficient data on community boundaries, a second limitation of census data is that they are not available for all time periods that a researcher might wish to study. In this case, the MSU Extension program occurred from 2006 through 2008. Hence, it was necessary to calibrate the study with outcome variables that can be measured before 2006 and after 2008 to assess the potential effects of the intervention. The most reliable census products for acquiring zip code–level socioeconomic data for these before-and-after periods were the 2000 decennial census long-form survey and the 2009–2013 American Community Survey (ACS) period estimates. These products contain data on roughly the same set of variables, given that the latter replaced the former (U.S. Census Bureau, n.d.). Nevertheless, their temporal coverage is less than ideal: the "before" data were collected 6 years prior to the start of the Extension program, and the "after" data were collected over a 5-year period from 1 to 5 years after the end of the program. As with all pilot studies, however, one must start somewhere—and official census data offer an accessible starting point.
Data
Data collection for this study had to attend to two separate objectives. First, a set of variables was established for matching purposes. That is, to assess whether the MSU Extension program (the treatment) might have built community resilience, it was necessary to compare indicators in the 16 participant communities (also referred to herein as treatment communities or the treatment group) to the same indicators in a control group. Because manually selecting a control group would introduce bias into the analysis and because participant communities were chosen nonrandomly (Lachapelle & Clark, 2011), it was necessary to implement a statistical matching procedure. Recall that the communities selected to participate in the intervention (a) were rural and (b) had experienced recent decline or demographic change (Lachapelle & Clark, 2011, p. 1). Consequently, for the purpose of creating a control group, criteria for three sociodemographic variables—total population, percentage of the population with income below the federal poverty level (poverty rate), and percentage of the population that is non-White (minority population)—were established:
- Control communities should have similarly sized (rural) populations as participant communities (total population).
- Control communities should exhibit similar levels of economic disadvantage as participant communities (poverty rate).
- Control communities should have similar racial and ethnic compositions as participant communities (minority population).
These three variables were analyzed with the methods and MatchIt software procedures developed by Ho, Imai, King, and Stuart (2007, 2011) to create an analytical sample. More explicitly, all zip codes in the statewide data set were coded to reflect their involvement in the 2006–2008 MSU Extension program. Participants were coded with 1, and nonparticipants were coded with 0 (participants from an earlier phase of the program [2003–2005] were excluded; see Nelson-Dusek, 2013). This dichotomous variable was then used as the response in a logistic regression, wherein the predictors were the "before" measures of the variables enumerated above, plus categorical variables that classified each community into the northeast, southeast, southwest, or northwest quadrant of Montana, using the state's geographic center as an origin. The fitted values of this regression, called propensity scores, were then used to match the participant communities to a control group of nonparticipant communities whose fitted scores were sufficiently similar to those of the participant communities (Ho et al., 2011).
The second data collection objective was to obtain measures for outcome variables that might contain evidence of increased community resilience. The following three indicators were selected toward this end:
- percentage of the population aged 16 to 19 years not enrolled in school and not in possession of a high school diploma or general equivalency diploma (GED) (school dropout rate; see Social Explorer, n.d.-b);
- percentage of the population 25 years or older without a high school diploma or GED (absence of high school equivalency degree rate); and
- percentage of the civilian labor force not currently employed (unemployment rate).
Generally speaking, positive school dropout rates reflect disinvestment in human capital (Flora et al., 2015). Thus, in the context of the aforementioned hypothesis, more resilient communities should experience smaller increases or larger decreases in school dropout rates than less resilient communities. By the same reasoning, but in the opposite direction, resilient communities should experience larger increases or smaller decreases in average educational attainment than less resilient communities. Lastly, a probable consequence of higher human capital is lower unemployment (Green & Haines, 2016). Accordingly, unemployment should either increase less rapidly or decrease more rapidly in resilient communities than in nonresilient communities.
While there are at least six other forms of community capital to consider in tests of the resilience hypothesis (Flora et al., 2015), focusing exclusively on human capital for the analysis discussed here was a matter of practicality. Going beyond one type of capital would have necessitated a larger study, additional sources of data, and more article space. For these reasons, incorporating more forms of community capital into the analysis is a task for future research.
That being said, Table 1 summarizes all the matching and outcome variable data for the treatment and control groups by time period. The final four rows of the table provide information on the spatial distribution of the studied communities relative to the geographic center of Montana.
|
Overall sample (n = 32) |
Treatment (n = 16) |
Control (n = 16) |
||||
| Variable | Before | After | Before | After | Before | After |
| Total population | 1,920 (2,497) | 2,175 (3,529) | 2,391 (2,142) | 2,407 (2,164) | 1,449 (2,796) | 1,944 (4,575) |
| Poverty rate (%) | 0.1046 (0.0584) | 0.1537 (0.1225) | 0.1015 (0.0468) | 0.1380 (0.0658) | 0.1077 (0.0696) | 0.1695 (0.0861) |
| Minority population (%) | 0.1136 (0.2314) | 0.1409 (0.2614) | 0.0940 (0.2118) | 0.1195 (0.2308) | 0.1333 (0.2549) | 0.1623 (0.2948) |
| School dropout rate (%)a | 0.0357 (0.0512) | 0.0936 (0.1421) | 0.0478 (0.0483) | 0.0657 (0.1075) | 0.0235 (0.0526) | 0.1214 (0.1689) |
| Absence of high school equivalency degree rate (%)a | 0.1822 (0.0695) | 0.1094 (0.0935) | 0.1821 (0.0524) | 0.0976 (0.0454) | 0.1822 (0.0850) | 0.1212 (0.1253) |
| Unemployment rate (%)a | 0.0583 (0.0473) | 0.0840 (0.1405) | 0.0641 (0.0531) | 0.0637 (0.0926) | 0.0524 (0.0416) | 0.1042 (0.1770) |
| % northwest | — | n/a | — | n/a | — | n/a |
| % northeast | 0.1250 | n/a | 0.1875 | n/a | 0.0625 | n/a |
| % southeast | 0.5000 | n/a | 0.4375 | n/a | 0.5625 | n/a |
| % southwest | 0.3750 | n/a | 0.3750 | n/a | 0.3750 | n/a |
|
Note. Cell entries are averages; standard deviations are in parentheses. aOutcome variable used to evaluate the resilience hypothesis. |
||||||
Testable Hypotheses and Method
To test the hypothesis that participant communities from the MSU Extension program exhibit greater gains, or fewer losses, in their human capital stocks relative to nonparticipant communities, the general trends in the outcome variables from Table 1 were considered. The school dropout and unemployment rates both increased, whereas the absence of high school equivalency degree rate decreased. The former increases suggest decreases in human capital. On the other hand, the decrease in the third outcome variable is suggestive of increased human capital, in the form of higher average education levels. Examining these changes through the resilience frame described in this article, standard difference-in-differences techniques were used to determine whether the two negative changes were less negative (on average) for participants and the one positive change was less positive (on average) for nonparticipants.
For any given quantity of interest, a difference-in-differences estimator subtracts the mean difference in that quantity between two groups before
some treatment is applied from the mean between-group difference after the treatment. Any observed pretreatment difference is presumably the result of unobserved variation in group-level attributes. Assuming that these unobserved attributes do not vary with time, the "before" difference between groups should equal the "after" difference plus any effect from the treatment (Gerber & Green, 2012). Let ![]() represent this average treatment effect for some variable x. Adopting this notation, Table 2 lists the three hypotheses that were tested.
represent this average treatment effect for some variable x. Adopting this notation, Table 2 lists the three hypotheses that were tested.
| Hypothesis | Explanation |
| τdropout < 0 | Because the overall school dropout rate increased between time periods, the resilience hypothesis suggests that the increase (negative outcome) should be smaller (muted) in treatment communities relative to control communities. Therefore, the treatment effect should be negative. |
| τno diploma < 0 | Because the overall absence of high school equivalency degree rate decreased between time periods, the resilience hypothesis suggests that the decrease (positive outcome) should be greater (amplified) in treatment communities relative to control communities. Therefore, the treatment effect should be negative. |
| τunemployment < 0 | Because the overall unemployment rate increased between time periods, the resilience hypothesis suggests that the increase (negative outcome) should be smaller (muted) in treatment communities relative to control communities. Therefore, the treatment effect should be negative. |
Results
The difference-in-differences estimates for the three outcome variables are directly computable from the summary data in Table 1:
Supporting the hypotheses explicated in Table 2, all the estimated treatment effects are nonzero, and all take on the appropriate negative signs.
The next task was to determine whether these effects are statistically significant. In (quasi)experimental research, statistical significance is regularly assessed via randomization inference (Gerber & Green, 2012). In this analysis, randomization inference refers to a numeric permutation approach that randomly reallocated communities to the treatment and control groups (9,999 times) and compared the observed values of each difference-in-differences estimate to the resulting random distributions. The locations of the observed values relative to the corresponding random distributions provided measures of how likely it would be to obtain the empirical estimates by chance alone. The outputs from this exercise are depicted graphically in Figures 1–3 for the school dropout rate, absence of high school equivalency degree rate, and unemployment rate indicators, respectively.
Figure 1.
Difference-in-Differences: School Dropout Rate
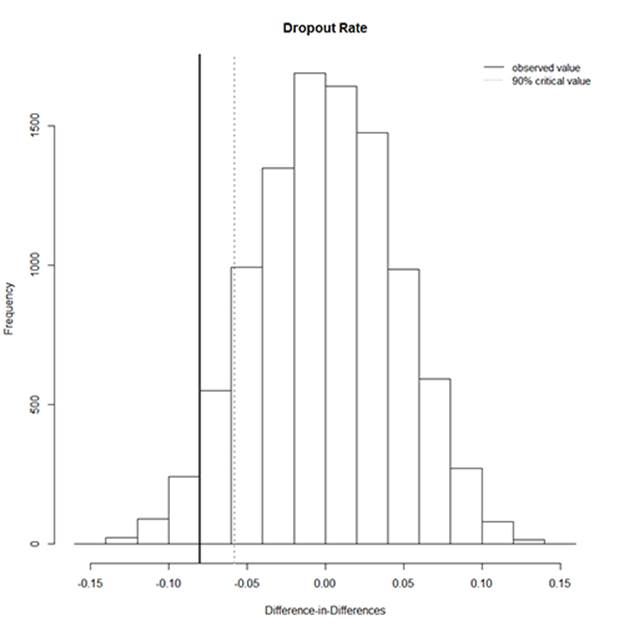
Figure 2.
Difference-in-Differences: Absence of High School Equivalency Degree Rate
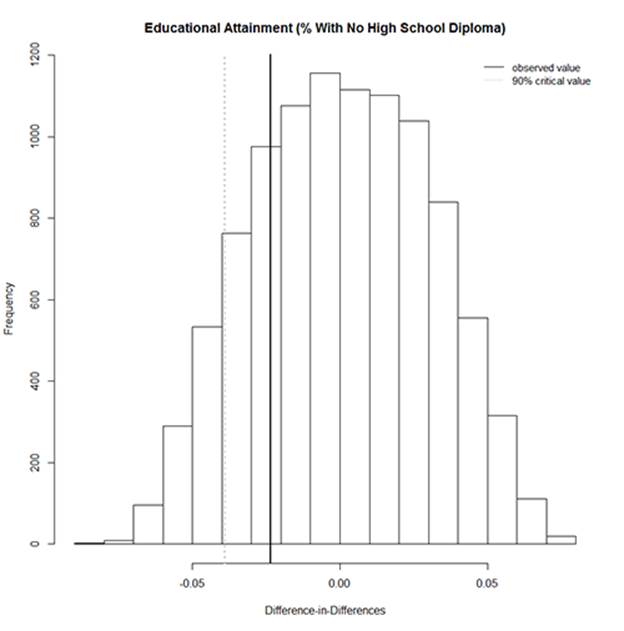
Figure 3.
Difference-in-Differences: Unemployment Rate
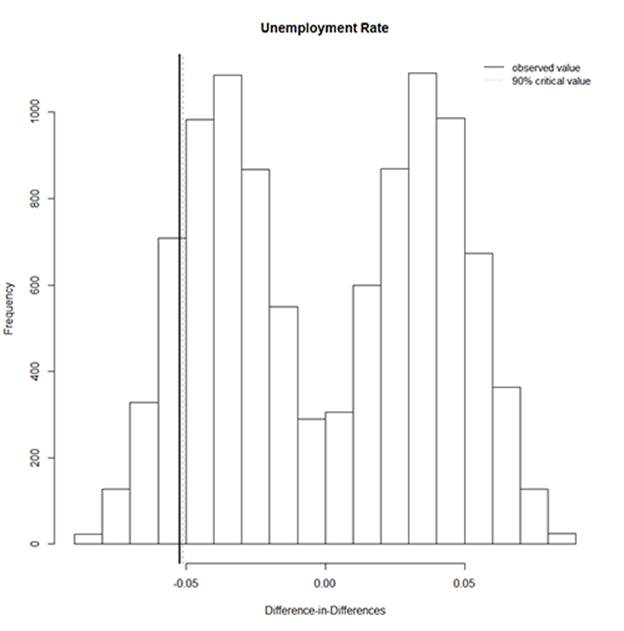
In each of the above histograms, the observed difference-in-differences estimate is represented by a solid line. The 90% critical value for a one-tailed hypothesis test is shown as a dotted line. Note that for two of the three indicators, the observed value is more extreme than the critical value. For school dropout rate (Figure 1, pseudo p = 0.0347) and unemployment rate (Figure 3, pseudo p = 0.0991), the treatment effects are statistically significant at conventional levels of confidence (95% and 90%, respectively). For absence of high school equivalency degree rate (Figure 2, pseudo p = 0.2248), the treatment effect is not statistically significant. Notwithstanding this nonsignificant result, the findings collectively support the hypothesis that communities that participated in the MSU Extension program exhibited higher aggregate resilience, on average, than the control communities.
Discussion
The data for this study came from publicly accessible U.S. Census surveys that were administered before and after an MSU Extension program that involved 16 rural communities. Using received methods of statistical matching (Ho et al., 2007), a control group of 16 communities that did not participate in the program was constructed for comparative purposes. Three selected indicators of human capital were then leveraged in quantitative analyses. In the combined sample of treatment and control communities, the temporal trends were for the school dropout and unemployment rates to increase and the percentage of the population without a high school equivalency degree to decrease. The former changes can be considered negative (disinvestments in human capital), whereas the latter is positive. All else being equal, more resilient communities should experience negative changes less intensely and positive changes more intensely than less resilient communities. Hence, if the MSU Extension program successfully built resilience (capacity) in participant communities, this pattern of outcomes should manifest in the selected indicators.
Indeed, difference-in-differences analyses that measured indicator-specific treatment effects uniformly supported the resilience hypothesis. First, the average school dropout rate in the treatment communities rose at a much slower rate than in the control communities, and this effect was statistically significant. Second, the sample-wide decrease in the percentage of adults without a high school equivalency degree was amplified in treatment communities: the average drop was 8.5 percentage points in the treatment group, compared to just 6.1 percentage points in the control group. Although this result was not statistically significant, the direction and magnitude of the change fit well with and therefore strengthen the inferences made from the parallel hypothesis tests. Finally, and perhaps most interestingly, the unemployment rate in the treatment communities bucked the overall trend. Whereas the mean sample-wide unemployment rate increased from the 2000 long-form census to the 2009–2013 American Community Survey—as did the statewide rate in Montana, from 0.063 to 0.073—in the treatment communities, unemployment ticked slightly downward. That is, more than merely experiencing a negative change less intensely than control communities, on average, treatment communities avoided the rise in unemployment altogether.
Conclusions, Limitations, and Implications
There is growing interest in the concept of resilience among practicing and academic planners (Eraydin & Tasan-Kok, 2013). Yet the Extension community has been embracing this concept and actively addressing it through capacity-building programs for much longer than its relatively recent appearance in the scholarly literature (e.g., Sandmann & Kroshus, 1991). However, because building resilience is somewhat of an intangible outcome of community development (e.g., Lachapelle, 2011), Extension leaders can have difficulty demonstrating it quantitatively. Although specific actions and activities engendered by community development processes are important sources of evidence for program effectiveness (Lachapelle, Emery et al., 2010), public policy makers and other end users of Extension knowledge tend to exhibit quantitative biases (Leurs, 1996). The upshot is that Extension institutions can strengthen their position at the forefront of this new wave of resilience planning (Eraydin, 2013) by engaging in more quantitative research that points to the potential effects of their capacity-building programs.
Along these lines, this article used a replicable methodology for producing preliminary empirical evidence regarding the effectiveness of a selected MSU Extension program. Specifically, difference-in-differences analyses of publicly available U.S. Census data compared changes in the average levels of three human capital indicators in participant communities to the same indicators in a statistically matched control group. The results of the analyses offer convincing and consistent support for the hypothesis that participant communities were characterized by higher aggregate resilience than the control communities, on average, following the Extension intervention. Nonetheless, keep in mind that this article discusses a pilot study, and, as such, its findings should be considered inchoate. Future research is needed to test the resilience hypothesis with data that are more finely tuned to the objectives at hand. U.S. Census data place tight constraints on the geographic scales and temporal intervals at which they can be analyzed. Therefore, updates and extensions to this work should attempt to operationalize treatment and control observations with more precise spatial boundaries and with valid and reliable data that are measurable at frequent and regular intervals. As more—and more robust—quantitative evidence for the capacity-building effects of Extension community development interventions is generated, the many contributions of these programs to community resilience will rapidly take on new value as instructional materials for the scholars, practitioners, and government officials who are increasingly embracing a resilience planning perspective.
References
Adger, W. N., & Brown, K. (2009). Vulnerability and resilience to environmental change: Ecological and social perspectives. In N. Castree et al. (Eds.), A companion to environmental geography (pp. 109–122). Chichester, England: Wiley-Blackwell.
Allen, B .L., & Morton, L. W. (2006). Generating self-organizing capacity: Leadership practices and training needs in non-profits. Journal of Extension [online], 44(6) Article 6FEA6. Available at: http://www.joe.org/joe/2006december/a6.php.
Blanke, A. S., & Walzer, N. (2013). Measuring community development: What have we learned? Community Development, 44(5), 534–550.
Dorius, N. (2011). Measuring community development outcomes: In search of an analytical framework. Economic Development Quarterly, 25(3), 267–276.
Elkins, L. A., Bivins, D., & Holbrook, L. (2009). Community visioning process: A tool for successful planning. Journal of Higher Education Outreach and Engagement, 13(4), 75–84.
Emery, M., & Flora, C. (2006). Spiraling-up: Mapping community transformation with community capitals framework. Community Development, 37(1), 19–35.
Eraydin, A. (2013). "Resilience thinking" for planning. In A. Eraydin & T. Tasan-Kok (Eds.), Resilience thinking in urban planning (pp. 17–38). Heidelberg, Germany: Springer.
Eraydin, A., & Tasan-Kok, T. (2013). Introduction: Resilience thinking in urban planning. In A. Eraydin & T. Tasan-Kok (Eds.), Resilience thinking in urban planning (pp. 1–16). Heidelberg, Germany: Springer.
Esri. (n.d.). Business analyst. Retrieved from http://www.esri.com/software/businessanalyst
Flora, C. B., Flora, J. L., & Gasteyer, S. P. (2015). Rural communities: Legacy and change (5th ed.). Boulder, CO: Westview Press.
Gerber, A. S., & Green, D. P. (2012). Field experiments: Design, analysis, and interpretation. New York, NY: W.W. Norton.
Green, G. P., & Haines, A. (2016). Asset building and community development (4th ed.). Los Angeles, CA: Sage.
Ho, D., Imai, K., King, G., & Stuart, E. (2007). Matching as nonparametric preprocessing for reducing model dependence in parametric causal inference. Political Analysis, 15, 199–236.
Ho, D., Imai, K., King, G., & Stuart, E. (2011). MatchIt: Nonparametric preprocessing for parametric causal inference. Journal of Statistical Software, 42(8), 1–28.
Kodrzycki, Y. K., & Muñoz, A. P. (2015). Economic distress and resurgence in U.S. central cities: Concepts, causes, and policy levers. Economic Development Quarterly, 29(2), 113–134.
Lachapelle, P. (2011). Leadership and civic engagement outcomes from Horizons: Understanding the potential for increased citizenship. Montana Policy Review, 15(1), 17–21.
Lachapelle, P., Austin, E., & Clark, D. (2010). Community strategic visioning as a method to define and address poverty: An analysis from select rural Montana communities. Journal of Extension [online], 48(1) Article 1FEA1. Available at: http://www.joe.org/joe/2010february/pdf/JOE_v48_1a1.pdf
Lachapelle, P., & Clark, D. (2011). Introduction. Montana Policy Review, 15(1), 1.
Lachapelle, P., Emery, M., & Hays, R. L. (2010). The pedagogy and practice of community visioning: Evaluating effective community strategic planning in rural Montana. Community Development, 41(2), 176–191.
Leurs, R. (1996). Current challenges facing participatory rural appraisals. Public Administration and Development, 16(1), 8–10.
Mastel, T. (2011). Horizons program changes leadership infrastructure in southwest Montana. Montana Policy Review, 15(1), 17–21.
Morehouse, D. L. (2010). Northwest Area Foundation Horizons Program 2003–2010 final evaluation report. Menomonie, WI: Quality Evaluation and Development.
Moss, M. L., & Grunkemeyer, W. T. (2010). Building shared visions for sustainable communities. Community Development, 41(2), 240–254.
Nelson-Dusek, S. (2013). Seeding change in rural and reservation communities: The story of Horizons. St. Paul, MN: Wilder Research.
Phillips, R., & Pittman, R. H. (2009). A framework for community economic development. In R. Phillips & R. H. Pittman (Eds.), An introduction to community development (pp. 3–19). New York, NY: Routledge.
Robinson, J. W., Jr., & Meikle-Yaw, P. A. (2007). Building social capital and community capacity with signature projects: A case study of two diverse Delta communities. Journal of Extension [online], 45(2) Article 2FEA4. Available at: http://www.joe.org/joe/2007april/a4.php
Romanini, C. (2014). An analysis of the impacts of the Ready, Set, Go! program on program participants and the ability to build community capacity. Journal of Extension [online], 52(3) Article 3RIB4. Available at: http://www.joe.org/joe/2014june/rb4.php
Sandmann, L. R., & Kroshus, J. (1991). Project future: Vision-based community development. Journal of Extension [online], 29(3) Article 3FUT1. Available at: http://www.joe.org/joe/1991fall/fut1.html
Social Explorer. (n.d.-a). About Social Explorer. Retrieved from http://www.socialexplorer.com/about
Social Explorer. (n.d.-b). Data dictionary: School dropout rate for population 16 to 19 years. Retrieved from https://www.socialexplorer.com/data/ACS2012_5yr/metadata/?ds=Social+Explorer+Tables%3A++ACS+2012+%285-Year+Estimates%29&table=T030
U.S. Census Bureau. (n.d.). American Community Survey. Retrieved from https://www.census.gov/history/www/programs/demographic/american_community_survey.html