June 2015
|
June 2015 // Volume 53 // Number 3 // Research In Brief // v53-3rb6


Would Consumers Purchase a Wider Variety of Produce and Products at West Virginia Farmers' Markets if They Were Available?
Abstract
This article examines whether or non-consumers would purchase different produce and products if they were available at farmers' markets in West Virginia? A statewide, multi-year research project has generated data to answer this question. Surveys were administered to indicate what consumers are purchasing at West Virginia farmers' markets and what they would like to purchase. Additional information was gathered to show public perceptions of the markets, consumer shopping habits, and reasons for not shopping at the market. Results show that there is consumer demand for a wider variety of produce at West Virginia farmers' markets.
Introduction
Interest in sustainable living is at an all-time high and continues to increase. Responsible consumption through eating locally grown foods, better nutrition, the organic movement, and cost-saving measures are all contributing factors for the increased demand for farmers' markets. The United States Department of Agriculture (USDA) Farmers' Market Directory Listing (2013) shows a steady increase of farmers markets from 6,132 markets in 2010 to 8,144 in 2013—a 20.6% increase.
In West Virginia there are currently 90 farmers' markets operating in 110 locations (Crane, 2013). According to the West Virginia University Extension Small Farm Center (2013), the total value of food purchased by West Virginians is $7.2 billion. Yet local farmers in this state capture only a small percentage of those sales, either through direct or indirect marketing. In fact, farmers' markets contributed around $4 million dollars to our state's economy last year—nearly all of which went directly to small farmers (Crane, 2013). Many counties in West Virginia also have limited sites for consumers to purchase food. Farmers markets could be an additional venue for consumers to acquire high-quality produce and local foods. However, farmers must understand consumer perceptions and trends to be able to meet the current demands and to anticipate future trends.
This article explores the findings from three surveys delivered over the course of 3 years. It began with a pilot study in 2010 to gauge the attitudes of market shoppers. The original instrument was modified to clarify wording and include demographics. After data analysis, additional surveys were developed and distributed. One gauged additional attitudes of market shoppers, and a second targeted individuals who did not shop at farmers markets to find out why. The combined results of all three surveys have allowed us to answer the question: Would consumers purchase a wider variety of produce and products if they were available?
Literature Review
A review of previous work revealed minimal research in the area of farmers' markets as they relate to consumers' perceptions of availability of produce. While many research articles noted consumers' perceptions about farmers' markets, most cited perceptions about quality, freshness, prices, and marketing strategies of the respective farmers' markets. Research by Baker, Hamshaw, & Kolodinsky (2009) identified the top three reasons consumers reported visiting farmers' markets: local food, fresh food, and support for local agriculture. Similar studies in Alabama, Michigan, and New Jersey all reported quality as the main reason consumers patronize markets (Onianwa, Mojica, & Wheelock, 2006; Connor, Colasanti, Ross, & Smalley, 2010; Govindasamy, Italia, & Adelaja, 2002).
Two studies conducted in West Virginia examined producer's sales. Brown, Gandee, and Sousa (2006) analyzed data from the 2002 Census of Agriculture and found that increased market sales were related to increased median housing value, increased population density, and an increased variety of fruit and vegetable production. Brown et al. (2006) surveyed farmers' markets vendors and found that the number of products produced is positively correlated with the farmers' income. If a farmer adds one product to what he sells, the percentage of the household income from farmers' markets increases by .5% annually.
No research was identified that addressed what produce the consumers are purchasing at markets. Our research specifically asks about consumers' perceptions of produce available at the farmers' markets to help determine if farmers are meeting the demand. Our research has helped to fill this gap.
Methods
Three agents developed a pilot survey and disseminated it at three West Virginia farmers' markets in the summer of 2010. The pilot survey concentrated on shopping patterns and demographics. A total of 219 individuals responded to the survey. The data was shared with colleagues, and several other agents were interested in teaming together to distribute surveys across the state. The survey was modified to correct small discrepancies, and IRB approval was obtained. In 2011 the survey was distributed to the initial three markets and an additional nine markets, for a total of 12 farmers' markets across the state with a total number of 641 respondents. The survey evaluated respondents' shopping habits at farmers' markets and demand for certain produce items. The markets included in the survey were from counties where Extension faculty were involved as active research investigators and represent a cross-section of markets in West Virginia based on geography, agricultural activity, and income levels. Table 1 shows the survey instruments used for the study, their purpose, and number of respondents.
The first section of survey one included questions regarding where patrons typically purchase in-season vegetables, how often they shop at farmers'' markets, amount spent per visit, and factors that influence produce purchases (e.g., freshness, price, organic). The second section addressed products patrons currently purchase, as well as what items they would purchase if available.
After data analysis, it was evident that more data were needed to show a full picture of market demand; therefore, instruments were developed and distributed to collect more information about demands and to collect information from non-shoppers as well. Survey two only asked three demographic questions and concentrated more on patrons' current purchases and desired purchases. For example, the survey asked what patrons currently purchase, would purchase if available, and would not purchase. It also expanded the number of items a respondent could select, including more fruits, plants, and value-added products. Survey two was distributed at three farmers' markets for a total of 120 respondents.
The third survey addressed why some citizens do not patronize their local market. The survey focused on a number of perceived and real issues that provide barriers to shopping at farmers' markets. The market non-shopper survey instrument was disseminated at Extension activities, such as at community nutrition education classes as well as at events not sponsored by Extension, such as classes for child care providers and outside grocery stores. A total of 160 individuals completed survey three.
Surveys one and two were administered at farmers' markets during community events hosted by each county's respective West Virginia University (WVU) Extension Service office. Extension staff asked patrons to complete the survey. Customers were given a letter that explained the study and explained IRB approval and were informed that participation was voluntary. Patrons who elected to complete the survey were given a reusable shopping bag as compensation. The data were analyzed using IBM PASW Statistics 18.
| Survey | Purpose | # of Markets | N | Year |
| Pilot | Pilot | 3 | 219 | 2010 |
| Survey 1 | Shopping Habits and Market Demand | 12 | 641 | 2011 |
| Survey 2 | Market Demand | 3 | 120 | 2012 |
| Survey 3 | Non-Shopper Barriers | N/A | 160 | 2012 |
Results
Consumer Demographics
Our data show that the majority of the shoppers in the Shopping Habits Survey (Survey 1) were women (77.7%). At 39.8%, the majority of shoppers were 61 years old or older, 37.4% were between 41 and 60, and 22.8% were 18 to 40 years old. Just over a third (34.3%) reported a household income of over $50,000, with another third (33.4%) reporting between $20,000 and $50,000. Money spent per visit to the market was fairly high, with 57.4% reporting they spend between $11 and $25 and 14.9% reporting spending between $26 and $50.
In the Market Demand Survey (Survey 2), again the majority of shoppers were women (85.7%). About a third (32.5%) of the shoppers were between the ages of 61 and 75, 25.4% were between 46 and 60, and 23.3% were 31 to 45. Over half had some college or a college degree (57.2%), 21.9% had a high school diploma or GED, 6.7% had some high school, and the remaining 14.3 % had a master's degree or higher.
The Non-Shopper Barrier Survey (Survey 3) showed similar gender results, with 85.2% of the respondents being women. The age of the respondents was considerably lower, with 45.3% being 18 to 30 years of age, 19.5% between 31 and 45 years, and 21.4% were 46 to 60 years old. In addition, the educational levels were also different. More than half (54.2%) had a high school diploma or GED, 26% had some college, 12.2% had a college degree, 1.5% had a master's degree, and 6.1% reported having some high school.
This data indicates that farmers' market shoppers tend to be female, higher income, older, and have a high education level. Non-market shoppers tend to be female, younger, and with less education.
Consumer Purchasing Habits & Desires
The Shopping Habits Survey (Survey 1) identified what produce customers are buying the most. Not surprising, the most purchased items were corn, tomatoes, cucumbers, beans, bell peppers, and squash.
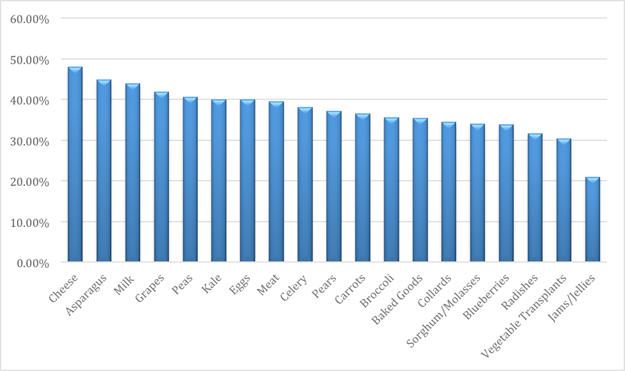
The Market Demand Survey (Survey 2) identified what produce items customers would like to buy if not already available at their market. The top responses included: cheese (47.9%); asparagus (44.8%); milk (43.8%); grapes (41.9%); peas (40.6%); eggs (40%); kale (40%); meat (39.4%); and celery (38.1%). See Figure 1 below.
Figure 1.
What Products Consumers Would Buy If Available
Non-Customer Perceptions
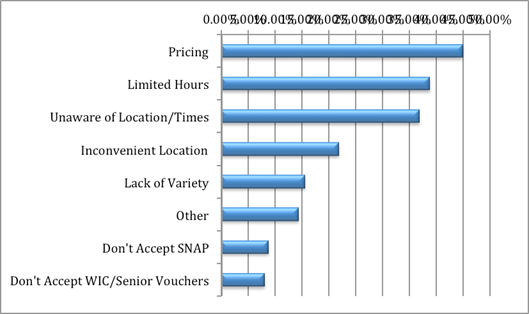
The Non-Shoppers Barriers Survey (Survey 3) targeted individuals who do not shop at the market to ascertain their reasons. Those surveyed identified pricing as an issue (45%); limited hours (38.8%); unaware of locations or times (36.9%); and inconvenient location (21.9%) as the top reasons for not shopping at a farmers' market. See Figure 2 below.
Figure 2
Perceived Barriers to Buying at Farmers' market
Discussion
Our conclusions show that consumers would purchase a wider variety of farm products at farmers' markets if they were available. Factors described by our consumers as "very important" include freshness, value, and pricing. The produce most frequently purchased is also the produce most common to farmers' markets such as corn, tomatoes, cucumbers, beans, peppers, etc. Our research indicates that there is a significant demand for items such as cheese, milk, eggs, peas, asparagus, and other products that consumers would buy if available. Many of these items, such as dairy and meat products, require additional oversight, and the regulatory environment may be a hurdle for some farmers to consider production. Many of these items also require higher overhead, labor, and infrastructure such as cold storage on-farm and at market. For some farmers these hurdles may be insurmountable. However, the data clearly supports that there is a demand for these products. Market shoppers are hungry for more variety. If vendors are willing and able to fill this gap, it could promote more consumer traffic and sales.
In order to close the gap between production of and demand for locally grown foods, Extension and other service providers need to assist farmers to vary their products. Farmers should be educated that if they had more variety there are consumers who would purchase these products. In addition, further study is needed to see if farmers have any barriers (real or perceived) to expanding their offerings. Items such as soil maintenance, variety selection of crops, transportation, and packaging need to be addressed. Using information gathered by the research reported here, Extension should focus on education and outreach efforts to assist local farmers. Additionally, there needs to be an effort to address issues that can limit production and marketing, such as infrastructure for meat processing and adherence to state and county laws in regards to selling meat and dairy products.
Our sample of non-consumers shows misconceptions that could be corrected with a targeted outreach campaign. A concerted outreach plan aimed to educate consumers about market locations, times, and competitive pricing would increase market patronage. Agricultural agencies in the state have begun to work together to address the lack of awareness of and misconceptions about farmers' markets in the state. However, our research shows that further work and cooperation is needed between the various agencies and groups (Extension, the Department of Agriculture, market associations) to provide programs that will help markets and farmers address these issues on the local level.
Acknowledgments
Special thanks to graduate students Lindy Hoeft and Elizabeth Lazear for their assistance.
References
Baker, D., Hamshaw, K., & Kolodinsky J. (2009). Who shops at the market? Using consumer surveys to grow farmers' markets: Findings from a regional market in Northwestern Vermont. Journal of Extension [On-line], 47(6). Article 6FEA2. Available at: http://www.joe.org/joe/2009december/a2.php
Brown, C., Gandee, J. E., & D'Sousa, G. (2006). West Virginia farm direct marketing: A county level analysis. Journal of Agricultural and Applied Economics, 38(3), 575-584.
Brown, C., Miller, S. M., Boone, D. A., Boone, H. N., Jr., Gartin, S. A., & McConnell, T. R. (2006). The importance of farmers' markets for West Virginia direct marketers. Renewable Agriculture and Food Systems, 22(1), 20-29.
Connor, D., Colasanti, K., Ross, B.R., & Smalley, S.B. (2010). Locally grown foods and farmers markets: Consumer attitudes and behaviors, Sustainability, 2, 742-756.
Crane, K. (2013). Showcasing success at your farmers market. (Available from the West Virginia Farmers Market Association, 4700 MacCorkle Avenue SE Suite 101 Charleston, WV 25304).
Onianwa, O., Mojica, M., & Wheelock, G. (2006). Consumer characteristics and views regarding farmers markets: An examination of on-site survey data of Alabama consumers. Journal of Food Distribution Research, 37(1), 119-125.
Govindasamy, R., Italia, J., & Adelaja, A. (2002). Farmers' markets: consumer trends, preferences, and characteristics. Journal of Extension [On-line], 40(1). Article 1RIB6. Available at: http://www.joe.org/joe/2002february/rb6.php
United States Department of Agriculture (2013). National count of farmers market directory listings. Agricultural Marketing Service. August 2013. Retrieved from: http://www.ams.usda.gov/AMSv1.0/ams.fetchTemplateData.do?template=TemplateS&leftNav=WholesaleandFarmersMarkets&page=WFMFarmersMarketGrowth&description=Farmers%20Market%20Growth
West Virginia University. (2013). Facts about small farms. Retrieved from: http://smallfarmcenter.ext.wvu.edu/