June 2015
|
June 2015 // Volume 53 // Number 3 // Ideas at Work // v53-3iw2


Using Maps in Web Analytics to Evaluate the Impact of Web-Based Extension Programs
Abstract
Maps can be a valuable addition to the Web analytics toolbox for Extension programs that use the Web to disseminate information. Extension professionals use Web analytics tools to evaluate program impacts. Maps add a unique perspective through visualization and analysis of geographic patterns and their relationships to other variables. Maps can help assess whether program goals are being met and lead to better understanding of the roadblocks to effective online information delivery. This article shows how maps can be generated using free Geographic Information System software, using the website of the Wisconsin State Cartographer's Office as a case study.
Introduction
Evaluation of program impact has been a long-standing concern within Extension. Numerous Journal of Extension articles, including the entire September 1983 and June 2009 issues, focus on this topic. Interest in program evaluation reflects increased demand for accountability from administrators, government officials, and the public (Powell, 2011; Rennekamp & Arnold, 2009; Shepard, 2002). Extension professionals must be able to demonstrate that resources are being used effectively and that programs have made a difference in the community (Culp, 2009).
Web technology is increasingly used in Extension for information dissemination and program delivery. Extension professionals have called for Web analytics to be used in this context (Patton & Kaminski, 2010; Rader, 2011), and numerous case studies have been published (e.g., Neal, 2010; Parish, 2011). Web analytics refers to data collection and analysis to improve website effectiveness. In Extension, Web analytics can play a significant role in the effort to evaluate and enhance program impact for an increasingly online audience.
One shortcoming of Web analytics case studies is that they rarely include maps, although some exceptions exist (e.g., Jones, Kaminski, Christians, & Hoffman, 2011; Patton & Kaminski, 2010). Maps can be used to visualize geographic patterns of usage, delineate the physical reach of a website, and identify under-served areas. When coupled with ancillary data and statistical methods, maps facilitate exploration of geographical patterns and relationships. Maps provide a geographical perspective that offers unique insights into the effectiveness of online information delivery.
In short, maps can be a valuable addition to the Web analytics toolbox in Extension. Through a simple case study, this article demonstrates how maps can be generated using free Geographic Information System (GIS) software and how these maps can be used in program evaluation.
Methods
The website of the Wisconsin State Cartographer's Office (SCO, http://www.sco.wisc.edu) is used as a case study. Although technically not an Extension program, the SCO is responsible for statewide outreach, education, and applied research consistent with the mission of the University of Wisconsin and its "Wisconsin Idea" tradition (http://www.wisconsinidea.wisc.edu). Uniformity in website usage throughout the state is a key indicator of the effectiveness of the SCO's online information delivery program.
Data for the case study were derived using Google Analytics (http://www.google.com/analytics), a free Web analytics tool (Patton & Kaminski, 2010). A custom report was created for the period from January 1, 2012 to December 31, 2013, using the number of website sessions as the key metric. A session is defined as a period of interaction between a website and browser (Google, 2014). A session is initiated by a single user, can contain multiple page views, and may last from several seconds to many hours.
The mapping tools found in Web analytics software often have limited flexibility (Svoboda, 2007). Aggregation of observations may be restricted to countries, states, and cities, making it impossible to analyze data for other zones like counties. Statistical analysis incorporating ancillary data like Census variables can also be challenging. A simple solution is to use GIS for map-making based on data exported from Web analytics software. For this approach to succeed, the exported data simply need to contain a geolocation (latitude-longitude) for each record.
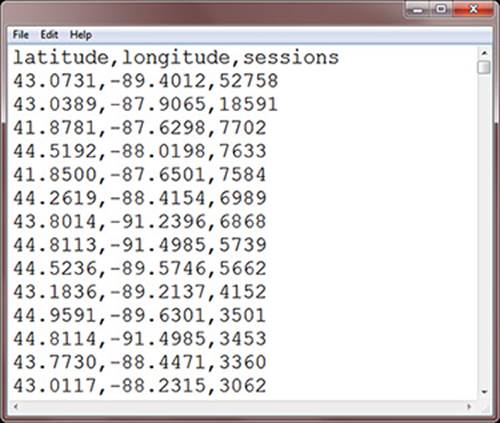
Figure 1 is a screenshot of the report exported from Google Analytics for the case study, after minor cleaning in word processing software. Each record contains a latitude-longitude pair and the number of sessions for that location over the two-year study time frame.
Figure 1.
Portion of the Report File Showing the Number of Sessions for Each Location
A "shapefile" (common GIS data format) of Wisconsin county boundaries was used for map-making. The shapefile, including selected demographic variables, was downloaded for free from the US Census Bureau (http://www.census.gov/geo/maps-data/data/tiger-data.html).
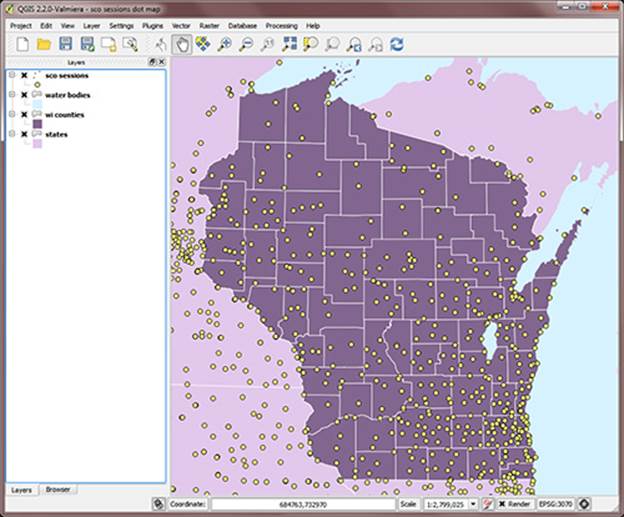
QGIS, a free GIS software package, was used for map-making (QGIS Development Team, 2014). Figure 2 shows the QGIS interface with the county shapefile and session locations displayed. Water bodies and state land areas are also displayed to improve the appearance of the map, but this is not required.
Figure 2.
QGIS Interface Showing Map of Session Locations for the SCO Website for 2012-13
A QGIS function was used to count the number of points falling within each county weighted by the number of sessions for that point, yielding the total number of sessions for each county. Figure 3 is a map created in QGIS showing the average monthly number of sessions per 1000 adults. This index is based on the county's adult population, one of the variables from the Census.
Figure 3.
Map Showing Average Number of SCO Website Sessions per Month per 1000 Adults, by Wisconsin County, for 2012-13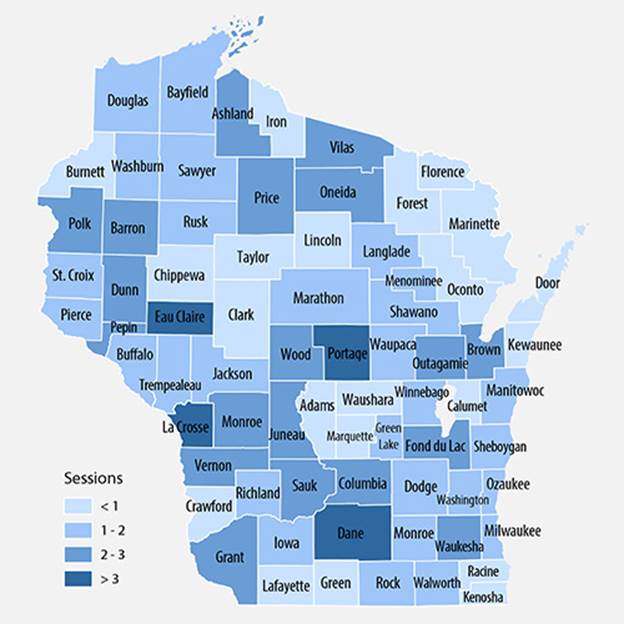
Results
Figure 3 shows that there are variations in usage rates across the state. The counties with the highest usage—Dane, Eau Claire, Portage, and La Crosse—are home to four of the largest University of Wisconsin campuses. These counties also contain some of the state's largest cities. Several other counties with large cities also have high usage rates, including Outagamie, Brown, Fond du Lac, and Waukesha. There are several rural low-use clusters, including the Northeast (centered on Marinette county), the North Central region (centered on Clark and Taylor counties), and the Central region (Adams, Marquette, and Waushara counties).
Exceptions to these patterns occur in several areas. In the Southeast, some of the most urbanized counties (Milwaukee, Racine, and Kenosha) have relatively low usage rates, while in the North, several rural counties (Ashland, Price, Oneida, and Vilas) have relatively high rates.
Conclusions
The geographical patterns mapped in the case study suggest that high usage rates for the SCO website are generally associated with the presence of university campuses and urban centers, variables that are likely to be correlated with faster broadband access, higher educational attainment, a younger population, and higher income. Although some exceptions exist, usage seems to be highest where rates of Web access and familiarity are at their peak. Therefore, efforts to reach out to under-served areas may benefit from a focus on demand-oriented strategies (Whitacre, 2008), such as improving knowledge of the SCO website and what it has to offer.
With the increased use of Web technology in Extension, Web analytics is becoming more relevant for evaluating program impact. Maps can be a valuable addition to this effort, because they allow for visualization and analysis of geographic patterns that may help identify roadblocks to more effective online information delivery.
References
Culp, III, K. (2009). The scholarship of Extension: Practical ways for Extension professionals to share impact. Journal of Extension [On-line], 47(6) Article 6COM1. Available at: http://www.joe.org/joe/2009december/comm1.php
Google. (2014). How sessions are calculated in analytics. Retrieved from: https://support.google.com/analytics/answer/2731565?hl=en
Jones, M. A., Kaminski, J. E., Christians, N. E., & Hoffman, M. D. (2011). Using blogs to disseminate information in the turfgrass industry. Journal of Extension [On-line], 49(1) Article 1RIB7. Available at: http://www.joe.org/joe/2011february/rb7.php
Neal, J. W. (2010). The first 4 years of a warmwater recreational pond management Web site in Arkansas. Journal of Extension [On-line], 48(3) Article 3FEA4. Available at: http://www.joe.org/joe/2010june/a4.php
Parish, J. A. (2011). Website usage information for evaluating beef cattle Extension programming. Journal of Extension [On-line], 49(5) Article 5TOT9. Available at: http://www.joe.org/joe/2011october/tt9.php
Patton, A. J., & Kaminski, J. E. (2010). Tracking the impact of your Web-based content. Journal of Extension [On-line], 48(4) Article 4TOT1. Available at: http://www.joe.org/joe/2010august/tt1.php
Powell, G. (2011). Strategies for ensuring high-impact outreach and scholarship. Journal of Extension [On-line], 49(1) Article 1TOT2. Available at: http://www.joe.org/joe/2011february/tt2.php
QGIS Development Team (2014). QGIS Geographic Information System. Open source Geospatial Foundation project. Retrieved from: http://qgis.osgeo.org
Rader, H. B. (2011). Extension is unpopular—On the Internet. Journal of Extension [On-line], 49(6) Article 6COM1. Available at: http://www.joe.org/joe/2011december/comm1.php
Rennekamp, R. A., & Arnold, M. E. (2009). What progress, program evaluation? Reflections on a quarter-century of Extension evaluation practice. Journal of Extension [On-line], 47(3) Article 3COM1. Available at: http://www.joe.org/joe/2009june/comm1.php
Shepard, R. (2002). Evaluating Extension-based water resource outreach programs: Are we meeting the challenge? Journal of Extension [On-line], 40(1) Article 1FEA3. Available at: http://www.joe.org/joe/2002february/a3.php
Svoboda, L. (2007). Possibilities of visualisation geolocation of Web pages visitors. Proceedings, GIS Ostrava. Retrieved from: http://gis.vsb.cz/GIS_Ostrava/GIS_Ova_2009/sbornik/Lists/Papers/071.pdf
Whitacre, B. E. (2008). Extension's role in bridging the broadband digital divide: Focus on supply or demand? Journal of Extension [On-line], 46(3) Article 3RIB2. Available at: http://www.joe.org/joe/2008june/rb2.php