February 2015
|
February 2015 // Volume 53 // Number 1 // Feature // v53-1a1


Website? Video? Facebook? Mobile App? One Group's Experience Developing and Comparing Urban Landscape Water Conservation Digital Outreach Resources
Abstract
The Center for Landscape Water Conservation, a resource for homeowners and industry professionals in New Mexico and west Texas, features a primary website, a portal, with unique content on YouTube, iTunes U, Picasa, Facebook, and a mobile app. The portal was evaluated on content, usability, interactivity, and marketing. The final survey indicated a high user-satisfaction rate. The portal has 2,100 unique visitors, and the YouTube channel, at a third the cost, has 55,000 views. The mobile app has 6,500 downloads. The cost-benefit outcomes are instructive in guiding Extension educators on how to best reach their target audience using digital-based resources.
Introduction
Persistent drought, water overuse, and population growth are depleting groundwater resources throughout the western U.S. Of these three causes of groundwater depletion, water overuse, particularly landscape water use, is relatively easy to address. Education and subsequent widespread adoption of water conserving landscapes ("xeriscapes") can lead to a 25% reduction in domestic water use (USEPA, 2012).
The Center for Landscape Water Conservation (Center) was established to provide online educational resources and outreach aimed at affecting domestic (non-manufacturing, non-agricultural) outdoor water use in New Mexico and neighboring El Paso, Texas. Targeted Web-based resources can be relatively cost-effective and have extensive reach. The Center was developed by a committee of regional professionals from academia, state and municipal governments, and business owners, with New Mexico State University (NMSU) as the lead institution. The committee identified two targeted groups: the general public and regional industry professionals. The "general public" included homeowners (the primary target) as well as municipal and private landscapers, park managers, municipal planners, county Extension agents, garden center and allied business owners, and students, in other words, those who need consolidated general-reference information on reducing landscape water use. The second group, "regional industry professionals," previously lacked a means to electronically share research and resources on water conservation practices with one another. Therefore, the website would have a private login area where this group could find specific industry research, post and share data and references, and find peers in the region.
To meet the needs of both groups, the Center was established as a digital clearinghouse of resources for the general public as noted above; for regional industry professionals, the Center would provide support resources via login to include current research, professional training references, and peer networking. In total, the Center created a primary website, www.xericenter.com, and produced targeted resources as follows.
- Forty narrated videos of four regional demonstration gardens shared on YouTube, www.youtube.com/xericenter, and iTunes U. On-demand video is relatively cost-effective and offers unique advantages to Extension as it can command large audiences without the time and distance barriers of face-to-face education. Specific research can be conducted on YouTube and Google to identify popular and unaddressed topics (Parish & Karisch, 2013).
- Still images of the demonstration gardens are posted on Picasa, www.picasaweb.com/xericenter.
- Southwest Plant Selector mobile app for iPhone and iPad, (Sutherin, Lombard, & St. Hilaire, 2013), was developed separately from the website components. Southwest Plant Selector was built using an existing plant database developed by the New Mexico Office of the State Engineer. It is the only app of expert-recommended xeric landscape plants for New Mexico, El Paso Texas, and surrounding areas.
- Social media sites on Facebook and Twitter were used primarily in promotion of Southwest Plant Selector and are envisioned to be used to post regional events, current news, and sharing for homeowners. The unique ability of social media sites like Facebook and Twitter is their ease of developing spaces for education, sharing, and socialization (Mains, Jenkins-Howard, & Stephenson, 2013).
Extension educators can successfully reach a wide and asynchronous audience using a variety of tools including wikis, blogs, podcasts, Facebook, and YouTube, which are readily accessible on the Internet and easily incorporated into educational outreach efforts (Kinsey, 2010). Today, Extension organizations might add mobile apps to their toolboxes, whether uniquely-developed or purchased, for organizational use in outreach activities. Apps make information available when and where needed (Drill, 2012), and many require no connectivity, a benefit to regions with expansive rural areas where wireless connection is spotty.
Below we detail the practices used to develop and evaluate the Center website. We also share our cost-benefit experience across the various platforms, which is significant because organizations need to make effective use of limited budgets.
Methodology
Website Development and Evaluation Process
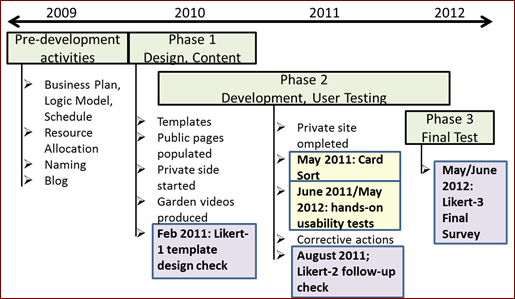
We followed a concurrent website development and evaluation approach that emphasized user testing and feedback (Sutherin, 2012). This approach helped us avoid potentially costly rework to correct problems discovered later in the development stage (Nielsen, 2012). Briefly, after the baseline website infrastructure was completed in pre-development, user feedback guided changes throughout the rest of the development process (Figure. 1).
Figure 1.
Timeline and Development Process for Creating www.xericenter.com
Specific evaluation criteria follows.
- Content, considered the most important determinant of a website's success (Teoh, Ong, Lim, Liong, & Yap, 2009), refers to the specific information on a website, the breadth and depth of that information, and whether or not the information provides what the user seeks. Content also refers to the structure (our site is a portal with some intranet -type features) and delivery method (static versus interactive) of the information. Extension content is suited to being organized by category, time, location, sequence, and/or alphabetically (Hill, Rader, & Hino, 2012).
- Usability is a practical matter, ensuring that something works intuitively and as intended for all users (Krug, 2006).
- Interactive features are second only to content in website success and refers to the level of communication between the user and website (Teoh et al., 2009). We isolated interactivity from usability criteria (they are typically evaluated together as usability) because the private side of our website is primarily interactive.
- Marketing. Driving both potential and repeat users to Web-based resources relies on an effective marketing plan (discussed in Marketing).
Activities completed in each phase (Figure 1) consisted of the following steps.
Pre-development activities included the use of a Logic Model (University of Wisconsin-Extension, 2003), a blog site to assemble content and track user behavior ahead of our programmers, and administrative activities (resource identification, IRB approval of methodology and survey questionnaires, hiring).
Phase 1 included design and content accumulation. We developed and populated the public side of the website, edited and moved blog content to the website, built templates and databases, filmed the demonstration gardens, initiated development of the professional login side of the site, and identified the testing schedule, structure, and resource requirements.
Video production was outsourced to NMSU Media Productions, an NMSU Extension-based group. The four selected demonstration gardens represent southern, central, and northern regions of the Center's geographic focus: two in El Paso, TX (south), one in Albuquerque, NM (central), and one in Farmington, NM (north). Filming was a full-day effort for the two El Paso gardens, and a 2-day effort for the central and northern gardens, including travel. Still photos captured at the video shoots were labeled and posted to Picasa.
To assess users' acceptance of the general website design and templates, we conducted a very small pilot survey (n=4) using the modified "User-Perceived Web Quality Instrument," a Likert-type survey (Aladwani & Palvia, 2002). We used this test as a usability test, where a few users provided specific comments and ratings on the proposed navigation.
Phase 2 spanned approximately 2 years and consisted of the primary development, programming, and user feedback exercises. Marketing elements to increase search rank were incorporated in Phase 2 (discussed in Marketing).
A card sort exercise to validate the site's content hierarchy (U.S. Department of Health and Human Services, 2012) was performed using a Web-based service, Optimalsort (www.optimalsort.com). Eleven participants, representing industry professionals, master gardeners, Extension agents, students, and university professors, grouped the site's subject matter under pre-set subject headings (Sutherin, 2012).
Hands-on usability surveys of two to five participants each, using the same 11-member survey group, were conducted to assess the intuitiveness and functionality of the navigation, content, and usability (Nielsen, 2000).
To test the private side functionality and usability, participants registered, uploaded, and linked resources and populated forms. On both the public and private sides, participants evaluated content, usability, and the search functions. Following corrective actions from the hands-on surveys and as a second pilot test, we again administered the modified User-Perceived Web Quality survey (Aladwani & Palvia, 2002), this time to a community college class (n=9, ages 18-34).
Phase 3 entailed the final survey using the modified User-Perceived Web Quality survey (Aladwani & Palvia, 2002). On May 25, 2012, the survey link was posted on the home page of www.xericenter.com, where users could participate. Only the public side of the site was surveyed. Participants (n=26) completed the survey by July 13, 2012, when it was closed.
Survey participants received gift cards in incremental amounts depending on the number of surveys they completed ($15 for a single usability survey of the search functions toward the end; $20 for the final Likert survey; $30 for the card sort plus primary usability series of surveys).
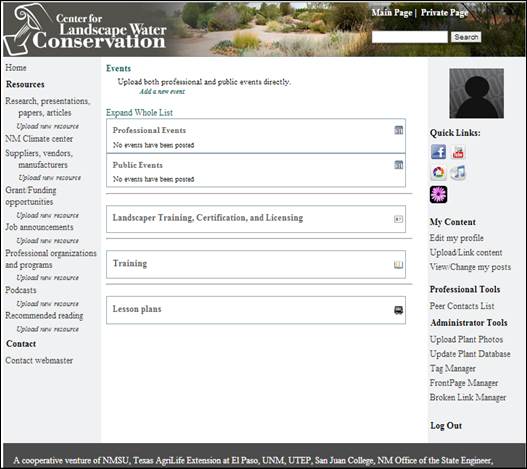
The final public side and the private side homepages are shown in Figure 2 and Figure 3.
Figure 2.
Screenshot of Public Home Page of www.xericenter.com
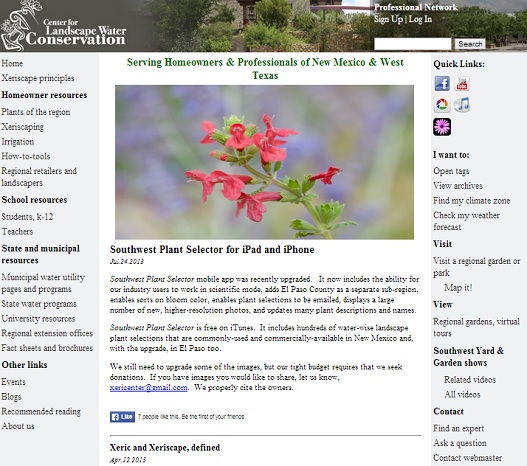
Figure 3.
Screenshot of Private Home Page for Registered Users of www.xericenter.com
Marketing
Over 50% of website traffic results from search engine queries (Evans, 2007). In studies of Google search methodologies, the probable causes found for elevated search rank include the existence and frequency of keywords used in page names, titles, and content, of numerous in-links from highly-ranked (credible) and long-established (trusted) websites, and certification by human-edited directories such as DMoz (The Open Directory) (Evans, 2007). Clean, usable design and layouts attract more traffic, therefore they rank higher in search results over time (Hill et al., 2012). Facebook and Twitter are significant drivers of traffic to websites (Jenders, 2011). We followed the recommendations above; the term "xericenter" is consistently used in all related URLs including YouTube, Picasa, Facebook, and Twitter.
Traditional marketing efforts occupy the second tier of website marketing: trade show attendance, promotional materials, targeted email announcements, partnerships, contests, and conference materials (Wilson, 2011). We participated at public expos such as the New Mexico Xeriscape Expo, distributed postcards and flyers, and placed floor banner displays in public spaces.
Data Analysis
Card sort data were evaluated using raw numbers and percentages. Where responses were confusing, we re-addressed the questions in a subsequent user test. Hands-on user tests solicited specific feedback with yes/no and open-ended questions. There were no "neutral" or "somewhat" options. Individual follow-up with respondents provided clarity for corrective actions.
For the Likert evaluations, response percent distribution was determined for each item. Item means and standard deviations were computed as follows: strongly agree = 5, agree = 4, neutral = 3, disagree = 2, strongly disagree = 1. Responses were evaluated using the survey service statistical data outputs reported as ratios (% of total responses). We used Survey Console <www.surveyconsole.com> for the user tests and the Likert tests.
We used analytics data to assess user numbers, traffic sources, search keywords, and user behavior. We used Google analytics for the website, YouTube analytics for the videos, App Annie (www.appannie.com) for app analytics, and Google Mention to track social media activity and re-postings of our digital resources.
Resources
Required resources included part-time student programmers and subcontracted services by NMSU Media Productions for video production, website templates, and artwork. All programming work was performed on two laptops with NMSU-installed software; server space and server maintenance was existing; server requirements and ongoing labor costs were minimized by offloading content to free services such as YouTube, Picasa, and iTunes.
The total project, including all components, took approximately 3 years (Figure 1) and $90,000, using part-time student labor and outsourced deliverables. At the end of the project we compared the costs and benefits of the digital resources.
Results and Discussion
Development and Evaluation of xericenter.com Website
The use of a Logic Model in pre-development (Figure 1) helped focus and guide the project. The blog proved an effective working prototype to source and categorize content early in the development process.
Hiring an experienced website builder may have been a more efficient use of resources. While student programmers gained job skills, competing academic schedules and a steep learning curve resulted in unplanned outsourcing of templates and a few incomplete tasks. The private login side remains under-populated due to schedule delays.
Feedback from the card sort and usability exercises helped tremendously in guiding development of the website (Sutherin, 2012). The User-Perceived Web Quality Instrument (Aladwani & Palvia, 2002), administered as a snapshot of user satisfaction at completion of each phase, was useful, though in retrospect, not additive. Final survey results will be relevant to our future website managers (Figure 4).
Figure 4.
Final Survey Results Summary of www.xericenter.com Evaluations
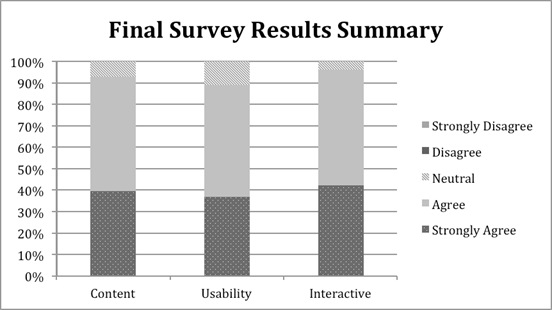
Survey results (Figure 4) supported the core content and usability and interactive website attributes. In all categories, about 90% of the users agreed or strongly agreed that the website was interactive and useful, and had valuable content. This was meaningful because 77% of the 26 respondents who reported their status were homeowners, the primary target user for the web pages surveyed.
- Content was supported, though one user was disappointed the tutorials were not all video format, highlighting a possible need for more video-based content.
- Usability was supported, with three users expressing individual preferences such as different button types, different color contrast, and more images.
- Only one interactivity question was asked because the primarily interactive private side was incomplete.
Regarding marketing, Google Analytics show the top three traffic sources to the website are from Google search, NMSU Extension, and YouTube, emphasizing the importance of selecting credible in-links. YouTube Analytics show traffic primarily driven by YouTube search and suggestions (about 67%). Traffic spikes correlated with attendance at trade expos and the release of Southwest Plant Selector mobile app.
Cost-Benefit Comparison of All Digital Resources
Table 1 identifies the cost-benefit outcome of our experience, not including ongoing or future costs.
| Website www.xericenter.com | YouTube Videos | Southwest Plant Selector app | |
| Cost | $60,000 | $20,000 | $10,000 |
| Development Time | 3 years + ongoing | 6 months | 3 months |
| Impact | 2,100 new visitors (3,300 total visitors)/ 36 months | 55,000 views/ 36 months | 6,500 downloads/ 18 months |
| Current search rank | low | high | high |
The website had 3,300 visits between January 2011 and December 2013, of which 2,100 were new visits. Website traffic declined in 2013 when funding ended for site management and updates, social media posts, and other online and offline activities ceased to drive users to the site. These numbers do not necessarily indicate the website is ineffective because it still requires additional investment to be completely viable. In retrospect, our approach may not have been the best plan for a program with finite resources.
Conversely, since its January 2011 inception, the YouTube channel has had over 55,000 views, with over 36,000 views of one video, How to Set up Your Drip Irrigation System. Video is a one-time investment with no on-going maintenance requirement. Video provided the most benefit for our invested resources.
We significantly defrayed the cost of the app by modifying an existing database, as University of Florida students did in creating a similar regionally specific app for landscape plant selection (Hansen & Purcell, 2012). Promoting the app both online and on social networks boosted downloads, but even now with no support, it is downloaded at a rate of 50-60 per week, confirming the growing use of apps to reach Extension audiences. The app will need future funding for system upgrades.
Conclusions and Implications for Extension Organizations
A well-defined purpose and a specific budget define the scope and priorities of any development project. A user-fed website development approach using iterative testing is imperative to building resources that suit user needs. A Likert-type survey would have been useful in assessing an existing website, but for our development effort, it was not additive.
Evaluating the cost-benefit of various and alternate delivery platforms, the long-term maintenance requirements of various platforms, different development-testing methods, and the impact/reach of various platforms is critically important.
Five years ago, our funding requirements specifically called for a portal to consolidate dispersed resources. Considering the final cost-benefit data (Table 1), the prevalence now of alternative free and low-cost Web-based services like YouTube and Web-hosting services and the expanded use of mobile devices, a different requirement set might be specified today using a lower-cost and more strategically targeted approach.
The implications for Extension organizations, many of which are budget-constrained, are striking.
Video can be quick, easy, and inexpensive, requiring a relatively meager equipment investment and minimal labor for production. Further, there is no long-term commitment with video; once it's done, it's done. Parish & Karisch (2013) describes how to use YouTube and Google to find video subjects that are both over- and under-represented online. A quick Journal of Extension search turned up an instructive article on producing and sharing your own video (Case & Hino, 2010). For us, video has been very effective and was the best choice for targeted instruction.
Social media, such as Facebook and Twitter, require no upfront investment, but need ongoing updates and community interactions from a dedicated caretaker. However, the reach is extensive (O'Neill, Zumwalt, & Bechman, 2011) relative to the time commitment. Mains (2013) provides a concise explanation of the many ways Extension can use Facebook for maximum benefit.
Apps can be an extremely effective resource for Extension because they can effectively target specific needs of Extension's constituents, addressing subject areas from information delivery to collaborative research to self-assessment (Drill, 2012). Mobile apps have upfront development costs, including usability testing similar to website development, and maintenance costs that, depending on functionality and platforms, could involve significant or relatively minimal cost. Apps require ongoing maintenance for system and compatibility upgrades. It is important to identify the potential long-term costs of developing a mobile app.
We found our website to be the most costly and needy of the digital resources we developed. Our small-scale Web portal, using student programmers and outsourced design, required $60,000 and 3 years, 2009 through 2011. It remains incomplete on the professional login side. As reference, a large professionally built website like the Oregon State University Extension website took 10 months and $250,000 in 2010 (Hill et al., 2012). Websites require ongoing maintenance to stay relevant and in working order. However, websites remain a central element for most large organizations, Extension included. No other digital solution works like a website to amass great amounts of information and data.
Website? Video? Facebook? Mobile App? Depends on your specific objectives and budget.
Acknowledgements
This work was funded in part by a grant from the Rio Grande Basin Initiative, a collaborative research program of NMSU and Texas A&M University, awarded to K.L. and R.S.H. Thank you to Jeanne Gleason, Barbara Chamberlain, John Chamberlain, Tomilee Turner, Connie Padilla, and the staff of the New Mexico State University (NMSU) Media Productions and Learning Games Lab, part of the NMSU Cooperative Extension Service, for technical assistance throughout this project. Many thanks as well to Wynn Anderson and John White of the Chihuahuan Desert Gardens at UTEP, Cheryl Garing of the El Paso Botanical Garden, Linda Poe of the Water-wise Garden in Rio Rancho, and Dan Smeal of the NMSU Farmington ASC Xeric Garden. Use of trade names does not imply endorsement of the products named or criticism of similar ones not named.
References
Aladwani, A. M., & Palvia, P. C. (2002). Developing and validating an instrument for measuring user-percieved web quality. Information & Management, 39(6), 467-476. Retrieved from: http://www.sciencedirect.com/science/article/pii/S0378720601001136.
Case, P., & Hino, J. (2010). A powerful teaching tool: Self-produced videos. Journal of Extension Extension [On-line], 48(1) Article 1TOT3. Available at: https://www.joe.org/joe/2010february/tt3.php
Drill, S. L. (2012). Mobile applications for extension. Journal of Extension Extension [On-line], 50(5) Article 5TOT1. Available at: https://www.joe.org/joe/2012october/tt1.php
Evans, M. P. (2007). Analysing Google rankings through search engine optimization data. Internet Research, 17(1), 21-37.
Hansen, G., & Purcell, S. (2012). A smartphone application for landscape plants: A case study and guide to developing a decision-making application. Journal of Extension Extension [On-line], 50(6) Article 6TOT2. Available at: https://www.joe.org/joe/2012december/tt2.php
Hill, P., Rader, H. B., & Hino, J. (2012). Mobile applications for extension. Journal of Extension [On-line], 50(6), Article 6IAW1. Available at: https://www.joe.org/joe/2012december/iw1.php
Jenders, D. (2011). Increased website traffic: the Facebook effect. Retrieved from: http://www.jenders.com/2011/05/09/increased-website-traffic-the-facebook-effect/
Kinsey, J. (2010). Five social media tools for the extension toolbox. Journal of Extension, 48(5), Article 5TOT7. Available at: https://www.joe.org/joe/2010october/tt7.php
Krug, S. (2006). Don't make me think! A common sense approach to web usability. (2nd ed.) Berkley: New Riders Publishing.
Mains, M., Jenkins-Howard, B., & Stephenson, L. (2013). Effective use of Facebook for Extension professionals. Journal of Extension [On-line], 51(5) Article 5TOT6. Available at: https://www.joe.org/joe/2013october/tt6.php
Nielsen, J. (2000). Why you only need to test with 5 users. Retrieved from: http://www.nngroup.com/articles/why-you-only-need-to-test-with-5-users/
Nielsen, J. (2012). Usability 101: Introduction to usability. Retrieved from: http://www.nngroup.com/articles/usability-101-introduction-to-usability/
O'Neill, B., Zumwalt, A., & Bechman, J. (2011). Mobile applications for extension. Journal of Extension Extension [On-line], 49(6), Article 6RIB2. Available at: https://www.joe.org/joe/2011december/rb2.php
Parish, J. A., & Karisch, B. (2013). Determining interest in YouTube topics for extension-authored video development. Journal of Extension Extension [On-line], 51(6), Article 6TOT6. Available at: https://www.joe.org/joe/2013december/tt6.php
Sutherin, S. (2012). Center for Landscape Water Conservation: Developing and evaluating web-based outreach on landscape water conservation (Master's thesis). New Mexico State University, Las Cruces, New Mexico.
Teoh, K. K., Ong, T. S., Lim, P. W., Liong, R. P. Y., & Yap, C. Y. (2009). Explorations on web usability. American Journal of Applied Sciences, 6(3), 424-429.
U.S. Department of Health and Human Services. (2012). What and why of usability. Retrieved from: http://www.usability.gov/how-to-and-tools/methods/index.html
University of Wisconsin-Extension. (2003). Enhancing program performance with logic models. Retrieved from: http://www.uwex.edu/ces/pdande/evaluation/evallogicmodel.html
USEPA. (2012). How to conserve water and use it effectively. Retrieved from: http://water.epa.gov/polwaste/nps/chap3.cfm
Wilson, R. F. (2011). The web marketing checklist: 37 ways to promote your website. Retrieved from: http://webmarketingtoday.com/articles/checklist/