April 2015
|
April 2015 // Volume 53 // Number 2 // Feature // v53-2a5


IT Workforce Development: A Family and Consumer Sciences Community Capacity Model
Abstract
This article examines Extension professionals building community capacity in 10 counties across five Appalachian states in response to the talent crisis in the United States information technology (IT) workforce. The goal has been to transfer IT knowledge and create a supportive environment to foster interest in IT careers among underserved girls in Appalachian communities. The project, funded by the National Science Foundation, incorporates the example of Family and Consumer Sciences agents modeling the structure of Extension. Extension professionals can use this model to pioneer workforce development and community change initiatives.
Introduction
Family and Consumer Sciences (FCS) professionals who work within the Cooperative Extension Service in every state have the responsibility to identify community-based perennial problems and to develop programs to bring about positive change. This article describes an information technology (IT) workforce problem in Appalachia, as well as a deficit of females interested in IT jobs in their community. It offers an example of FCS professionals at the county and state levels working with parents, middle and high school teachers, and school counselors along with key stakeholders in 10 Appalachian counties in five states to bring more females into the IT pipeline. Success in addressing this problem is achieved using a community capacity design funded by the National Science Foundation (GSE/EXT 0832913) that models the Extension infrastructure with train-the-trainer (TTT) workshops extending to a social network analysis (SNA) to visually depict wide community saturation.
Background
There is a talent crisis in the U.S. Information Technology (IT) workforce: as of 2009 women make up only 25%, down from 36% in 1991 (Ashcraft & Blithe, 2010). Earlier research (Meszaros, Lee, & Laughlin, 2007) identified subtle and implicit biases such as gender stereotypical views as a significant factor deterring young women from viewing IT as a viable career choice. These views, often held by school counselors, teachers, and parents, along with stereotypical views about the nature of IT work, communicate negative values and beliefs that are embedded in the local environment surrounding young girls and influencing their career decisions. Lack of encouragement from influential adults or "stokers," preconceived notions, negative attitudes and stereotypes regarding IT, and incomplete knowledge of the breadth of IT jobs are some of the most difficult barriers for girls to overcome when interested in pursuing an IT job (Creamer, Lee, & Meszaros, 2007; Jacobs, Davis-Kean, Bleeker, Eccles, & Malanchuk, 2005; Meszaros et al., 2007; Steinke, 1997). Change is possible, however. With the number of IT jobs increasing and the expansion of IT jobs in rural areas in the U.S., it is critical to develop a skilled workforce. The Appalachian Information Technology Extension Services (AITES) project has offered a community capacity design for addressing this change in Appalachia.
The AITES Project
The Appalachian Information Technology Extension Services (AITES) project has been a five-year, research-based Extension program of training and consulting services with a goal to promote underserved young women's interest in local and regional jobs requiring IT skills. The purpose of the project has been to develop community capacity through a sustainable program of change concentrating on the adults (stokers) who provide social capital to support the girls. Putnam (2000) defines social capital as the "connections among individuals – social networks and the norms of reciprocity and trustworthiness that arise from them" (p. 19). Social capital is seen as necessary for community change and economic development. Community capacity is built when partnerships and informal and formal networks are forged between parents, schools, local IT industry, Family and Consumer Science (FCS) agents, community economic development professionals, and other key community stakeholders. This increases general awareness of IT opportunities, expands attitudes toward IT jobs, and girls' involvement in IT. The research design has paid particular attention to community sensitivities. It is a decades-old approach used Extension that effectively builds social capital.
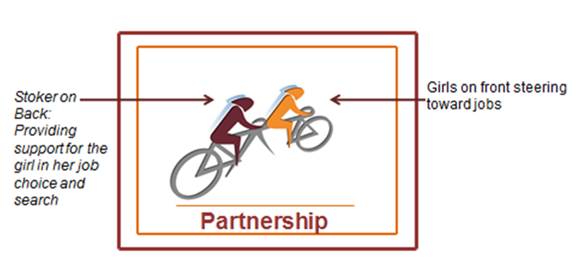
Social capital and community capacity are key concepts in social policy responses to marginalized individuals and communities (Healy, Hampshire, & Ayres, 2004). The Learning Partnership Model (LPM) (Baxter Magolda, 2001) helps bring these constructs together by forming the theoretical underpinning for AITES. It has provided strategies for parents, teachers, counselors, and FCS agents who work with females and provide a large part of the social capital in their lives. The AITES project has used a tandem bicycle metaphor to illustrate this partnership (Figure 1).
Figure 1.
Appalachian Information Technology Extension Services Tandem Bike
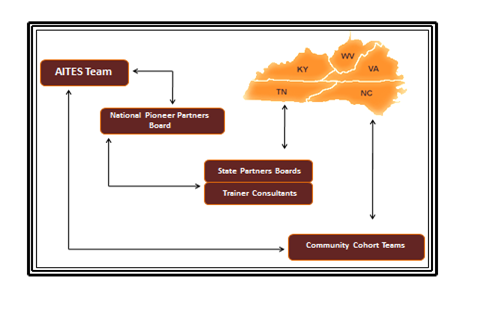
FCS professionals have been prominent in each component of the infrastructure (Figure 2). The project infrastructure models Extension by having state content specialists and teams of professionals who were tasked to carry out the goals of the project through the train-the-trainer model. The AITES community cohort teams include middle and high school teachers, school counselors, and FCS agents. The teams wrote mini-grants to conduct programs to reach out to their peers, who, in turn, also reached out to their peers. This multiplied the number of supportive adults (stokers) surrounding the girls. Advisory boards at the national and state levels are chaired by FCS professionals and provide guidance and evaluation of efforts.
Figure 2.
Appalachian Information Technology Extension Services Infrastructure
The goal of this article is to illustrate the utility of the Extension and training model for building community capacity using the project as an example. The brief description and illustration of the infrastructure above provides contextual bases for the assessment that follows. First, an examination of the changes in collaborative views was conducted to determine if social capital and community capacity were fostered in community team members. Second, workshops were assessed for the reduction of barriers girls encounter when pursuing IT occupations. Finally, a social network analysis (SNA) was conducted to statistically and visually assess the reach and saturation of adult supporters (stokers).
Methods & Results
Goals and Data Collection
Ongoing evaluation is important throughout a project. The practice of evaluation in Extension projects is a long-standing practice (Gruidl & Hustedde, 2003; Workman & Scheer, 2012). Organization of the evaluation of the project reported here focuses on one long-term goal and subsidiary short-term goals. The three short-term goals target the experiences of community team members in building community capacity.
Long-Term Goal: Develop community capacity through a unified sustainable program of change grounded in the Learning Partnership Model (LPM) and based on effective business practices to provide community team members with the necessary tools to increase interest among middle and high school girls in jobs requiring IT skills.
Short-Term Goal 1: Increase community capacity and collaboration through the development of the community team members and partner advisory boards at state and national levels.
Short-Term Goal 2: Develop and implement effective train-the-trainer workshops and related professional development activities at the state and community levels.
Short-Term Goal 3: Use the Extension model to build community capacity and expand social networks that will guide girls toward Information Technology (IT) careers.
Measures
The researchers measured fidelity to project goals through the administration of three different surveys. Measures and sample information are presented below according to the goal assessed. Project participants were nominated by school superintendents and Extension directors. Everyone nominated agreed to participate in the project. The survey responders are a convenience sample of individuals who attended the workshops.
Short-term goal 1 uses the Community Capacity and Collaboration Survey (Marek & Brock, 2004). The survey assessed community capacity and collaboration among community team members. The survey included six constructs related to different forms of potential collaboration: community context, members, process, communication, functioning, and success. All items are scored on a five-point Likert scale with 1 = strongly disagree and 5 = strongly agree and averaged. A total of 116 participants completed the Community Capacity and Collaboration Survey. In year one, 49 participants completed the survey, 26 in year two, 26 in year three, and 15 in year four of the project. Sample size in later years is partially the result of phasing in additional community team members throughout the tenure of the project (i.e., additional team members were added to the project in year two, three, and four; therefore, they were only able to complete the survey for fewer years).
Short-term goal 2 uses the IT Knowledge and Attitudes Survey pre- and post-tests. In the second phase of the project the survey assessed community team members' IT attitudes and knowledge. The survey was completed by 83 respondents and included questions regarding attitudes toward jobs requiring IT skills for girls, the awareness of IT opportunities, and knowledge regarding stokers. In this post-test design, respondents were instructed to complete the survey once for what they believed prior to the workshop and again for what they believed after the workshop was completed. All items are scored on a four point Likert scale with 1 = strongly agreed and 4 = stongly disagree. Items are reverse coded so that a higher value is associated with a higher held belief and averaged. This survey was assessed in years three (n = 51) and four (n = 32) of the project.
Short-term goal 3 is assessed via the Secondary Stoker Survey. This survey was mailed to participants of the mini-grant programs (peers of the community team members) at least 3 months post-activity during year four of the project. Participants reported their outreach through response to 15 questions that focused on who (i.e., teachers, parents, girls) and the number of persons they talked to about the project and on whether they planned on continuing their efforts in sharing the information learned through the program. The survey was administered to 115 participants from 24 mini-grant activities.
Analysis
For short-term goal 1, a one-way ANOVA with Bonferroni post-hoc analysis was conducted using STATA SE 12.1 (StataCorp, 2011) to assess community capacity and collaboration throughout the first four years of the project. Due to the need for anonymity in the Community Capacity and Collaboration survey, no within subject analysis across the four years was assessed.
For short-term goal 2, a one-way ANOVA was conducted using STATA SE 12.1 (StataCorp, 2011) to assess the effectiveness of the workshops between years three and four of the project.
For short-term goal 3, a social network analysis (SNA) was conducted using UNCINET 6. The research team uses SNA to illustrate the reach of a message shared through individuals. SNA maintains the perspective that individuals are tied in a network of social relations and do not act in isolation. It is a tool that creates a sociogram of the many routes taken in building community capacity and spreading the message of the project. Netdraw was used to create the sociogram. The community team members put into action community-wide changes that are evident through the diffusion of the project message. The sociogram provides a visualization of the evaluation data to track knowledge transfer and diffusion of the message. In the context of the project, the SNA examines relationships between the Trainer/Consultant, community team members, and the mini-grant programs.
Findings
Short-Term Goal 1
Short-term goal 1 examines the success of the project in community capacity and collaboration building. All results can be found in Table 1. There are significant differences between all years of the project for all community capacity and collaboration areas assessed within the project (community context, members, process, communication, function, and success), indicating a significant increase in community capacity and collaboration on all constructs during the course of the project. Post-hoc analysis reveals significant between year one and subsequent years of the project for most constructs. These results support the success of short-term goal 1; using the Extension and the train-the-trainer model, community capacity and collaboration increased during the project. For collaborative community context, post-hoc analysis shows that there is an additional significant difference between years three and four of the project. Finally, collaboration success is only significantly different between years one and four; however, an examination of the means finds small increases each year. These two results provide support for the importance of longevity of a program.
|
One (n=49) M (SD) |
Year two (n=26) M (SD) |
Year three (n=26) M (SD) |
Year four (n=15) M (SD) |
F (df) | |
| Collaborative Community Context | 2.84abc (0.53) | 3.86a (0.48) | 3.53bd (0.82) | 4.06cd (0.42) | 27.04 (115)*** |
| Collaborative Members | 3.48efg (0.46) | 4.28e (0.51) | 4.26f (0.48) | 4.35g (0.38) | 26.88 (115)*** |
| Collaborative Process | 3.24hij (0.49) | 3.80h (0.63) | 4.07i (0.57) | 4.12j (0.55) | 18.73(115)*** |
| Collaborative Communication | 3.29klm (0.44) | 3.98k (0.53) | 3.98l (0.52) | 4.15m (0.50) | 23.30 (115)*** |
| Collaborative Function | 3.28nop (0.40) | 3.94n (0.55) | 4.12o (0.46) | 4.00p (0.56) | 22.99 (115)*** |
| Collaboration Success | 7.11q (1.67) | 7.62 (1.96) | 7.91 (1.20) | 8.38q (1.52) | 3.50 (114)** |
| ** p < .01, *** p < .001; Matching alphabet superscripts denote a significant difference between years | |||||
Short-Term Goal 2
The goals of the workshops for years three and four of the project focus on interest in IT careers, awareness of IT careers, and knowledge of the role of the stokers. All results can be found in Table 2. Significant between subject differences are found between years 3 and 4 for the level of pre-test positive IT schemas, pre-test awareness of IT, and pre- and post-test knowledge of stokers. Difference in pre-test awareness of girls' interest in IT is a trend. Differences prevailing in the pre-test levels and not the post-test levels could indicate that workshops had a lasting effect over the year or the combination of the workshop and carrying-out of mini-grant activities helped reinforce the material presented at the workshops.
Team members indicated their knowledge of girls' interests in IT careers increased at a trend level, (F (1, 69) = 3.92, p = .52). During the second half of participation in the project, community team members gained and retained knowledge of girls' interests in IT careers. Awareness of IT careers also increased, F(1, 65) = 5.87, p <0.05), meaning the team members gained knowledge of IT careers throughout their participation in the project. Finally, community team members reported a significant increase in knowledge of stokers over the final two years of the project in both the pre- and post- tests, F (1, 81) = 13.28, p<0.001 and F (1, 81) = 11.04, p<0.01, respectively. During their participation in the project, the team members gained knowledge regarding their role as stokers in influencing girl's career decisions.
These results support the hypothesis that using the Extension and train-the-trainer models can aid individuals in lowering the difficult barriers, specifically stereotypes and lack of knowledgeable sources, encountered by girls when exploring IT career options. However, there is a significant decrease in pre-test positive IT schemas, F (1, 82) = 4.55, p<0.05, indicating that between the workshops during years three and four, community team members reported a lower IT schema. This could be the result of various factors, including the possibility of disillusionment with the IT field or a result of a change in focus of the project during the particular years. It is important to note that while there is a significant reduction in positive IT schema, there is not a corresponding rise in negative IT schema.
|
Year three (n=51) M (SD) |
Year four (n=32) M (SD) |
F (df) | ||
| Reduction of Stereotypes | ||||
| Pre-Positive IT Schema | 2.35 (0.25) | 2.22 (0.28) | 4.55 (82)* | |
| Post-Positive IT Schema | 2.28 (0.35) | 2.31 (0.27) | 0.19 (80) | |
| Pre-Negative IT Schema | 2.53 (0.30) | 2.49 (0.40) | 0.37 (82) | |
| Post-Negative IT Schema | 2.55 (0.33) | 2.56 (0.25) | 0.01 (80) | |
| Pre-Girl IT Interest | 2.33 (0.62) | 2.65 (0.72) | 3.92 (70) † | |
| Post-Girl IT Interest | 2.77 (0.62) | 2.77 (0.71) | 0.00 (73) | |
| Change in Knowledge | ||||
| Pre-awareness of IT | 12.09 (5.13) | 14.69 (3.40) | 5.87 (66)* | |
| Post-awareness of IT | 16.03 (1.94) | 15.87 (2.43) | 0.09 (62) | |
| Pre-stoker knowledge | 0.76 (0.71) | 1.38 (0.79) | 13.28 (82) *** | |
| Post-stoker knowledge | 0.80 (0.75) | 1.44 (0.98) | 11.04 (82)** | |
| † p < .10, * p < .05, ** p < .01, *** p < .001 | ||||
Short-Term Goal 3
Figure 3 provides an example of a sociogram for 1 year of the project and the outreach to the wider community. This model demonstrates the power of the mini-grants delivered by trained teachers, school counselors, and Family and Consumer Science (FCS) professionals and the peers they reached. The bigger the circle, the larger the number of participants reached. The sociogram reflects the project message being spread through the research team and Trainer/Consultants to the community team members (CCT1-34) (#1). The community team members wrote mini-grants and spread the message to groups of people affiliated with schools, Extension, or the local community (#2). The people who attended the activities, hosted by the community team members, agree to become Stokers and share the message of promoting more females to pursue jobs that require IT skills (#3). The participants were categorized by attending an activity affiliated with the school, community, or Extension. Stokers reported who and how many people (secondary stokers) they shared the message with over a period of time through an electronic survey (#4). The Secondary Stokers' contacts are categorized as parents, girls, Extension agents, school administrators, school faculty/staff, higher education, politicians, IT professionals, and others (homeschooling communities, community members/leaders, family members other than parents, friends, colleagues, church groups, and recreational groups). Secondary stoker outreach to parents, girls, Extension agents, school administrators, school faculty/staff, higher education, politicians, IT professionals, and others is estimated through extrapolation to be 6,880 in year four.
Figure 3.
An Example of a Sociogram of Social Network Analysis from Year Four
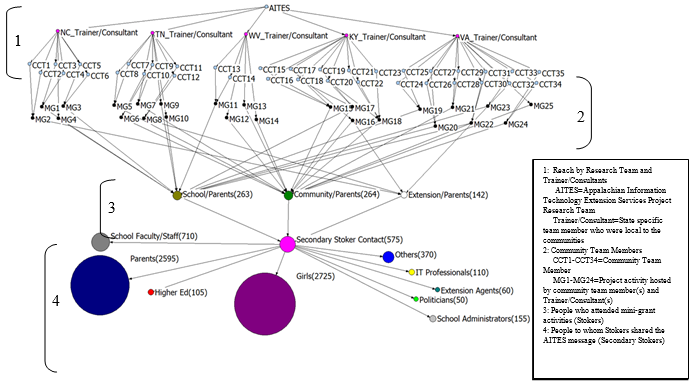
In the four years of the project (year four depicted in Figure 3), community team members from all five states in the project developed mini-grant projects and received funds for 77 activities. Approximately 2,000 parents, teachers, counselors, Family and Consumer Science agents, girls, and other community members were involved in at least one project program hosted by a community team member. Individuals who attended at least one project activity reported sharing the message with approximately 7,058 others. This is an underestimation of the total reach of the message due to a low response rate to the Secondary Stoker Survey (less than 25%). Using extrapolation, which is common to social network analysis (Wassermann & Faust, 1994), a more possible total reach could be 35,290 individuals.
Conclusions
Findings indicate high levels of fidelity in the implementation of the Learning Partnership Model, both within the workshops and the community activities. The project encouraged community capacity and collaboration among community teams in local communities. Furthermore, comparisons between baseline and final year assessments indicate improvements in all six effective collaborative practices.
The community team members demonstrated the development of relationships within the targeted communities to empower others to prompt a deeper understanding of gender inequity within IT by situating learning within a culturally conscious context. This approach framed the workshop content in a manner that supports community members by increasing their knowledge of IT careers, the importance of the role of the adult ("stoker") in creating a supportive environment, and their knowledge of girls' interests in IT. This increase in knowledge encourages the development of community capacity by empowering Family and Consumer Science professionals to share the content with people in the wider community who are the strongest assets in promoting workforce and economic development opportunities for the future generation.
The use of the Extension model allows the transfer of knowledge from the university leadership team to community members. The Family Consumer Science professionals who were team members reached members of the community who otherwise would not have been accessible to middle and high school teachers and school counselors. The model is successful in making progress toward building community capacity as evidenced by the development of the community teams and the diffusion of the message to a large number of parents, teachers, school counselors, Extension professionals, and other stakeholders in the five states. This approach is easily transferred for use by all Extension professionals and may accommodate a variety of community change initiatives.
In this model Extension professionals pioneer an innovative approach to build community capacity and social capital to bring more females into the IT career pipeline. The model builds on the commitment of the Extension profession to empower communities and also becomes an economic, workforce, and human development engine. The success of this model provides a template for Extension professionals in other rural regions to mobilize their communities to build workforce capacity for economic development that will help solve the IT talent crisis.
References
Ashcraft, C., & Blithe, S. (2010). Women in IT: The facts. Retrieved from: https://www.ncwit.org/sites/default/files/resources/ncwit_thefacts_rev2010.pdf
Baxter Magolda, M. (2001). Making their own way: Narratives for transforming higher education to promote self-development. Sterling, VA: Stylus Publishing, LLC.
Creamer, E., Lee, S., & Meszaros, P. (2007). Predicting women's interest in and choice of a career in information technology: A statistical model. In C. J. Burger, E. G. Creamer, & P.S. Meszaros (Eds.), Reconfiguring the firewall: Recruiting women to information technology across cultures and continents (pp. 15–38). Wellesley, MA: AK Peters.
Gruidl, J., & Hustedde, R. (2003). Evaluation of capacity-building programs: A learning organization approach. Journal of Extension [On-line], 41(5) Article 5FEA1. Available at: http://www.joe.org/joe/2003october/a1.php
Healy, K., Hampshire, A., & Ayres, L. (2004). Beyond the local: Extending the social capital discourse. Australia Journal of Social Issues, 39(3), pp. 329-342.
Jacobs, J. E., Davis-Kean, P., Bleeker, M., Eccles, J., & Malanchuk, O. (2005). I can, but I don't want to: The impact of parents, interests, and activities on gender differences in math. In A. Gallager and J. Kaufman (Eds), Gender differences in math. (pp.246-263). New York: Cambridge University Press.
Marek, L. I., & Brock, D. P. (2004). Development of a collaboration assessment tool. Unpublished manuscript.
Meszaros, P., Lee. S., & Laughlin, A. (2007). Information processing and information technology: Career and choice among high school students. In C. J. Burger, E. G. Creamer, & P.S. Meszaros (Eds.), Reconfiguring the firewall: Recruiting women to information technology across cultures and continents (pp. 77–95). Wellesley, MA: AK Peters.
Putnam, R. D. (2000). Bowling alone: The collapse and revival of American Community. New York: Simon & Schuster.
StataCorp. (2011). Stata statistical software: Release 12.1. College Station, TX: StataCorp LP.
Steinke, J. (1997). A portrait of a woman as a scientist: Breaking down barriers created by gender-role stereotypes. Public Understanding of Science, 6, pp. 409-428.
Wassermann, S., & Faust, K. (1994). Social network analysis: Methods and application. Cambridge University Press, Cambridge.
Workman, J. D., & Scheer, S. D. (2012). Evidence of impact: Examination of evaluation studies published in the Journal of Extension. Journal of Extension [On-line], 50(2) Article 2FEA1. Available at: http://www.joe.org/joe/2012april/a1.php