June 2014
|
June 2014 // Volume 52 // Number 3 // Ideas at Work // v52-3iw2


Calculating the "Green" Impact of Online Extension Programs
Abstract
The environmental and economic benefits achieved by participants in an e-learning event are often overlooked by Extension educators, even though they are easy to calculate based on some basic information often collected from participants. To help make it easier to calculate these benefits, which are referred to as "Green" savings, a "Green" savings model has been developed. This model calculates the sum of savings realized by e-learning participants who do not have to travel to face-to-face events. These savings are based on savings related to e-learning participants' travel, time, and vehicles carbon emissions.
"Green" savings estimates the various environmental and economic benefits achieved by participating in an e-learning event versus a similar live, face-to-face event by reducing or eliminating the need to operate a motor vehicle. It is a metric that is often overlooked compared to other standard metrics such as demographics, number of participants, satisfaction level, knowledge change, and other more traditional measures when measuring the effectiveness of e-learning events (Allred & Smallidge, 2010; Rich et al., 2011; Stevenson et al., 2011). An example of "Green" savings associated with an e-learning event can be seen in Figure 1. This example comes from the Forestry and Natural Resources Webinars portal (http://www.forestrywebinars.net), a service of the Southern Regional Extension Forestry Office, North Carolina State University's Extension Forest Resources, Texas AgriLife Extension Service, and other participating land-grant universities.
Figure 1.
Screen Shot of a Webinar's "Green" Savings Analysis as Found on the Forestry and Natural Resources Webinars Portal (http://www.forestrywebinars.net)

Model Assumptions
The "Green" savings model uses standard formulas for calculating the savings and is based on the following nine assumptions.
- The participant will travel to attend similar face-to-face training as the e-learning event at a facility such as a university classroom or Extension office in their state.
- Only one registered participant will travel per vehicle.
- A participant will claim the United States Internal Revenue Service standard mileage rate for business miles driven ($0.565/mile) (IRS, 2012).
- The average rate of travel for a participant is 52 miles per hour.
- The average fuel economy (miles per gallon) for a participant's vehicle in the United States is 21.4 MPG (Project America, n.d.).
- The average hourly wage for a registered participant is dependent upon the targeted audience of the Internet-based education event. For example, a program targeting foresters would set the wage rate at $26.28/hour (Bureau of Labor Statistics, 2012).
- A gallon of unleaded gasoline releases 19.4 pounds of CO2 when burned in a typical internal combustion engine (EPA, 2005).
- There are 2,204.62 pounds (lbs) in a metric ton (tonne or t).
- The social cost of producing a metric ton of CO2 is $6/tCO2e. (Peters-Stanley & Hamilton, 2012).
"Green" Savings Calculation
"Green" savings of an e-learning event is calculated as the sum of motor vehicle operating savings ($), salary savings ($) and the CO2 savings ($) associated with a participant's travel. Each value is dependent upon the Distance estimate as described below.
Distance
Distance is the geodesic distance measured in miles and is the shortest distance between any two points on the Earth's surface. Since distance is being measured on the earth, which is similar in shape to a sphere, the Haversine formula is used for the calculation. This requires the latitude and longitude of the participant's location during the e-learning event and the location of the nearest in-state regional Extension office or university that would have otherwise hosted a similar face-to-face event. The latitude and longitude, of the participant's location and the central location where a similar event would be held are derived from the zip codes of each location available from published tables or through Web-based programs that can geocode zip code data. The formula used to calculate distance (d) is:

where:
 = Earth's radius in Miles (3958.818 miles).
 = Latitude (in radians) of an alternative site that the participant would go to in order to attend a face-to-face presentation of the webinar.
 = Longitude (in radians) of an alternative site that the participant would go to in order to attend a face-to-face presentation of the webinar.
 = Latitude (in radians) of the participant's location in which they are viewing the Internet-based educational event.
 = Longitude (in radians) of the participant's location in which they are viewing the Internet-based educational event.
Once distance is estimated for each participant, Motor Vehicle Operating Savings, Salary Savings, and CO2 Savings are calculated using the following methods.
Motor Vehicle Operating Savings ($)
Cost savings associated with not having to operate a motor vehicle is based on the e-learning participant's round-trip distance(d) that would have been traveled if attending the event at a face-to-face meeting location. The formula for calculating the savings is

where:
 = Distance (miles)
 = Standard Business Mileage rate ($0.565/mile)
Salary Savings ($)
Salary Cost Savings is calculated based on the estimated time it would have taken the e-learning participant to travel the round-trip distance (d) to a face-to-face meeting location. The formula to calculate salary cost savings is

where:
= Distance (miles)
 = Average wage paid per hour ($/hour)
 = Average rate of travel (miles/hour)
CO2 Savings ($)
The Social Cost of Carbon (SCC) is the estimated external cost from CO2 emissions. It is intended to include monetized damages due to changes in net agriculture productivity, human health, property damages from weather changes and the value of ecosystem services. This cost is based on the pounds of CO2 not released (CO2 Savings) because e-learning participants did not have to travel to attend the event. CO2 Savings is calculated using the following formulas.
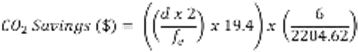
where:
= Distance (miles)
 = Average fuel economy (miles/gallon)
19.4 = pounds of CO2 when burned in a typical internal combustion engine
6 = social cost ($) of producing a metric ton of CO2
2204.6 = number of pounds (lbs) in a metric ton (t)
Summary
"Green" savings is a measure associated with e-learning. It is rarely calculated and reported. It is simple to calculate and requires basic information that is often collected from participants. The measure is based on the sum of savings realized by e-learning participants who do not have to travel to face-to-face events. These savings are associated with savings related to e-learning participants travel, time, and vehicles carbon emissions. The model makes it possible for Extension educators to measure immediate environmental and economic benefits of e-learning.
References
Allred, S. B., & Smallidge, P. J. (2010). An educational evaluation of Web-based forestry education. Journal of Extension [On-line], 48(6) Article 6FEA2. Available at: http://www.joe.org/joe/2010december/a2.php
Bureau of Labor Statistics. (2012). Occupational employment and wages, 18-1032 foresters. United States Department of Labor. Retrieved from: http://www.bls.gov/oes/current/oes191032.htm
EPA (2005). Emission facts: Greenhouse gas emissions from a typical passenger vehicle. Office of Transportation and Air Quality, United States Environmental Protection Agency, EPA420-F-05-004. Retrieved from: http://nepis.epa.gov/Exe/ZyPDF.cgi?Dockey=P1001YU0.PDF
IRS (2012) 2013 standard mileage rates. Notice 2012-72. Internal Revenue Service, United State Department of the Treasury. Retrieved from: http://www.irs.gov/pub/irs-drop/n-12-72.pdf
Peters-Stanley, M., & Hamilton, K. (2012). Developing dimension : State of the voluntary carbon markets 2012 (pp. 1–110). Retrieved from: http://www.forest-trends.org/documents/files/doc_3164.pdf
Project America. (n.d.) Transportation: Cars: Average miles per gallon. Retrieved from: http://www.project.org/info.php?recordID=384.
Rich, S. R., Komar, S., Schilling, B., Tomas, S., Carleo, J., & Colucci, S. (2011). Meeting Extension programming needs with technology: A case study of agritourism webinars. Journal of Extension [On-line], 49(6) Article 6FEA4. Available at: http://www.joe.org/joe/2011december/a4.php
Stevenson, J. L., Moore, D. A., Newman, J., Schmidt, J. L., Smith, S. M., Smith, J., Kerr, S., Wallace, M., & BoyEs, P. (2011). Development and evaluation of an on-line educational module for volunteer leaders on bio-security in Washington State 4-H livestock projects. Journal of Extension [On-line], 49(6) Article 6RIB6. Available at http://www.joe.org/joe/2011december/rb6.php