February 2014
|
February 2014 // Volume 52 // Number 1 // Tools of the Trade // v52-1tt8


Challenges of Engaging Local Stakeholders for Statewide Program Development Process
Abstract
The University of Missouri Extension needed to develop an annual program review process that collaboratively engaged county-level stakeholders. The results from the first 2 years highlight the results, challenges, and implications of the design process. The annual review process needs to be adaptive, responsive, and reflective from year to year when engaging with local stakeholders. For example, the 2012 program review process changed from the prior year to focus on participant mind mapping to better engaged stakeholders and to produces more detailed data. The process has ensured more engagement with local stakeholders and generated information helpful to regional faculty members.
Introduction and Background
The University of Missouri Extension is engaged in its third year of collaboratively engaging with county-level stakeholders in an annual program planning process. The process began as a mandate from the Agricultural Research, Extension, and Education Reform Act of 1998 (AREERA), which required annual stakeholder input at the local level to help drive decisions at the state level (National Institute of Food and Agriculture [NIFA], United States Department of Agriculture, 2012). However, the mandate from AREERA did not provide clear directions for how to collect the data. The need to capture local stakeholder input is not new in Extension (Cummings & Boleman, 2006; O'Neill, 2010) and the challenges in collecting stakeholder input have been documented (Kelsey & Mariger, 2002).
The mandate from NIFA required us to think critically about stakeholder input. We leaders realized that asking 114 county Extension offices to conduct an annual assessment of issues and review programs would fatigue local stakeholders unless the process was engaging and relevant to local programming. In addition, we were challenged with how to analyze the locally generated data help produce to meaningful information for state-level MU Extension program decisions.
Process
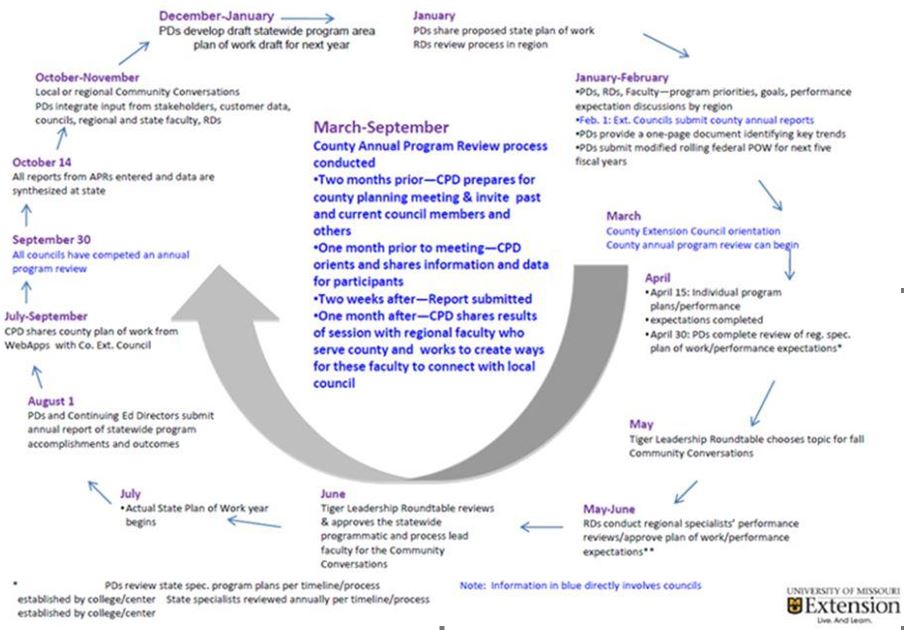
The basic Annual Program Planning process entailed three phases for local engagement of county Extension councils and community members: 1) design data collection process and train local Extension specialists; 2) engage local Extension councils and community members in the process; and 3) analyze data and provide statewide programmatic recommendations. One graduate assistant, specifically hired for this process, analyzed and synthesized all data under the guidance of two MU Extension leaders. Figure 1 provides an outline of the process in more detail.
Figure 1.
The 2011Statewide MU Extension Annual Program Plan
The 2011 Process
After piloting with five county councils in 2010, the process went statewide in 2011, with 108 Missouri counties participating. Facilitating specialists (often from another county) asked these open-ended questions:
- What are the 3-5 issues, opportunities, or challenges that are impacting you, families, businesses, farms, local organizations, the communities, and county?
- Which of these provide opportunities for Extension to address?
- What programs are we currently delivering that we should continue as is?
- What programs are we currently delivering that we should change or update?
- What programs are we currently delivering that we should stop doing to address more important issues?
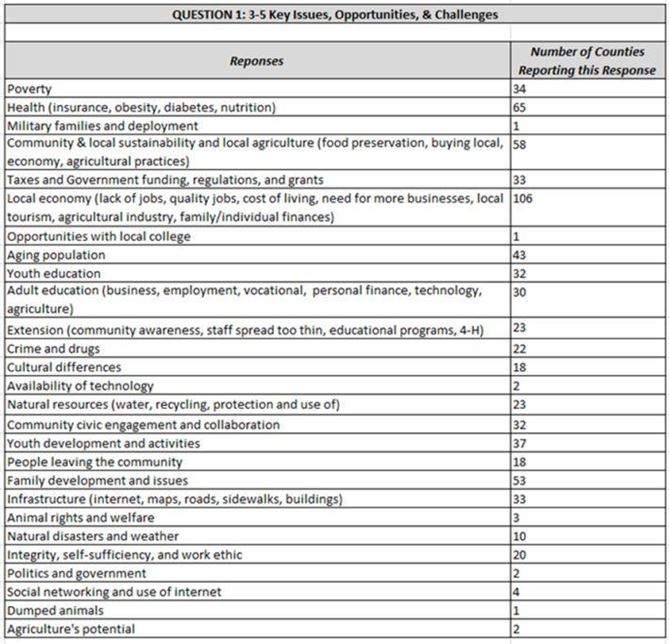
The findings highlighted the complexity and enormity of the task. Over 750 stakeholders produced 1193 unique responses from the questions. These responses had substantial value at the county and regional levels. Statewide data analysis consisted of merging identical or similar responses from each question and tallying how many counties reported the comment (Table 1). Statewide recommendations developed by the program directors were consequently limited in detail and scope. The most significant conclusion was that the general key programmatic issues identified gave validity to the new strategic themes of MU Extension. The data also indicated many issues related to program delivery and criteria for program cancellation.
Table 1.
2011 Statewide Analysis Sample
The 2012 Process
In 2012 the process became more innovative and focused on specific Extension strategic themes. The evolution of this process highlighted the need for adaptive, responsive, and reflective practices at the local and state levels. This time, 111 counties and 1,180 participants addressed these questions:
- What are the community, economic, business, and workforce development issues in your community?
- What are the global food systems issues in your county?
- Discuss where different programmatic delivery methods might work with programming in your county.
- Identify and discuss the criteria you feel should be used to determine what programs should be offered or discontinued in your county.
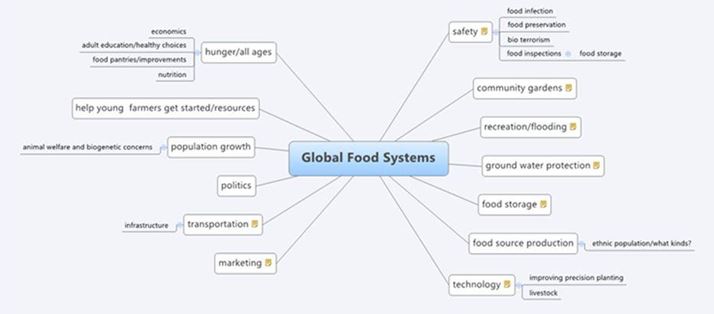
The first two questions engaged local participants in mind-mapping activities. Figure 2 depicts one local map created using X-mind software, which followed the ripple effect mapping process (Kollock, Flage, Chazdon, Paine, & Higgins, 2012).
Figure 2.
Sample of a Missouri County's Mind Map
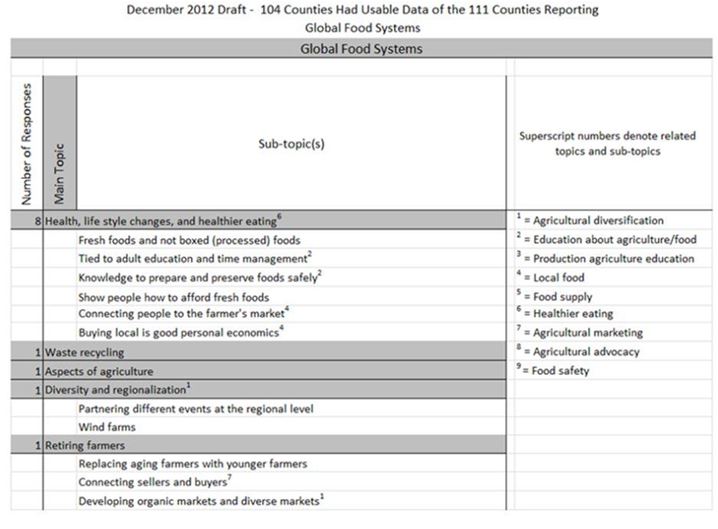
Local participants were asked to use dots to identify the top priority items from each mind map. Photos of the maps and the two items receiving the most votes from each map were shared with us for analysis. The last two questions were in response to the findings from 2011. The more focused nature of the data collected allowed for detailed analysis and synthesis. For example, the priorities identified in mind maps allowed us to aggressively group related comments. Figure 3 provides a small sample of the findings. The 2012 process created initial linkage for new strategic themes and criteria for program offerings.
We developed regional mind maps from counties in each region. As regions were realigned in 2013, these were important for local faculty, new regional directors and the emerging program teams around the larger issues.
Figure 3.
2012 Statewide Analysis Sample
The 2013 Process
In 2013, the regional facilitators are working with local stakeholders to map the other three strategic themes (educational attainment, health systems, and environmental concerns).
Benefits and Limitations
The process has ensured more engagement with local council stakeholders and generated information helpful to regional faculty members. Regional and state program directors have additional data upon which to build programs. New collaborations also formed among faculty to address identified needs. Additionally, the local dialogue is seen as one of the most positive aspects.
Limitations do exist. The data generated is limited by who participates in the local process and the 2 hours generally allocated for the facilitated process. Variation naturally occurs in the facilitation and recording process despite training provided through webinars, presentation templates, data templates, and printed support materials. Reports sent to us can vary in depth and detail. Finally, the issues represented from the mind mapping are limited because only the top two items from voting are reported—losing some of the richness.
Conclusions
The process has proven valuable in regularly engaging local Extension council members and providing significant input to local faculty. Similarly, the process has generated information of value for regional analysis. At the state level, the process provides a general view, but has been limited in utility for determining specificity. The potential exists to use these results to fashion a statewide survey to be delivered directly to individuals on a larger scale.
References
Cummings, S. R., & Boleman, C. T. (2006). We identified issues through stakeholders input—Now what? Journal of Extension [On-line], 44(1). Article 1TOT1. Available at: http://www.joe.org/joe/2006february/tt1.php
Kelsey, K., & Mariger, S. C. (2002). MA case study of stakeholders needs for extension education. Journal of Extension [On-line], 40(2). Article RB2. Available at: http://www.joe.org/joe/2002april/rb2.php
Kollock, D. H., Flage, L., Chazdon, S., Paine, N., & Higgins, L. (2012). Ripple effect mapping: A "radiant" way to capture program impacts. Journal of Extension [On-line], 50(5). Article 5TOT6. Available at: http://www.joe.org/joe/2012october/tt6.php
MU Extension. (2013). Program integration. Retrieved from: http://extension.missouri.edu/staff/pi-questions.aspx.
O'Neill, B. (2010). Obtaining high-quality, "low maintenance" stakeholder input: How to create a virtual statewide extension program advisory committee. Journal of Extension [On-line], 48(2). Article 2TOT3. Available at: http://www.joe.org/joe/2010april/tt3.php
United States Department of Agriculture. (2012). AREERA State Plans of Work. Retrieved from: http://www.csrees.usda.gov/business/reporting/planrept/plansofwork.html.